Do you compare your investment portfolio’s performance to a popular stock that you hear about on CNBC?
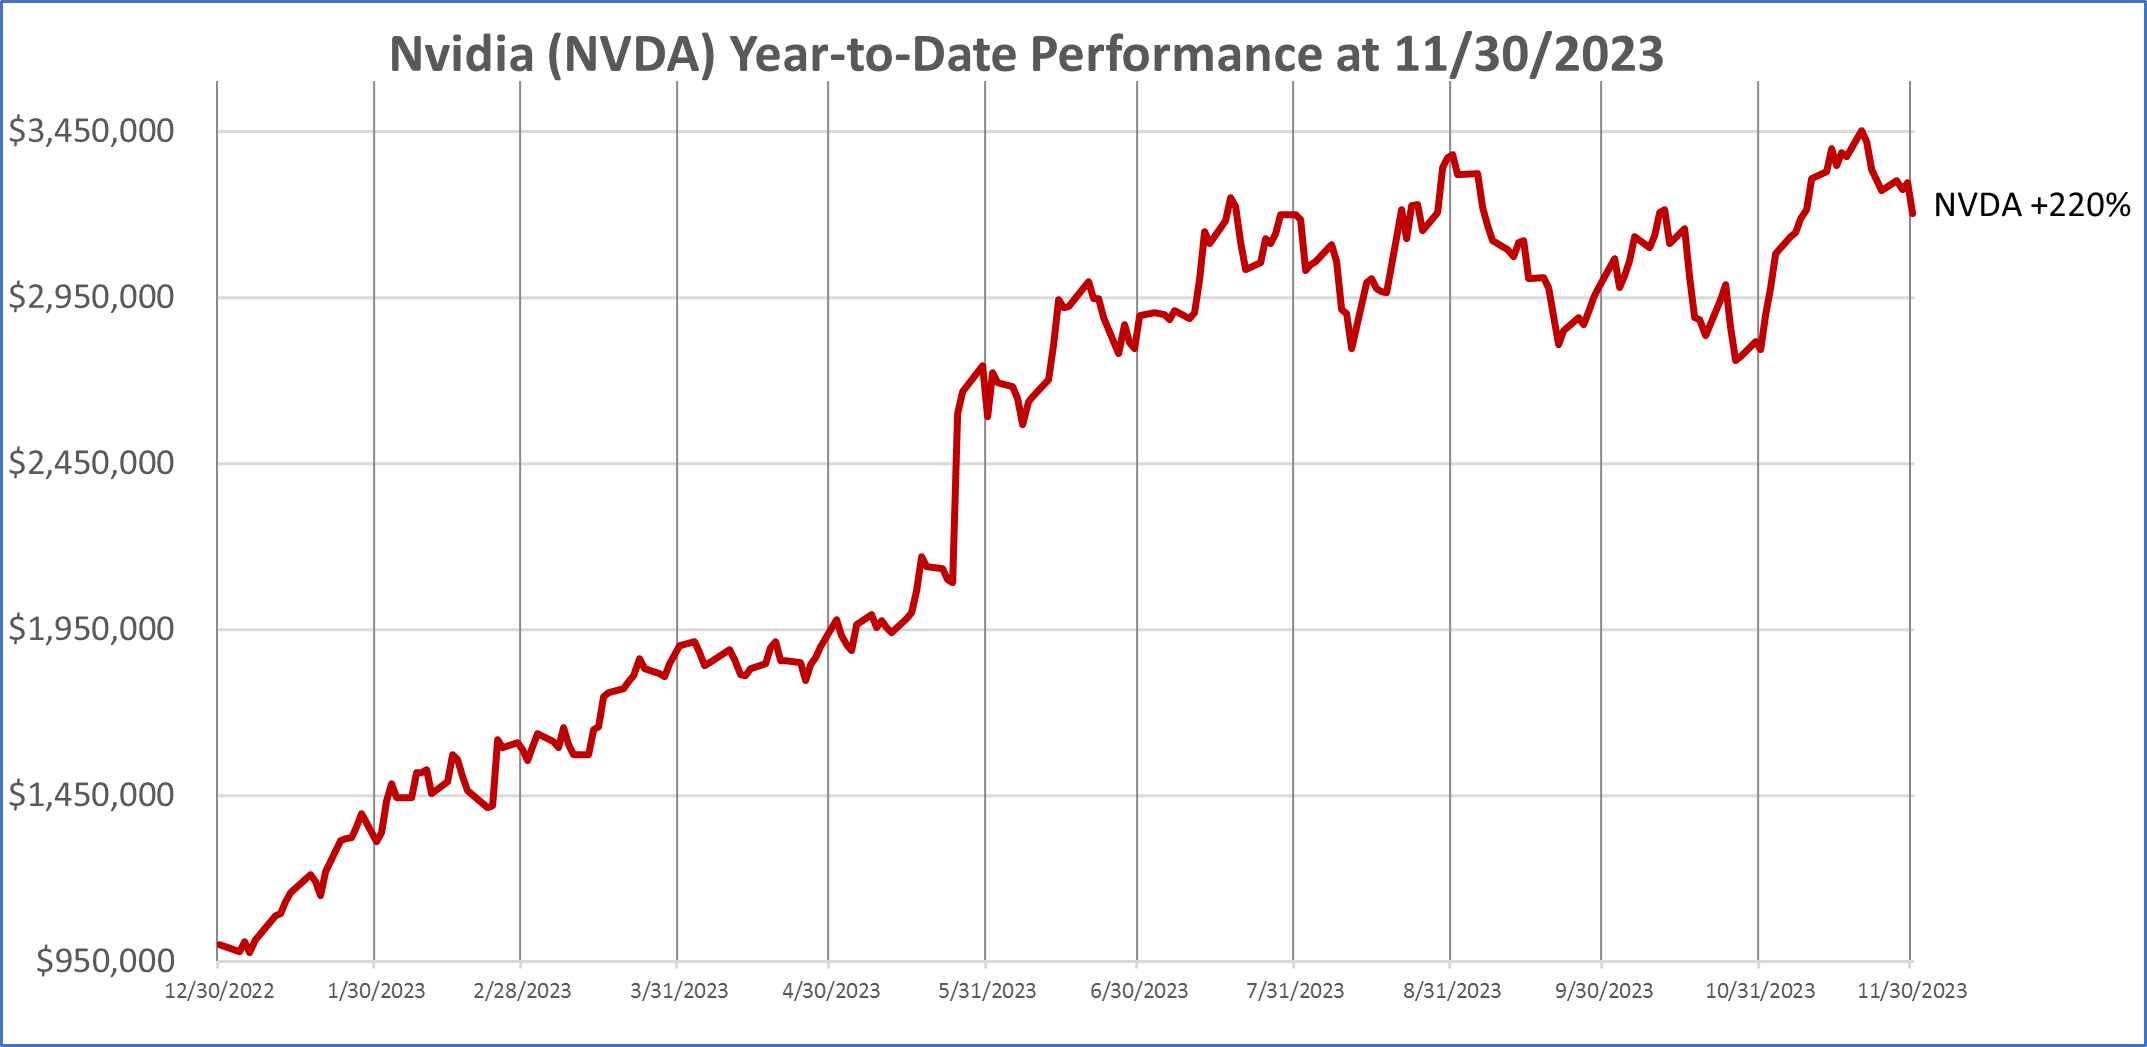
This is the daily chart for Nvidia, a single stock that soared +220% year-to-date through November 30, 2023. [i]

Maybe you compare your portfolio to the S&P 500.
Year-to-date through November 30, 2023, the S&P 500, represented by the SPDR S&P 500 ETF (SPY), is up +20.7%. [ii] It might be appropriate to use the S&P 500 as your benchmark if you invest all your money in large and mid-sized companies that are domiciled in the United States. However, if you are using an important tool like many investors in managing investment risk – diversification – that is, spreading your investments among and within different asset classes, then comparing your performance to the S&P 500 is likely to leave you disappointed.
This year, that disappointment is likely to be WORSE because as we discussed last month in Year-to-Date U.S. Stock Performance in Pictures, the S&P 500 performance thus far this year had been dominated by just 7 stocks – the Magnificent 7 – which Torsten Slok, Chief Economist at Apollo Asset Management said were becoming more and more overvalued and, in our view, more dangerous to invest in. [iii] Are we headed toward a big loss like post the year 2000, when the dot com stocks fell and the S&P 500 had fallen -49% from its peak on March 27, 2000, to its low On October 9, 2022? [iv]
At CIG, we believe in the adage, “Don’t put all your eggs in one basket”. We employ active asset allocation to employ varying levels of exposure to various sectors of domestic and international stocks, fixed income, and alternatives, such as gold and commodities, in an attempt to manage risk throughout market cycles.
How do we compare our strategies’ performance?
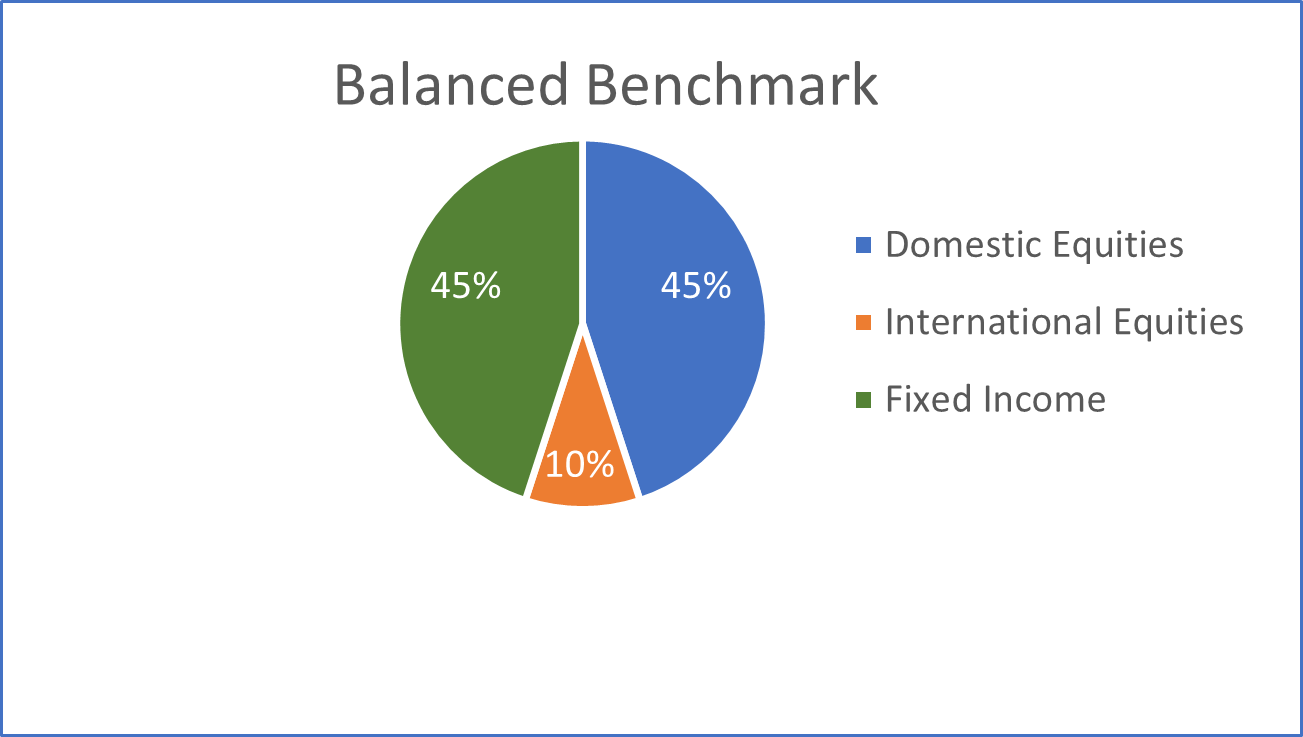
At CIG, we utilize benchmarks that are invested in a blend of three major asset classes- domestic equities, international equities, and fixed income.
- Domestic equities are represented by the Russell 3000 Index, a market capitalization-weighted index which measures the performance of the 3,000 largest U.S. companies and representing approximately 96% of the investible U.S. equity market. [v]
- International equities are represented by the MSCI ACWI ex USA Index, an index covering approximately 85% of the global equity opportunity set outside of the United States. [vi]
- Fixed income is represented by the Bloomberg U.S. Aggregate Index, an index composed of investment-grade government and corporate bonds. [vii]
The pie chart below illustrates the weightings of the three major asset classes in our balanced benchmark. We compare the performance of our clients whom we generally describe as balanced investors to the performance of this balanced benchmark.

In the following bar chart, we compare year-to-date performance of the components of our balanced benchmark to the S&P 500 and Equal-Weighted S&P 500 as of November 30, 2023.

Year-to-date, the Russell 3000 – the domestic equity index we use in our benchmarks – gained +17.8%. The Russell 3000 has a similar issue to Magnificent 7 stock dominance, with 24% of the index invested in these seven stocks but not to the same extent as the S&P 500, with 28%. [viii] Over the same period, the MSCI ACWI ex USA index (ACWX) gained +10.1%, less than half of the S&P 500, and the Bloomberg U.S. Aggregate Index (AGG) was only up +1.9%. [ix] This year, if you employed diversification – spreading your investments among and within different asset classes in the chart above instead of only investing in the S&P 500, you clearly experienced lower returns than the S&P 500.
Now that we have told you about our balanced benchmark, what is the appropriate period to assess how one has done versus the benchmarks? Should you look at it every day? How should we be looking at returns and the amount of risk you are taking?
We prefer to look at returns and risk over a trailing 3-year period. We measure risk using the standard deviation of returns. The CIG Dynamic Balanced Composite trailing 3-Year annualized return as of November 30, 2023, is +2.30%, net of fees, and the 3-year standard deviation is 6.6%. [x] The Balanced Benchmark’s trailing 3-year annualized return as of November 30, 2023, is +1.95% and the 3-year standard deviation is 14.2%. [xi]
You can see in the chart below that the CIG Dynamic Balanced Composite is taking less than half (46%) of the risk, as measured by the standard deviation of annualized three year returns, of the balanced benchmark [xii] and is returning 118% of the balanced benchmark’s return on a trailing 3-year annualized basis. [xiii]

At CIG, we believe in risk-balanced investing. We believe investors should consider how much risk they are taking to achieve returns. We think that we should be striving to reach the return necessary to meet the various needs of our client’s financial plans while, at this point in the market cycle, taking as little risk as possible to meet that goal. We want you to sleep at night.
Speaking of risk, let’s go back to the first chart on page one, Nvidia (NVDA). Nvidia has experienced many booms and busts over the years. The stock is currently booming, up +220% year-to-date through November 30, 2023, due to surging sales of its artificial intelligence chip. [xiv] As of December 31st, 2023, we own a small amount of Nvidia in our dynamic and strategic balanced and growth models [xv] via our iShares Semiconductor ETF SOXX holding.
We are very cautious regarding NVDA, the company has experienced two large losses in the past five years. In the fourth quarter of 2018, NVDA stock suffered a -56% drawdown in 82 days [xvi] due to the company warning about excess inventory of graphic chips for gaming. [xvii] In 2022, NVDA stock suffered a -66% drawdown in 329 days [xviii] as cancelled orders from personal computer makers and weakness in crypto mining orders negatively impacted sales and earnings. [xix]
So, what is your benchmark, an individual stock like Nvidia that fell -66% in 329 days in 2022, or an index like the S&P 500 that fell -49% from its peak on March 27, 2000, to its low On October 9, 2022?
We counsel investors to understand what they are invested in – typically a diversified portfolio – and measure their results with the appropriate diversified, blended benchmark. Life is too short to be frustrated.
If you are not a client, we are happy to review how much risk that you are taking to achieve your returns. Please reach out to Brian Lasher (blasher@cigcapitaladvisors.com), Eric T. Pratt (epratt@cigcapitaladvisors.com) or the rest of the CIG team.


