
Update from CIG Asset Management: Extremes May Create Opportunities
The stock market rally continues. Through June 13, 2024, the S&P 500 has gained +14.7% year-to-date and we still haven’t seen a single-day decline of over 2% in 479 days, the third longest stretch in the past 25 years. [i] We wrote about this extraordinary winning streak in last month’s update, Where are we now?
This year, some investors who have a diversified portfolio that owns many stocks across many sectors, may feel like they are missing out on the current rally. They may see on CNBC or read in the Wall Street Journal that the market is at its all-time high, yet their own portfolio is not.
Closely examining the following extreme market internals; narrow sector performance, large market cap outperformance and S&P 500 index concentration can help explain what is happening beneath the surface.
Sector performance is narrowing again. In our CIG Asset Management Update on April 1, 2024, we discussed encouraging signs that the stock market rally may be broadening. We may have been early on that call. As you can see in the chart below, month-to-date at June 14, 2024, the technology sector has gained +9.1%, communication services – which is mostly comprised of Meta and Google – advanced +1.7%, and the other nine of the eleven S&P 500 sectors were all down. [ii]
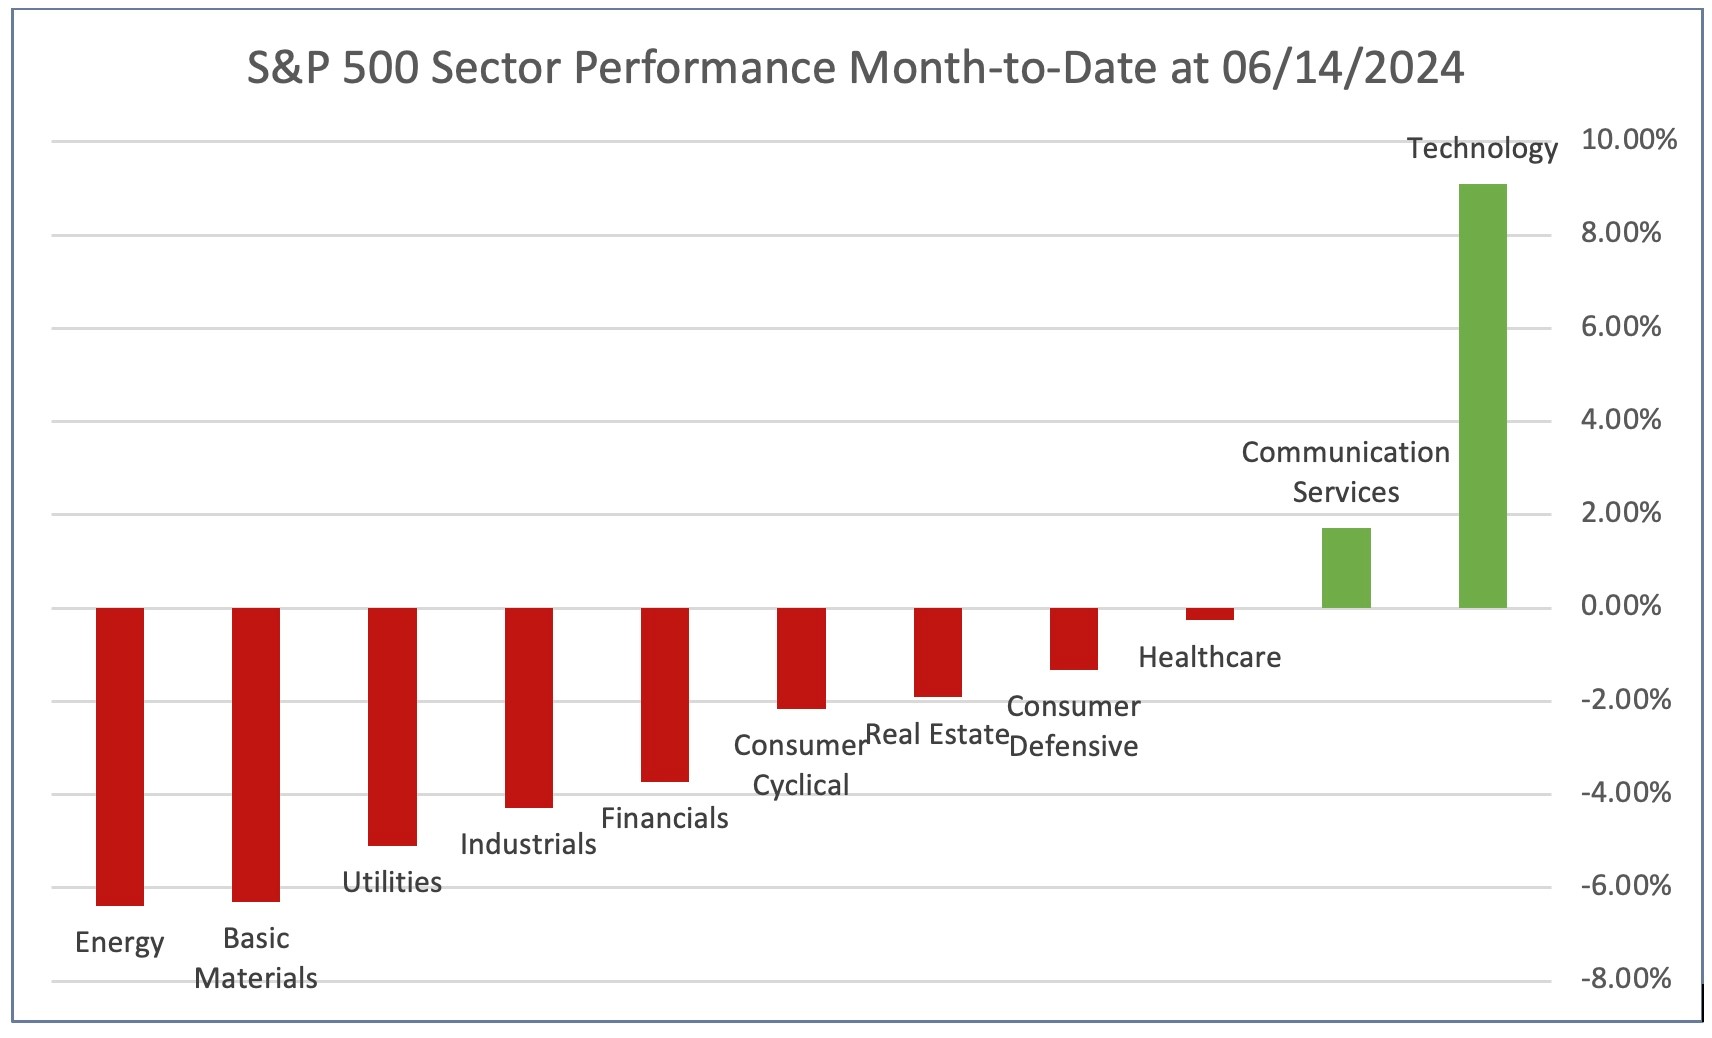 Chart by CIG Asset Management using data from FinViz
Large market-cap out performance. The S&P 500 index is weighted by market capitalization– that is, the larger the total value of the company, the higher the weighting in the index. It’s currently experiencing historic outperformance versus the equal-weighted S&P 500. In fact, while the S&P 500 – represented by the SPDR S&P 500 ETF Trust (SPY) has advanced +14.6% year-to date through 06/14/2024, the equal-weighted S&P 500 500 – represented by the Invesco S&P 500 Equal Weight ETF (RSP) is only up +4.2%. [iii] .
The following chart shows the relative performance of the market-cap weighted S&P 500 (SPY) versus the equal-weighted S&P 500 (RSP) for the 5-year period ending June 14, 2024. When the blue line is below 1.0, RSP is outperforming SPY. As you can clearly see, this has been a rarity over the past five years.
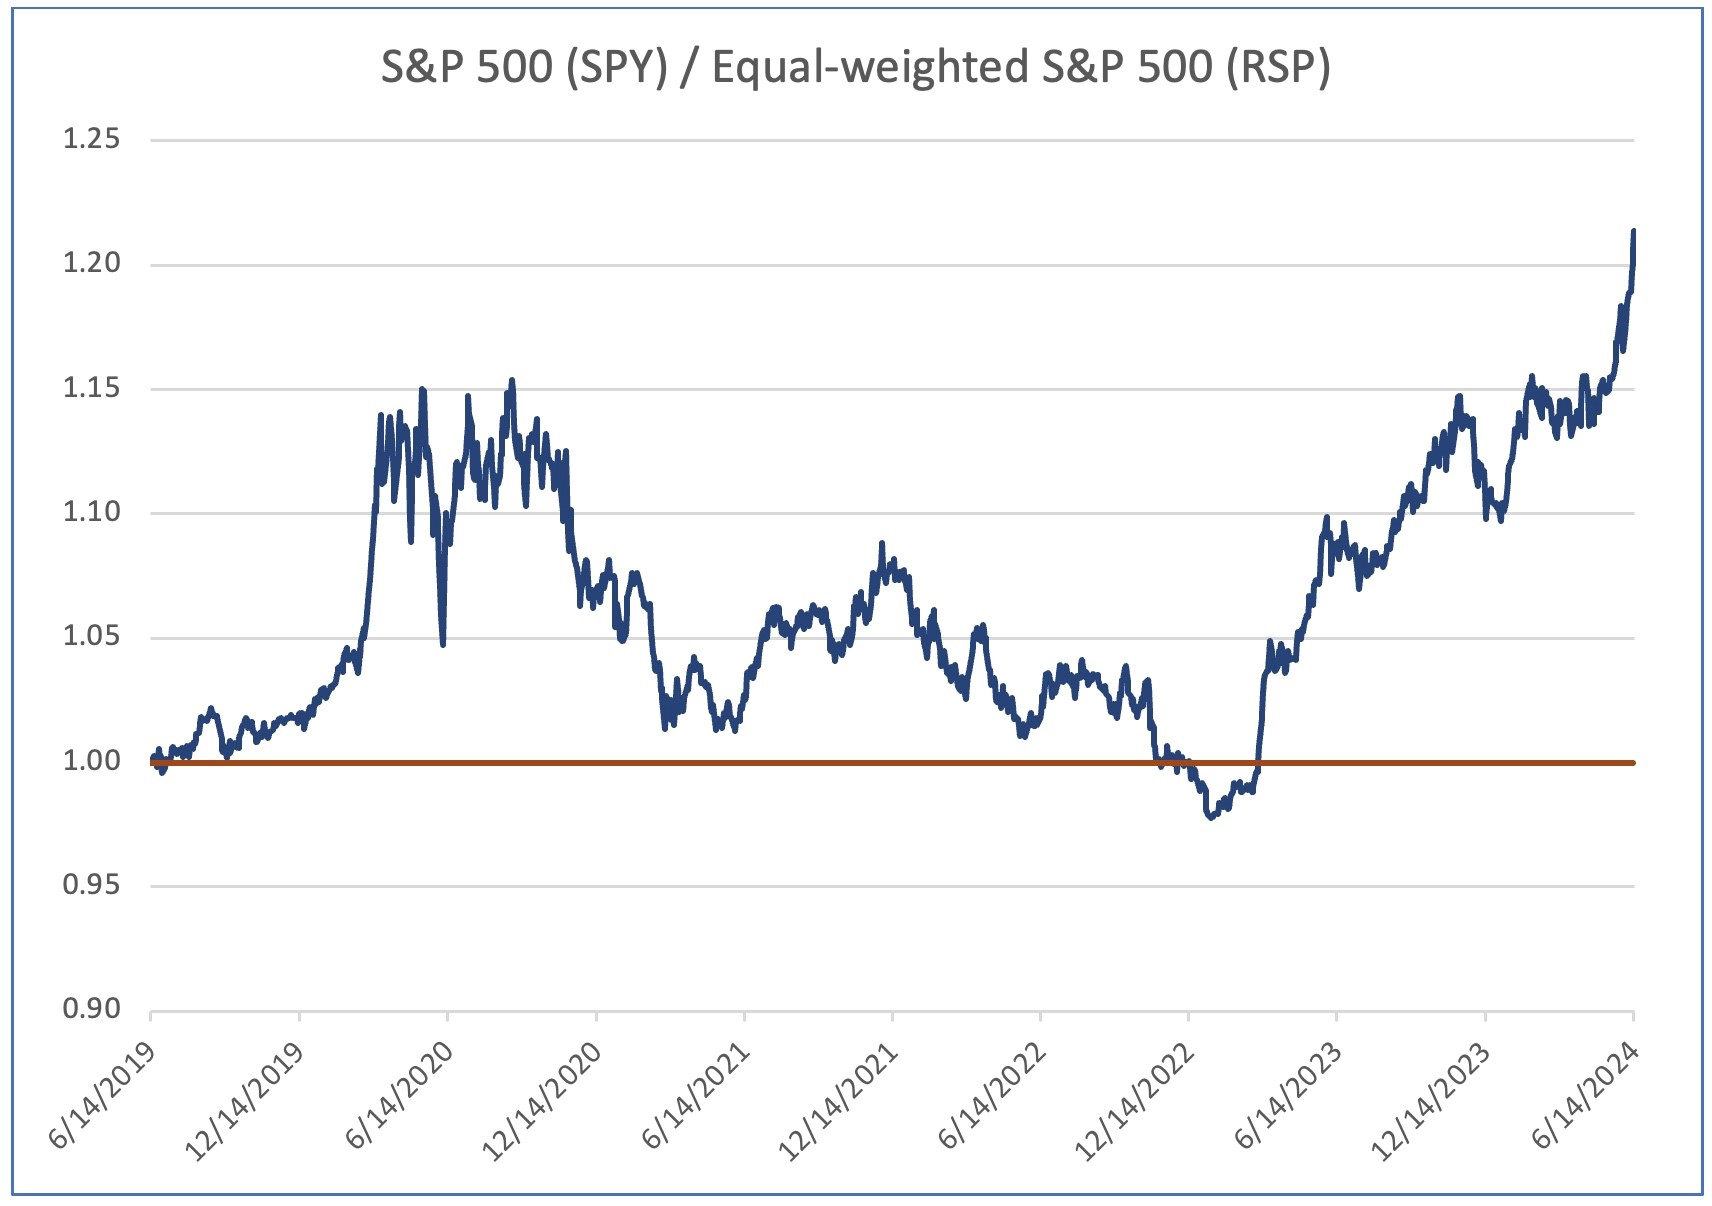 Chart by CIG Asset Management using data from Barchart.com.
The slope of the blue line has recently been increasing – this indicates that the outperformance is widening. This tells us that the larger companies are outperforming the smaller companies. What companies are outperforming? The answer is large-cap stocks in the technology sector, and we believe their returns are being driven by the hopes that Artificial Intelligence (AI) will contribute massive revenues and earnings to this sector.
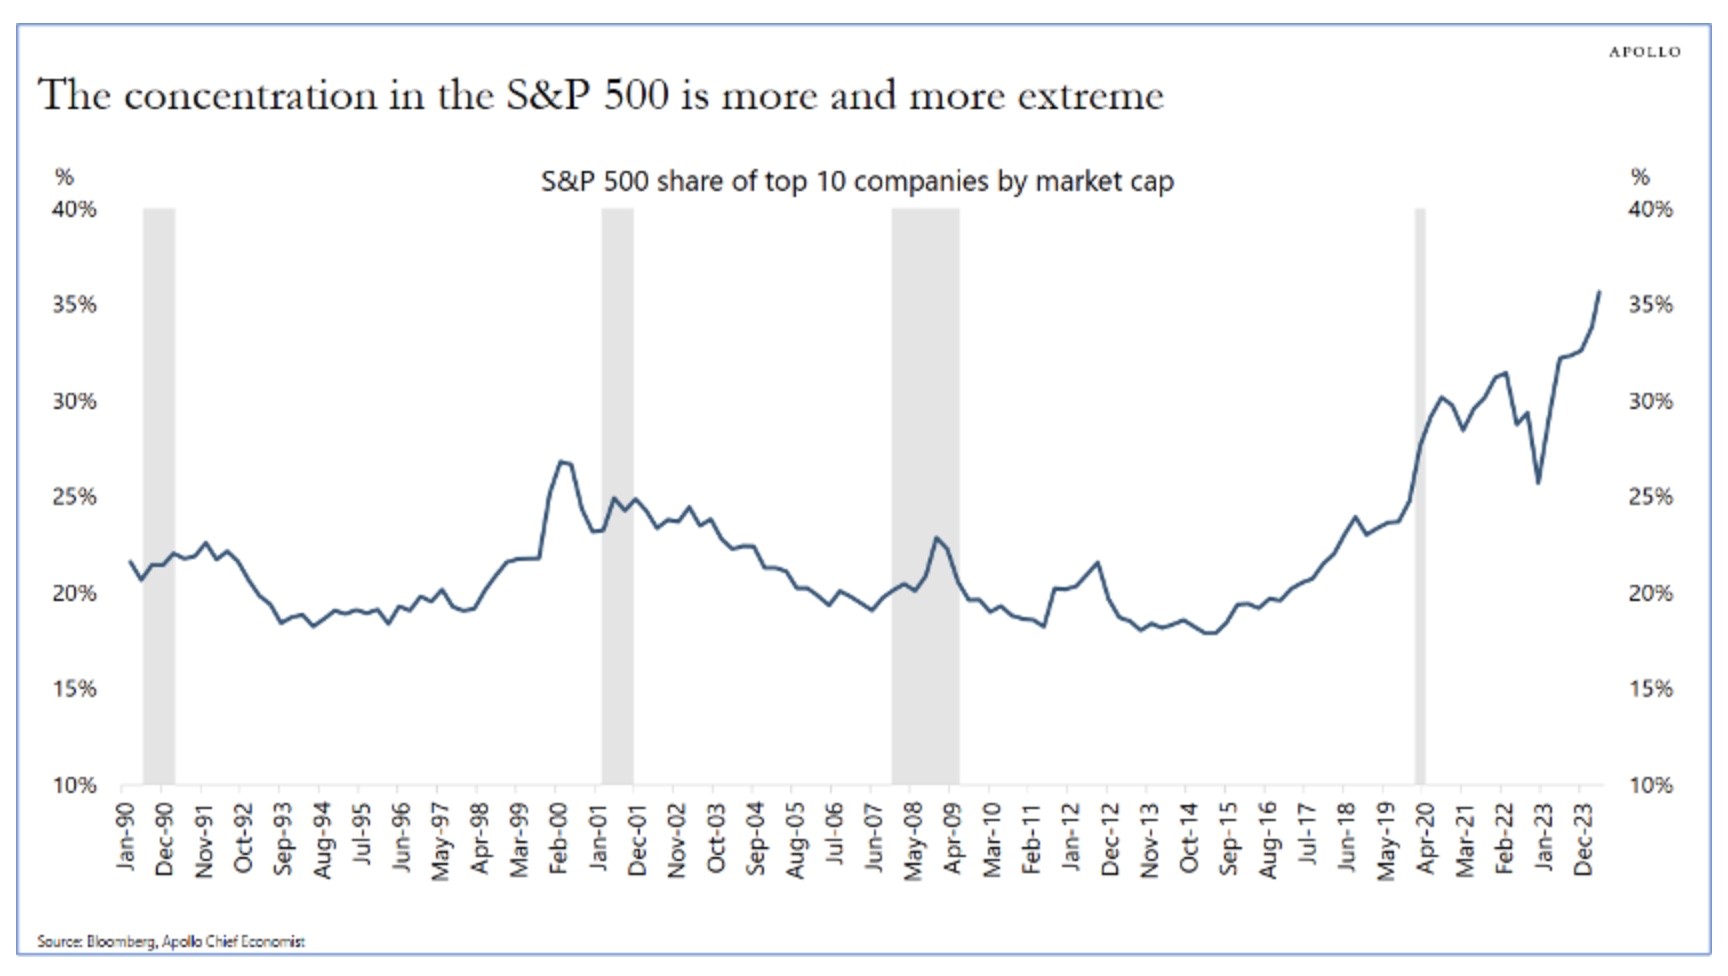
S&P 500 index concentration. On June 9, 2024, Apollo Chief Economist Torsten Slok posted the following chart in The Daily Spark.
 Source: Apollo The Daily Spark 06/09/2024
Currently, ten out of the 500 stocks in the S&P 500 account for over a third of its total value. These high-growth stocks have been major contributors to recent S&P 500 returns. Such extreme concentration is rare. Only three of those ten largest companies are outside of the Technology or Communications sectors: Berkshire Hathaway, Eli Lilly and JP Morgan. [iv] This is great when the top ten are moving higher and add excess returns to the market cap weighted S&P 500 index but can have the opposite effect if the hopes that AI will produce enormous profits for the companies involved does not prove to be true.
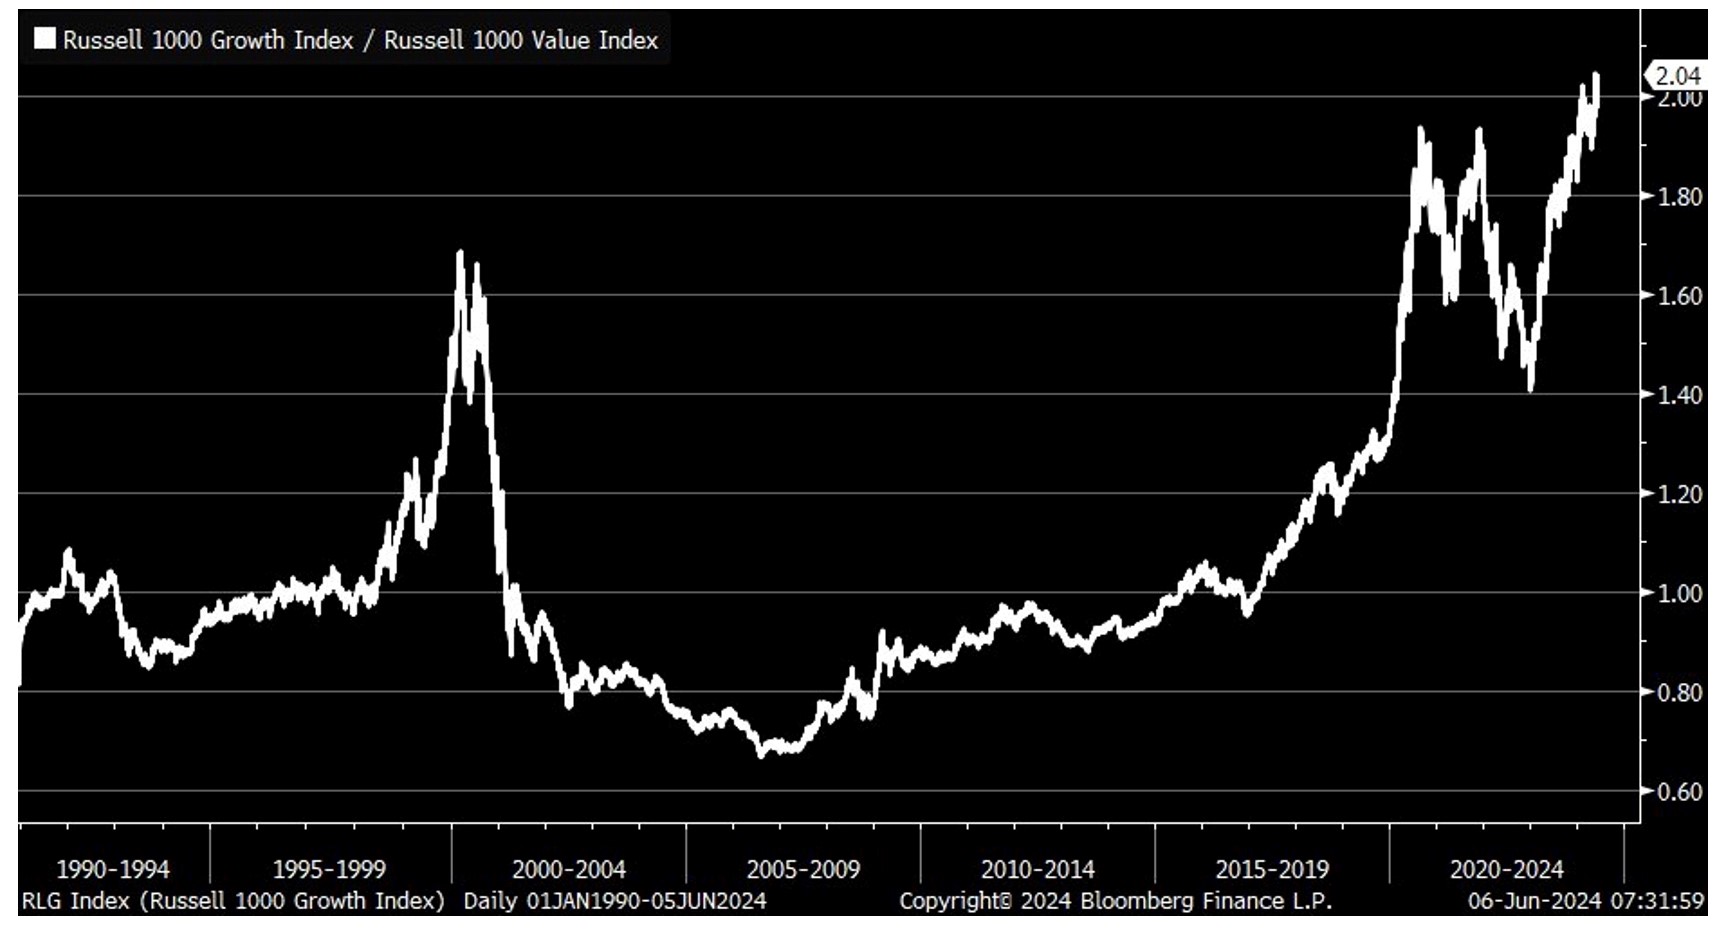
Growth versus Value. The following chart shows the ratio of the indexed returns of the Russell 1000 Growth Index and the Russell 1000 Value Index. The Russell 1000 Growth Index is currently outperforming the Russell 1000 Value Index by the biggest margin in decades! As of June 14, 2024, nine of the top ten stocks in the iShares Russell 1000 Growth ETF – which tracks the index – were technology related stocks and were a total of 53%, of the index. [v]
 Source: Bloomberg 06/06/2024
1. Value may once again outperform growth. The significant spike in the year 2000 during the dot-com bubble serves as a historical reference. Right now, we’re witnessing another surge in large-cap technology stocks, which we attribute to an AI bubble. In 2000, after the dot-com bubble burst, value stocks outperformed growth stocks. We’ve strategically positioned our clients’ portfolios to potentially benefit from this trend if the AI bubble deflates.
2 Profit-Taking and Rebalancing: When a sector or set of stocks significantly outperforms, we consider taking profits and rebalancing client portfolios. This can be an attractive exit point. We will look for tax harvesting opportunities as well as we rebalance.
3. Buying Opportunities: Conversely, when a sector or set of stocks underperforms, it may present an opportune entry point. To take advantage of this opportunity, we look to add positions before a sector recovers.
4. Contrarian Approach: Small-cap stocks and value stocks, often overlooked during market extremes, might be particularly appealing to contrarian investors right now. Year-to-date through [June 14, 2024], the Russell 2000 index of small-cap stocks is down -1.0%. [vi]
In navigating these market dynamics, we recognize that extremes can create opportunities. Whether it’s profit-taking, rebalancing, or adopting a contrarian approach, staying informed and maintaining an active management strategy will be crucial. In doing so, we continue to manage diversified strategies for the long run.
Please reach out to Brian Lasher (blasher@cigcapitaladvisors.com), Eric T. Pratt (epratt@cigcapitaladvisors.com) or the rest of the CIG team.
[i] Calculated by CIG Asset Management using data from finance.yahoo.com
[ii] Calculated by CIG Asset Management using data from finance.yahoo.com
[iii] Calculated by CIG Asset Management using data from finance.yahoo.com
[iv] Calculated by CIG Asset Management using data from finance.yahoo.com
[v] https://www.ishares.com/us/products/239706/ishares-russell-1000-growth-etf
[vi] Calculated by CIG Asset Management using data from finance.yahoo.com

CIG Asset Management Update: Where are we now?
The S&P 500 currently is experiencing its third longest period in the past 25 years without a single-day decline of over 2%. Yes, including last month. The graph below depicts the past 25 years, highlighting every day when the S&P 500 fell over 2% (indicated by black vertical lines). These occurrences aren’t rare.
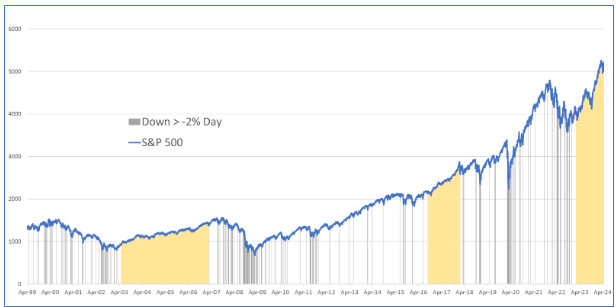
Chart by CIG Asset Management using data from barchart.com
The mustard-colored shaded areas represent extended periods without a 2% down day. The first yellow shaded area, 1,380 days, (from May 20, 2003, to February 27, 2007) coincided with Freddie Mac’s announcement that they would no longer buy sub-prime mortgages. [i] This marked the beginning of the great financial crisis, leading to a significant stock market drawdown over the next two years. The second longest period was 511 days, (September 12, 2016, to February 1, ) This calm period in the market ended with what became known as Volmaggedon – an event where many structured products that bet against stock market volatility lost over 90% of their value. [ii] The most recent shaded area began on February 21, 2023, and continues beyond May 9, . (443 days as of this writing) [iii] Notably, despite the S&P 500 falling -4.1% in April 2024, we still didn’t experience a single -2% down day.[iv] History teaches us that long quiet periods can often precede sudden volatility and drawdowns.
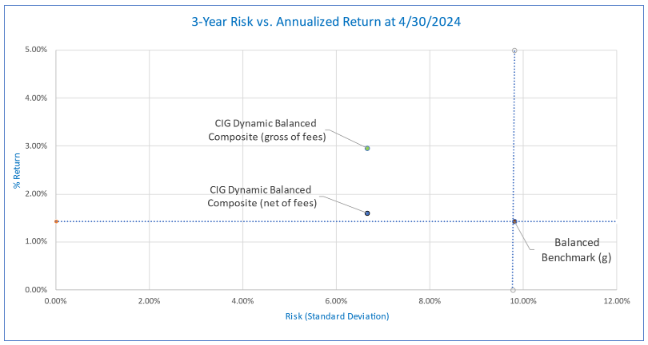
While no one can predict the future, we are currently taking less risk than the benchmarks in our managed strategies. The following chart shows the risk/return of the CIG Dynamic Balanced Composite versus the balanced benchmark for the three-year period ending April 30, 2024. Gross of fees, the balanced composite captured 207% of the benchmark’s return while only taking 68% of the Balanced Benchmark’s risk, as measured by standard deviation of returns over that 3-year period. Net of fees, the balanced composite captured 113% of the benchmark’s return. [v]
CIG Asset Management, Tamarac
The graph above illustrates the performance of the CIG Dynamic Balanced Composite over the past three years. Specifically, the annualized return of this strategy is above the horizontal dotted blue line which represents the annualized return of the balanced benchmark. Additionally, the strategy’s risk level is to the left of the vertical dotted blue line, which corresponds to the balanced benchmark’s risk. This positioning indicates good diversification: achieving higher returns than the benchmark while assuming less risk. However, achieving this balance isn’t easy, especially in a potentially euphoric market, and requires careful decision-making and strategic asset allocation.
Why are we focused on risk and what are we trying to avoid? Prolonged Downturns. Consider this graph, which first appeared in our update titled ‘What if the Bubble Bursts?’ on November 8, 2021.
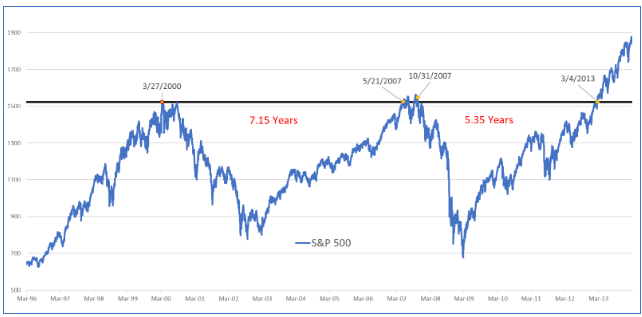
CIG Asset Management, barchart.com
Imagine an investor who put their money in the S&P 500 on March 27, 2000—the peak of the dot-com boom. They would have waited 7 years to break even by May 21, 2007. Briefly, there was a window to exit and remain whole until October 31, 2007. Then came the Great Financial Crisis, requiring another 5 plus years to recover by March 4, 2013. [vi]Our Question for Investors – Are you comfortable waiting 5, 7, or even close to 13 years to break even? For those nearing retirement or relying on investments for living expenses, the answer is likely no. While this period was extraordinary, it wasn’t that long ago. And now, the AI bubble appears to have striking similarities to the dot-com era. As of April 22,2024, the information technology sector was 30.3% of the S&P 500, nearing the dot-com record of 34.8% in March 2000. [vii]
At CIG, we take a thoughtful and balanced approach to investment management. As we navigate the ever-changing economic and geopolitical landscape, our outlook remains cautiously optimistic. In this phase of the market cycle, our primary goal is to achieve returns that align with our clients’ diverse financial plans while minimizing risk. We draw inspiration from Benjamin Graham’s wisdom in his book, The Intelligent Investor. “The best way to measure your investing success is not by whether you’re beating the market but by whether you’ve put in place a financial plan and a behavioral discipline that are likely to get you where you want to go. In the end, what matters isn’t crossing the finish line before anybody else but just making sure that you do cross.”
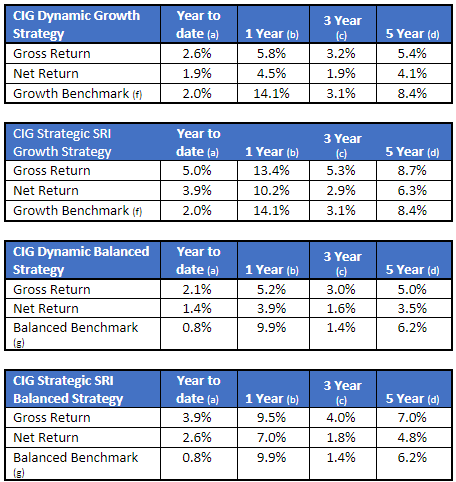
Strategy Returns as of 4/30/2024:
Performance has been attested to by ACA Group for the period August 1, 2018, through December 31, 2022.
Strategy returns are calculated independently on a daily basis and linked geometrically to produce a monthly return. Total investment performance includes realized and unrealized gains and losses, dividends, and interest. Accrual accounting is used to record interest income while dividends are recorded on a cash basis. Trade date accounting is used for calculation and valuation purposes.
Past performance is not indicative of future results.
(a) Represents performance from January 1, 2024, through April 30, 2024.
(b) Represents performance from May 1, 2023, through April 30, 2024.
(c) Represents annualized performance from May 1, 2021, through April 31, 2024.
(d) Represents annualized performance from May 1, 2019, through April 31, 2024.
(f) The Growth Benchmark is a blend of 60% Russell 3000, 25% MSCI All-Country World ex US and 15% Bloomberg US Aggregate Bond indices.
(g) The Balanced Benchmark is a blend of 45% Russell 3000, 10% MSCI All-Country World ex US and 45% Bloomberg US Aggregate Bond indices.
[i] https://fraser.stlouisfed.org/title/freddie-mac-5132/freddie-mac-announces-tougher-subprime-lending-standards-help-reduce-risk-future-borrower-default-518857
[ii] https://rpc.cfainstitute.org/en/research/financial-analysts-journal/2021/volmageddon-failure-short-volatility-products
[iii] Calculated by CIG Asset Management using data from barchart.com
[iv] Calculated by CIG Asset Management using data from finance.yahoo.com
[v] Calculated by CIG Asset Management using data from Tamarac
[vi] Calculated by CIG Asset Management using data from barchart.com
[vii] https://www.investopedia.com/best-25-sp500-stocks-8550793, https://www.bespokepremium.com/interactive/posts/think-big-blog/historical-sp-500-sector-weightings

CIG Asset Management Update: Infrastructure, Gold, and Strategic Positioning in a Changing Landscape
In our October 2023 CIG Asset Management Update: Year-to-Date U.S. Stock Performance in Pictures, we discussed our theme of Clean Transition Investing as a possible alternative way to participate in the stock market without chasing the Magnificent 7 stocks. [i] This theme focuses on the 2015 Paris Agreement, which outlined the long-term goal of reaching net zero emissions by the year 2050. However, global spending fell short in 2023, reaching an estimated $1.8 trillion out of the necessary $5 trillion annually. [ii]
We initially bought First Trust RBA American Industrial Renaissance ETF (AIRR) to participate in Clean Transition Investing for our CIG Dynamic Growth Strategy and CIG Dynamic Balanced Strategy in September 2023. We then added more AIRR in December 2023. Most recently, we added an additional investment in the Global X U.S. Infrastructure Development ETF (PAVE). How are these investments doing?
As seen in the chart below these infrastructure investments, (AIRR) and (PAVE) outperformed the Magnificent 7 stocks (MAGS) and the S&P 500 (SPX) for the period October 31, 2023, through March 31, 2024.[iii]
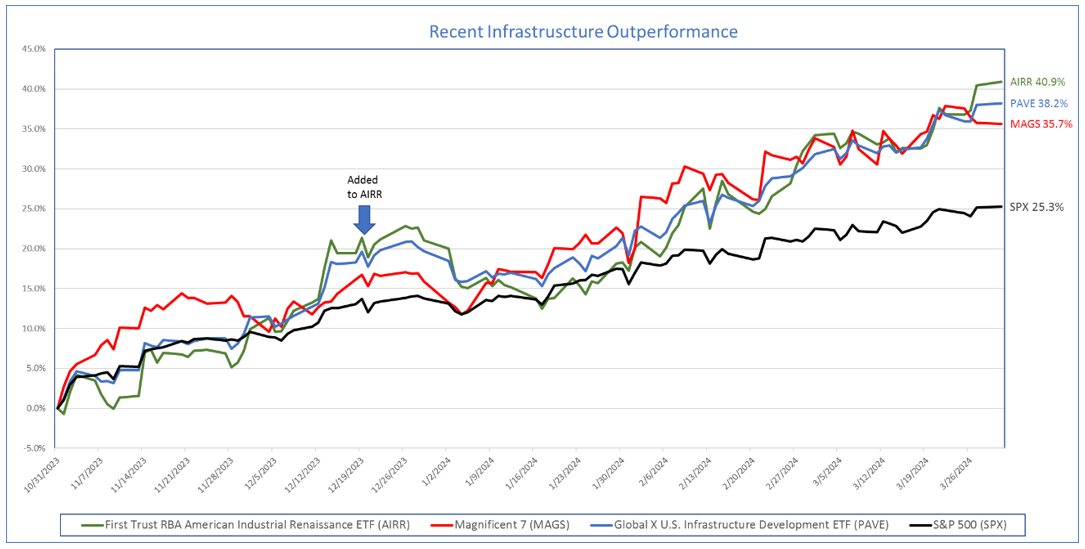
Data from Barchart.com for the period 10/31/2023 to 3/31/2024
Past performance is not indicative of and not a guarantee of future results, but we are encouraged that it it may be possible to enjoy positive market outperformance without chasing the Magnificent 7 stocks which, in our opinion, are in a bubble.
Moving on to another asset class, as of April 19, 2024, Gold futures closed at an all-time high of $2,398.40 / ounce on the COMEX exchange. [iv]As illustrated in the chart below, for the period March 31, 2019, to April 12, 2024 – just over five years – Gold, (symbol GCY00) has captured 100% of the S&P 500’s return! [v]
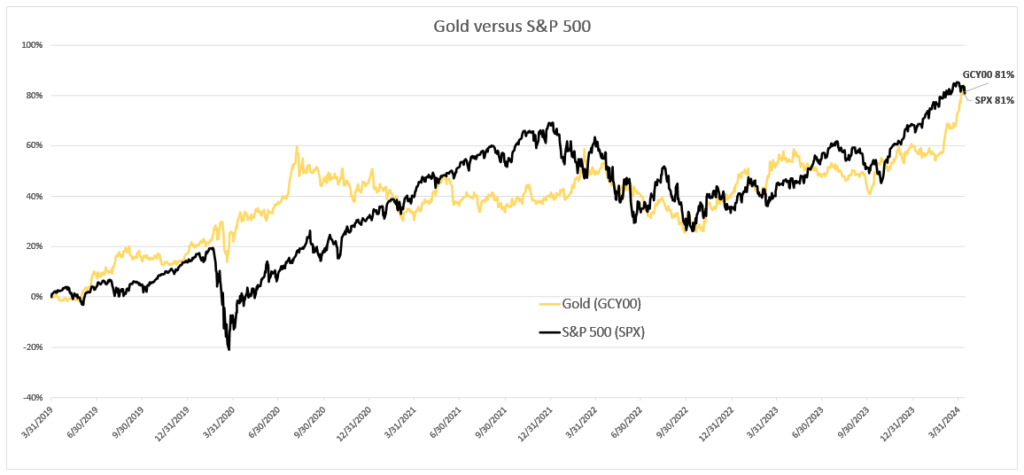
Data from Barchart.com for the period 3/31/2019 to 4/12/2024
Perhaps more impressively, from the peak of the dot-com boom in March 2000 through April 10, 2024, The S&P 500 has gained +244%, but Gold gained +738% – triple the return! [vi] Gold and miners continue to be a part of many of our client’s managed portfolios.
Why has Gold enjoyed such a stellar performance?
According to the latest budget update from the Congressional Budget Office (CBO), the U.S. government ran a staggering budget deficit of $1.7 trillion in fiscal year 2023. This deficit represents 6.3% of the country’s gross domestic product (GDP), significantly surpassing the 3.7% average observed over the past 50 years. Notably, excluding the Great Financial Crisis and the COVID-19 pandemic, this deficit-to-GDP ratio is the highest since World War II. [vii]
In 2023, the government’s net interest costs reached a staggering $659 billion, marking an 87% increase compared to the amount in 2021. [viii] The CBO’s latest projections also raise concerns: total U.S. federal government debt is projected to climb from 97% of GDP last year to 116% by 2034—surpassing the debt levels seen during World War II. Bloomberg Economics conducted extensive simulations to assess the fragility of the debt outlook. Alarmingly, in 88% of these simulations, the results indicate that the debt-to-GDP ratio is on an unsustainable trajectory, signifying an increase over the next decade.[ix] These unwieldly debt obligations and large budget deficits could potentially weaken the U.S. dollar relative to other currencies.
The weaponization of the U.S. dollar became evident following Russia’s invasion of Ukraine, leading to unprecedented financial repercussions for Putin’s regime. World leaders are now actively reducing their reliance on the U.S. dollar.[x]
On April 8, 2024, U.S. Treasury Secretary Janet Yellen issued a stern warning in Beijing: “Banks facilitating significant transactions related to Russia’s defense industry risk U.S. sanctions.”[xi] Russia’s Foreign Minister Sergey Lavrov met in Beijing to counter mounting pressure from the U.S. and its allies.[xii] Simultaneously, central banks worldwide are diversifying away from U.S. dollar reserves. They’ve been accumulating gold reserves at an astonishing pace—over a thousand tons in 2022 and 2023.[xiii] As other countries grow wary of holding U.S. assets due to potential reprisals, gold emerges as an increasingly attractive investment. The question remains: How will the United States manage its debt if global confidence in dollar-based assets wanes? Of note, as the dollar weakens, investments outside of the U.S. become more attractive to investors. At CIG, we are keenly focused on exploring international investment opportunities to capitalize on this trend.
America’s debt-to-GDP ratio is regaining the heights last seen post WWII. Past periods of sacrifice tended to be followed by burden-sharing and higher taxes. In 1932, as the Great Depression raged, America’s top marginal tax rate rose to 63% and continued higher through 1944 when it hit 94% on incomes over $200,000 (equivalent to $2.9mm in today’s dollars). The post-war economy boomed as America rebuilt the world. The top marginal rate remained above 90% until 1964 when we lowered it to 70%. [xiv] But today, we’re unsure whether we’ll make similar choices to raise taxes and share the burden. Nor do we know the societal consequences that come from refusing to equitably share our burdens.
In light of current conditions, our investment strategy remains nimble. We are encouraged by the recent performance of our new infrastructure investments. Equally noteworthy is our commitment to gold as a long-term asset, which has yielded productive results. The recent surge in gold prices, reaching an all-time high, underscores its resilience and attractiveness over the past five years-mirroring its performance since the Dot Com bust.
As we navigate the financial landscape, we maintain a cautious optimism, leveraging our insights and strategic positioning to potentially capitalize on opportunities while attempting to prudently manage risks. Our commitment to making prudent investment choices continues to drive results for out clients.
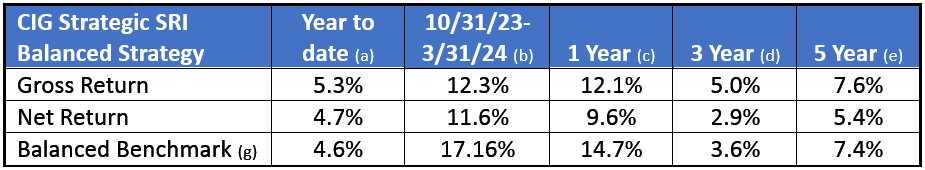
Strategy Returns as of 3/31/2024: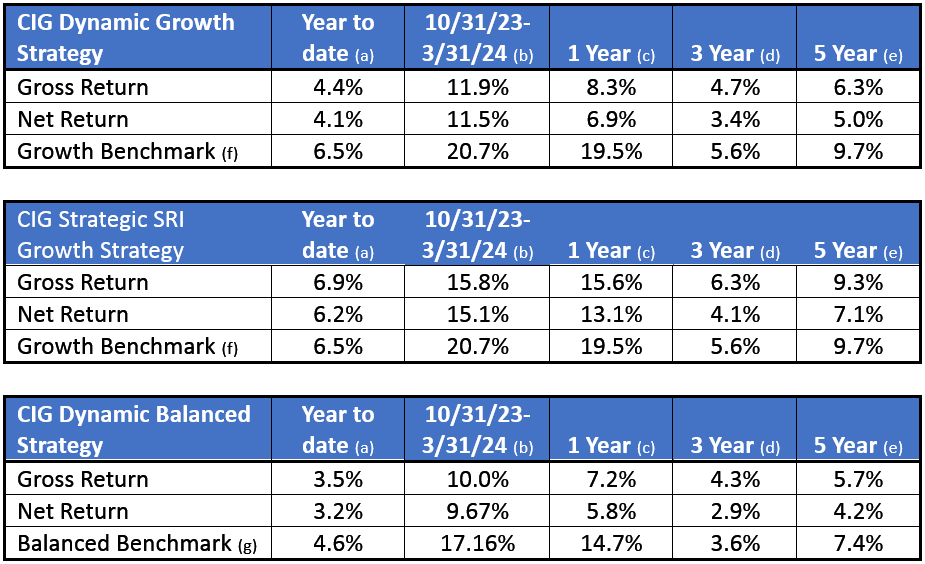
Performance has been attested to by ACA Group for the period August 1, 2018, through December 31, 2022.
Strategy returns are calculated independently on a daily basis and linked geometrically to produce a monthly return. Total investment performance includes realized and unrealized gains and losses, dividends, and interest. Accrual accounting is used to record interest income while dividends are recorded on a cash basis. Trade date accounting is used for calculation and valuation purposes.
Past performance is not indicative of future results.
(a) Represents performance from January 1, 2024, through March 31, 2024.
(b) Represents performance from October 31, 2023, through March 31, 2024.
(c) Represents performance from April 1, 2023, through March 31, 2024.
(d) Represents annualized performance from April 1, 2021, through March 31, 2024.
(e) Represents annualized performance from April 1, 2019, through March 31, 2024.
(f) The Growth Benchmark is a blend of 60% Russell 3000, 25% MSCI All-Country World ex US and 15% Bloomberg US Aggregate Bond indices.
(g) The Balanced Benchmark is a blend of 45% Russell 3000, 10% MSCI All-Country World ex US and 45% Bloomberg US Aggregate Bond indices.
[i] The ”Magnificent 7” stocks are Apple (AAPL), Microsoft (MSFT), Nvidia (NVDA), Alphabet (GOOG), Meta Platforms (META), Amazon (AMZN) and Tesla (TSLA). https://www.nasdaq.com/articles/the-easiest-way-to-remember-the-magnificent-7-stocks-and-why-you-should-care
[ii] GlobalX – Why Should You Consider Investing in U.S. Infrastructure Development?
[iii] Calculated by CIG Asset Management for using data from Barchart.com for the period 10/31/2023 to 3/31/2024
[iv] Data from finance.yahoo.com
[v] Calculated by CIG Asset Management for using data from Barchart.com for the period 3/31/2019 to 4/12/2024
[vi] Calculated by CIG Asset Management for using data from Barchart.com for the period 3/31/2000 to 4/12/2024
[vii] Data from https://www.cbo.gov/publication/60053 https://fred.stlouisfed.org/series/FYFSDFYGDP
[viii] Data from https://www.cbo.gov/publication/60053 https://fred.stlouisfed.org/series/FYFSDFYGDP
[ix] https://www.fastbull.com/news-detail/a-million-simulations-one-verdict-for-us-economy-3825714_0
[x] https://www.bloomberg.com/news/articles/2023-06-02/putin-s-war-ignites-backlash-against-dollar-across-the-world
[xi] https://www.bloomberg.com/news/articles/2024-04-08/yellen-threatens-sanctions-for-china-banks-that-aid-russia-s-war
[xii] https://www.nytimes.com/2024/04/09/world/asia/xi-lavrov-russia-china.html
[xiii] The High-Tech Strategist April 2, 2024
[xiv] Data from https://taxfoundation.org/data/all/federal/historical-income-tax-rates-brackets/

CIG Asset Management Update: The Stock Market Rally May Be Broadening
In October 2023, we shared the CIG Asset Management Update: Year-to-Date U.S. Stock Performance in Pictures and we discussed how the Magnificent 7[i], seven mega-cap growth stocks, were driving the returns of the S&P 500.
This outperformance continued through year end as you can see in the December 31, 2023 FinViz heat map below.
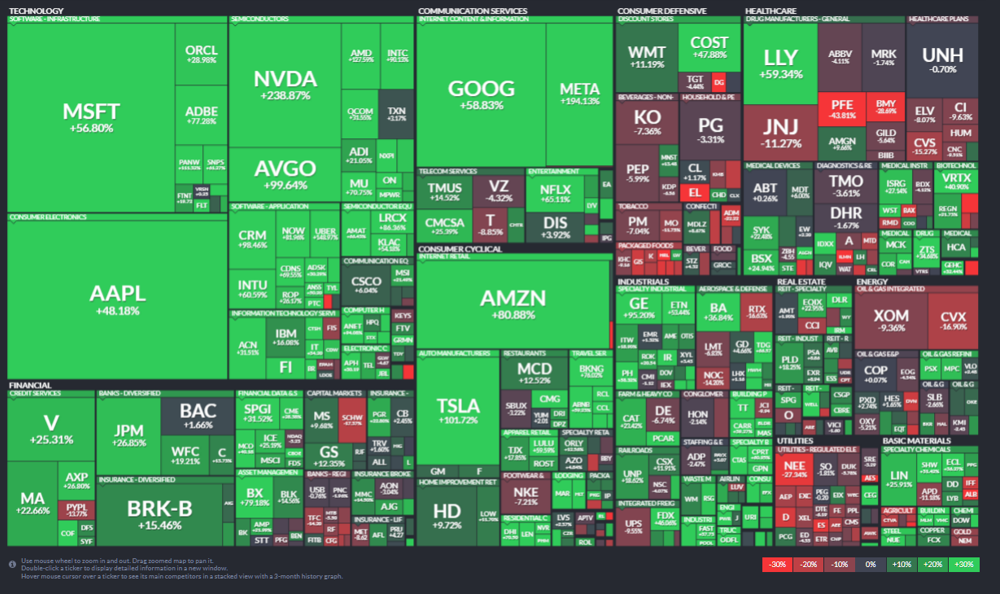
Source: FinViz as of 12/31/2023
In the year, 2023, the Magnificent 7 stocks experienced an average return of +111% while the S&P 500 Index only gained +26%. The Equal-Weighted S&P 500 Index only gained +12%. If you removed the Magnificent 7 stocks from the Equal-Weighted S&P 500 Index, you would have only gained +8%. [ii]
The strong performance of the Magnificent 7 stocks has extended into 2024. As of February 29, 2024, these seven stocks have gained +12.7%, outpacing the S&P 500’s increase of +7.1% and the Equal-Weighted S&P 500 Index’s gain of +3.2%.[iii]
We believe the Magnificent 7 stocks are currently trading at levels considered expensive compared to historical standards. Torsten Slok, Apollo’s Chief Economist, has recently showed that when you compare the median 12-month forward price-to-earnings (PE) ratio of the top ten companies in the S&P 500, which include all of the Magnificent 7 stocks, they are much more expensive now than they were during the tech bubble of the 1990s. [iv]
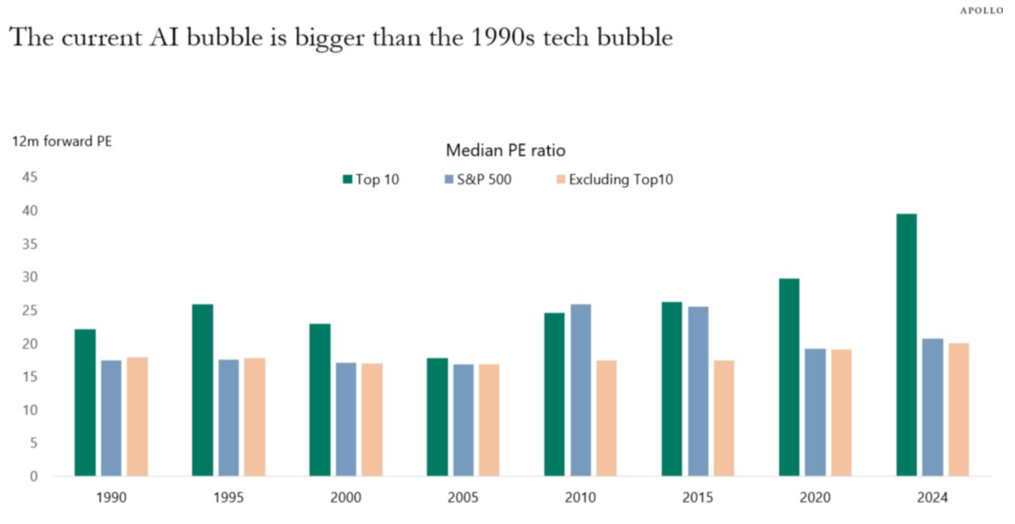
Source:Bloomberg, Apollo Chief Economist. Note: Data as of January 31, 2024.
With that being said, we are seeing some encouraging signs that the stock market rally may finally be starting to broaden out. For the week ended 3/6/2024, we saw four of the Magnificent 7 stocks; Microsoft (MSFT), Apple (AAPL), Alphabet (GOOG), and Tesla (TSLA) move lower as many other stocks outside of the technology sector rose. You can see this in the March 6, 2024 FinViz heat-map below.
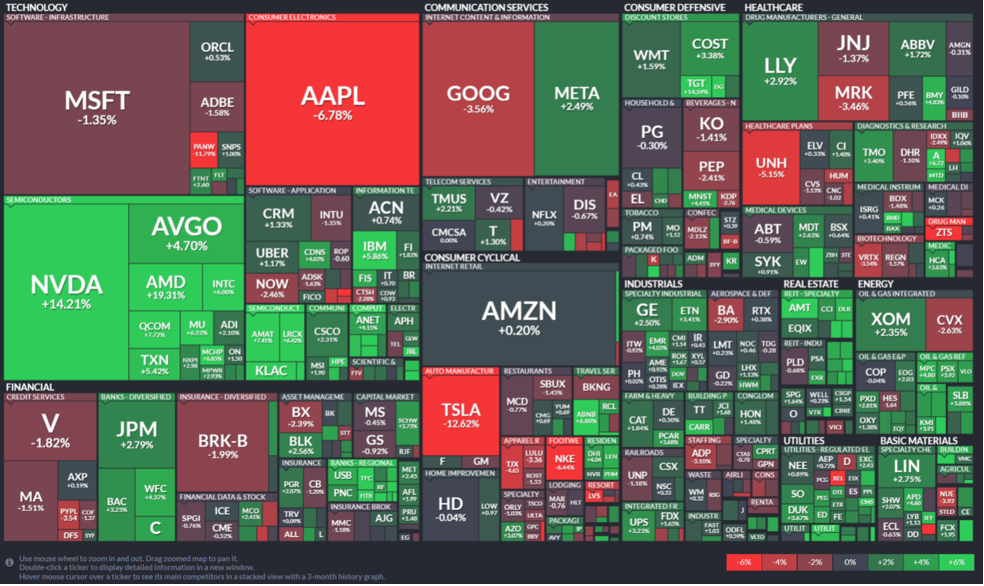
Source: FinViz as of 3/6/2024
While we find it encouraging to see a wider equity market participation, we still believe strongly in the value of diversification. Diversification is not supposed to maximize returns, it is designed to reduce investment risk. A diversified portfolio at times won’t keep up with the market when the bulk of returns are concentrated in a small group of stocks like the Magnificent 7. We strive to diversify our investments amongst industries and sectors, size (large-cap and small-cap), geography, growth versus value and alternative asset classes. Some of these investments are negatively correlated to the stock market – what that means is historically when the stock market traded lower – these investments gained in value. Past performance is not a guarantee of future results, but history helps guide us.
At CIG, we believe in risk-balanced investing. We believe investors should consider how much risk they are taking to achieve returns. We think that we should be striving to reach the return necessary to meet the various needs of our client’s financial plans while, at this point in the market cycle, taking as little risk as possible to meet that goal. We want you to sleep at night.
Please reach out to Brian Lasher (blasher@cigcapitaladvisors.com), Eric T. Pratt (epratt@cigcapitaladvisors.com) or the rest of the CIG team.
This report was prepared by CIG Asset Management and reflects the current opinion of the authors. It is based upon sources and data believed to be accurate and reliable. Opinions and forward-looking statements expressed are subject to change without notice. This information does not constitute a solicitation or an offer to buy or sell any security.
[i] The Magnificent 7 stocks are: Apple (AAPL), Microsoft (MSFT), Alphabet (GOOGL), Amazon.com (AMZN), Nvidia (NVDA), Tesla (TSLA), and Meta Platforms (META)
[ii] https://www.forbes.com/sites/greatspeculations/2024/01/22/2023-in-review/?sh=78aab8bd690b
[iii] Calculated by CIG Asset Management for the Roundhill Magnificent Seven ETF (MAGS) using data from finance.yahoo.com
[iv] The Daily Spark, February 25, 2024 – Apollo Academy

Update from CIG Asset Management – Wealth Destroyer – As Seen On TV
CNBC television frequently has a guest, Cathie Wood, Founder & CEO of ARK Invest. Oftentimes Cathie will tout the funds and stocks that are held in the funds she manages. On April 12, 2022, Cathie Wood said the following live on CNBC, “Over the next five years we’re expecting a 50% compound annual rate of return for the next five years.” [i]
How has the performance of ARK Invest’s Flagship Fund, the ARK Innovation ETF (ARKK), been since her bold statement in April 2022? As seen in the chart below, the shaded area representing ARKK shows a decline of -21.2% from April 12, 2022, to February 7, 2024! In contrast, the S&P 500 has gained+13.6% over this same period! [ii]
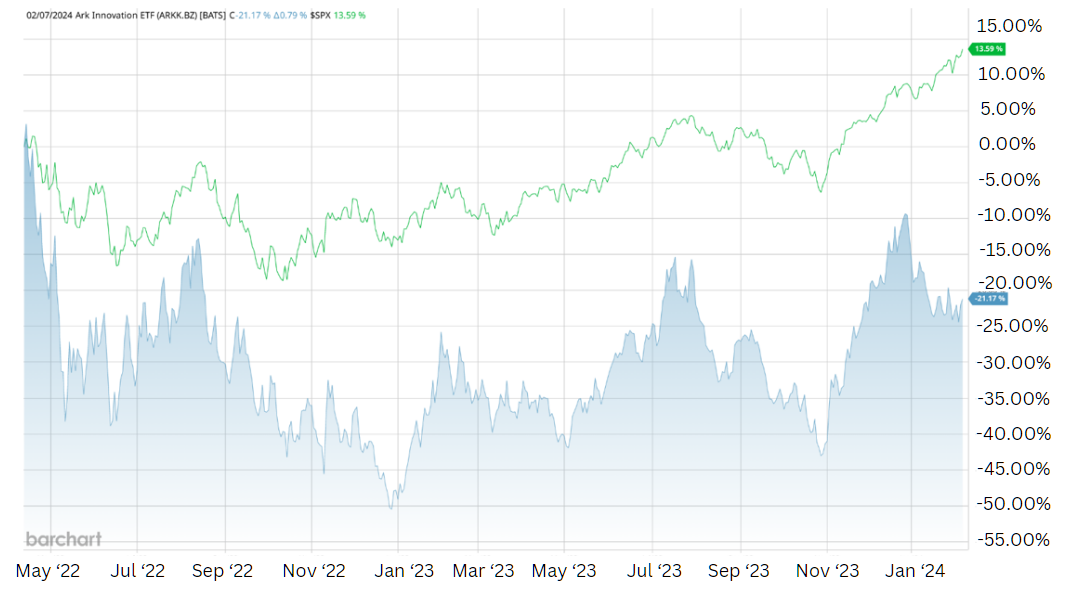
The current performance of ARRK, as indicated in the chart above, doesn’t appear to align with the 50% rate of return forecasted in her April 2022 statement. Cathie has made multiple appearances on CNBC since April 2022, and two of her latest appearances have caught our attention.
On January 23 ,2024, Cathie discussed Bitcoin ETFs and said, “This is one of the most important investments of our lifetime.” [iii] This was only 12 days after ARK Invest launched the ARK 21shares Bitcoin ETF (ARKB). [iv] ARKB has fallen -11.7% since its launch on January 11, 2024, to February 7, 2024. Bitcoin itself only fell -5.0% during that same period. A cryptocurrency investor lost over twice as much owning ARKB versus Bitcoin itself during this period of time! [v]
On February 7, 2024, Cathie appeared on CNBC’s program “Last Call”. Cathie spoke about Tesla and said, “Robo-taxis are a software as a service model” and that “EVs will be the bulk of the auto market in the next 5 years.” [vi] As of February 8, 2024, Tesla is ARKK’s second largest holding. [vii] Tesla is down -25% year-to-date as of February 7, 2024. [viii]
As you read this you may be thinking, “CIG is being very critical of Cathie Wood and her ARK Funds.” We at CIG are not alone in our criticism. Morningstar recently published a report- “15 Funds That Have Destroyed the Most Wealth Over the Past Decade”. According to Amy C. Arnott, CFA and author of the report, “The ARK family wiped out an estimated $14.3 billion in shareholder value over the 10-year period—more than twice as much as the second-worst fund family on the list. ARK Innovation alone accounts for about $7.1 billion of value destruction over the trailing 10-year period.”[ix] More importantly, this is not about Cathie Wood or ARK rather about objective data analysis versus media coverage.
We urge our clients and all investors to refrain from being swayed by the hype seen on CNBC or encountered while browsing the internet. Some guests on these platforms are “talking their book”, meaning they are trying to drum up interest in the investment that they already own, such as Tesla, as highlighted earlier. They also may offer the hope of beating the market or make grand predictions about their future performance similar to Cathy’s 50% comment. Instead, we ask investors to listen to the sage advice of Benjamin Graham, as the “father of value investing” and mentor to Warren Buffett. [x] In his book, “The Intelligent Investor” Graham wrote the following:
“The best way to measure your investing success is not by whether you’re beating the market but by whether you’ve put in place a financial plan and a behavioral discipline that are likely to get you where you want to go.”[xi]
The guests on financial channel talk shows tend to highlight their successes from the previous year and the promising opportunities they foresee for the current year, yet they often overlook discussing their less-than-successful experiences in 2022. Retail investors also occasionally exhibit this behavior. We counsel investors to understand what they are invested in – usually a diversified portfolio – and measure their results with the appropriate diversified, blended benchmark and how they are doing versus their financial plan. The rest is just noise.
Please reach out to Brian Lasher (blasher@cigcapitaladvisors.com), Eric T. Pratt (epratt@cigcapitaladvisors.com) or the rest of the CIG team.
This report was prepared by CIG Asset Management and reflects the current opinion of the authors. It is based upon sources and data believed to be accurate and reliable. Opinions and forward-looking statements expressed are subject to change without notice. This information does not constitute a solicitation or an offer to buy or sell any security.
[i] https://www.cnbc.com/video/2022/04/12/ark-invest-ceo-cathie-wood-says-she-expects-50-percent-compound-annual-rate-of-return-for-the-next-five-years.html
[ii] Data and chart from barchart.com
[iii] https://www.cnbc.com/video/2024/01/23/cathie-wood-on-bitcoin-etf-this-is-one-of-the-most-important-investments-of-our-lifetime.html
[iv] https://www.prnewswire.com/news-releases/the-ark-21shares-bitcoin-etf-arkb-is-available-now-302031988.html
[v] Calculated by CIG Asset Management using data from finance.yahoo.com.
[vi] https://www.cnbc.com/video/2024/02/07/ark-invest-ceo-cathie-wood-evs-will-be-the-bulk-of-the-auto-market-in-the-next-5-years.html
[vii] ARK Invest holdings data as of February 8, 2024
[viii] Calculated by CIG Asset Management using data from finance.yahoo.com.
[ix] “15 Funds That Have Destroyed the Most Wealth Over the Past Decade” – published by Morningstar 2/2/2024
[x] https://www.investopedia.com/terms/b/bengraham.asp#toc-notable-accomplishments
The Intelligent Investor, Benjamin Graham
[xi] The Intelligent Investor, Benjamin Graham, https://www.arborinvestmentplanner.com/quotes-from-the-intelligent-investor-revised-edition/ p.220

Update from CIG Asset Management Team – Asset Manager Annual Checkup
In an era of consolidation in the wealth management industry, an annual check-up of who is managing your assets is important. With firms like LPL, Wealth Enhancement Group, Stratos Wealth Partners, it raises the question: Who is actually managing your money? Do you know the individuals on the company’s website?
We suggest that you conduct an Asset Manager checkup.
Annual Asset Manager Check Up List
Basics
ü Have you ever talked to the people who directly manage your hard-earned life savings?
ü If so, how often could/do you meet with them?
ü If not, how do they determine my risk tolerance and investment objectives and get to know you?
ü Is your advisor really doing the trades and asset allocation for your portfolio?
Advanced – Is the asset management offering compelling in regard to the following?
ü Performance- How does the strategy perform during up and down periods?
ü Selection- Do they actively manage the portfolio or is it invested in big technology companies all the time?
ü Insight- Is there common sense anchored in factual data, without rosy forecasts like we may often hear on TV?
ü New Ideas- Is there delivery of unique value through compelling theses? For example, Gold or Energy Sector investments at the right time.
ü Diversification- Do they utilize a variety of investments which complement existing illiquid holdings?
ü Trust- Are you going to trust this group to help you through the inevitable difficulties in the market? When risk appetites are high, are they good at restraining your exuberant actions? When risk appetites are low, will you feel comfortable restraining fearful activities and buying low?
At the end of the day, what kind of “ride” or investment experience are they offering you? People don’t retire on %’s but on actual dollars. How did you do in 2022? If you were down, are you back to even with stocks soaring this year?
In our last letter, What’s Your Benchmark, we talked about comparing your investment portfolio to an appropriate benchmark and comparing your investment portfolio’s 3-year risk and return. As of November 30, 2023, our analysis revealed that the CIG Dynamic Balanced Composite achieved a trailing 3-Year annualized return of +2.30%, net of fees. This performance surpassed the Balanced Benchmark’s +1.95% return, all while assuming only half the risk of the benchmark, as indicated by the standard deviation of returns that 3-year timeframe. [i]
In 2023, U.S. stock performance has been largely dominated by the Technology sector and Communication Services sector. [ii]
We believe that many investors are currently experiencing recency bias – the tendency to place too much emphasis on experiences that are freshest in their memory – even if they are not the most relevant or reliable. How quickly investors have forgotten about the very negative returns in 2022!
As seen in the two following bar charts, in 2022 at CIG, the CIG Dynamic Growth Composite avoided 60% and the CIG Strategic: SRI Growth Composite avoided 40% of the growth benchmark’s -17.27% loss. Net of fees.[iii] The CIG Dynamic Balanced Composite avoided 65% and the CIG Strategic: SRI Balanced Composite avoided 48% of the balanced benchmark’s -15.81% loss. Net of fees. [iv]
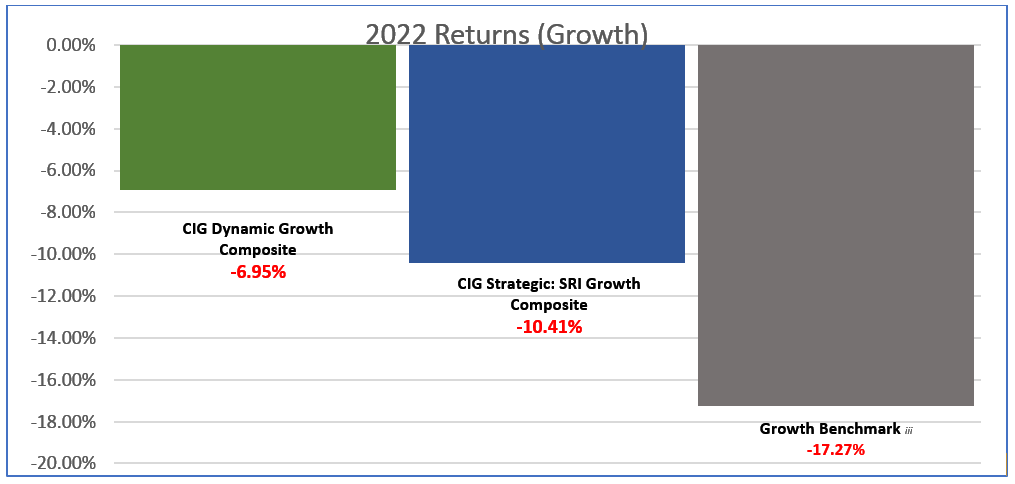
Calculated by CIG Asset Management using data from Tamarac. Represents performance from January 1, 2022, through December 31, 2022. Past performance is not indicative of future results. [v]
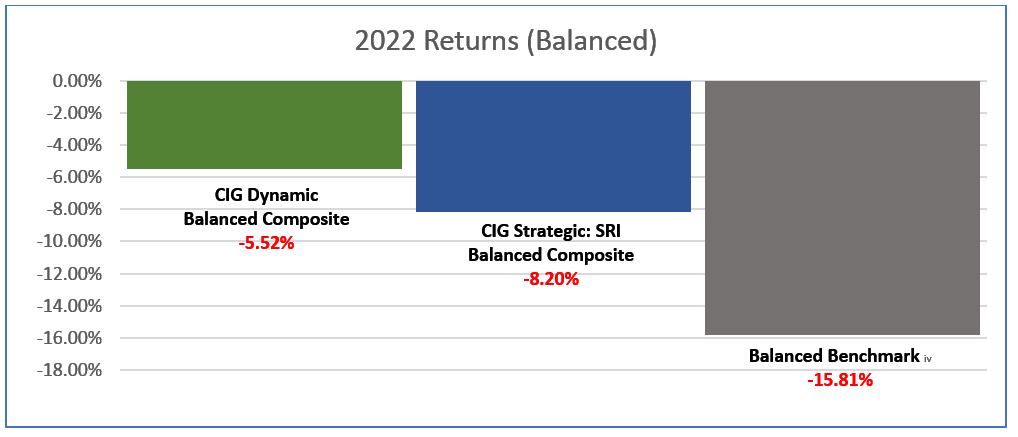
Calculated by CIG Asset Management using data from Tamarac. Represents performance from January 1, 2022, through December 31, 2022. Past performance is not indicative of future results.[vi]
Year-to-date through November 30th, 2023, domestic and international equities along with fixed income have rallied with some significant returns in equities.[vii] As seen in the following two bar charts our CIG growth and balanced composites continue to outperform their respective benchmarks on a 2-year cumulative basis through November 30th, 2023. Net of fees. [viii]
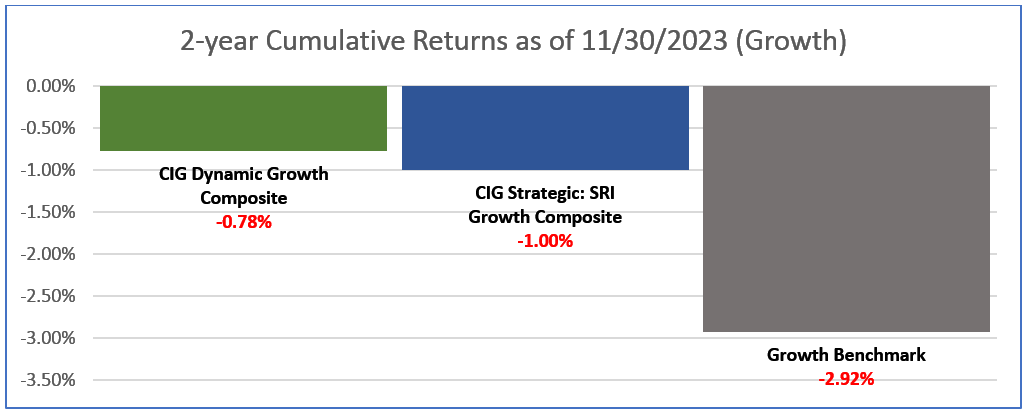
Calculated by CIG Asset Management using data from Tamarac. Represents performance from January 1, 2022, through December 31, 2022. Past performance is not indicative of future results. [ix]
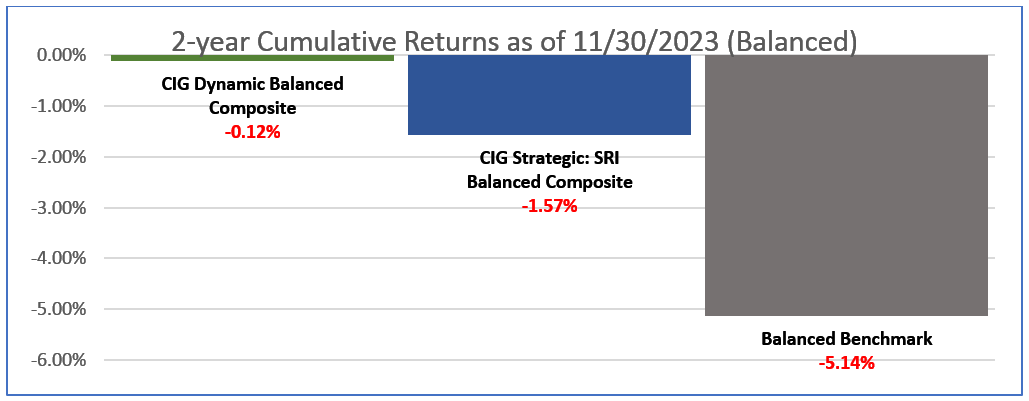
Calculated by CIG Asset Management using data from Tamarac. Represents performance from January 1, 2022, through December 31, 2022. Past performance is not indicative of future results. [x]
As illustrated above, the ride with the CIG composites is smoothed out during volatile conditions and over the two-year period, the CIG composites are much closer to break-even than the benchmarks. For example, the difference as shown above between the Balanced Benchmark and the CIG Dynamic Balanced Composite is +5.02%.
Of course, in addition to portfolio construction, risk and returns, you need to ask if the overall organization that includes asset management is helping you achieve your goals. Your success is about looking at the whole picture:
ü Have they created a plan to help you drive meaningful levels of savings toward your goals?
ü Together, are you executing effective estate, tax, and philanthropy management programs?
ü Do they provide business consulting if you are an entrepreneur and business owner?
You hopefully get a medical check-up each year. What about holistic check of your wealth manager?
At CIG, we believe in risk-balanced investing. We believe investors should consider how much risk they are taking to achieve returns. We think that we should be striving to reach the return necessary to meet the various needs of our client’s financial plans while, at this point in time as described in our two most recent letters, taking as little risk as possible to meet that goal. We want you to sleep at night.
We counsel investors to understand what they are invested in – usually a diversified portfolio – and measure their results with the appropriate diversified, blended benchmark. Life is too short to be frustrated.
If you would like to discuss the results of your annual check or review how much risk that you are taking to achieve your returns, please contact Eric Pratt or Brian Lasher who would be happy to speak with you.

Update from CIG Asset Management – What’s Your Benchmark?
Do you compare your investment portfolio’s performance to a popular stock that you hear about on CNBC?
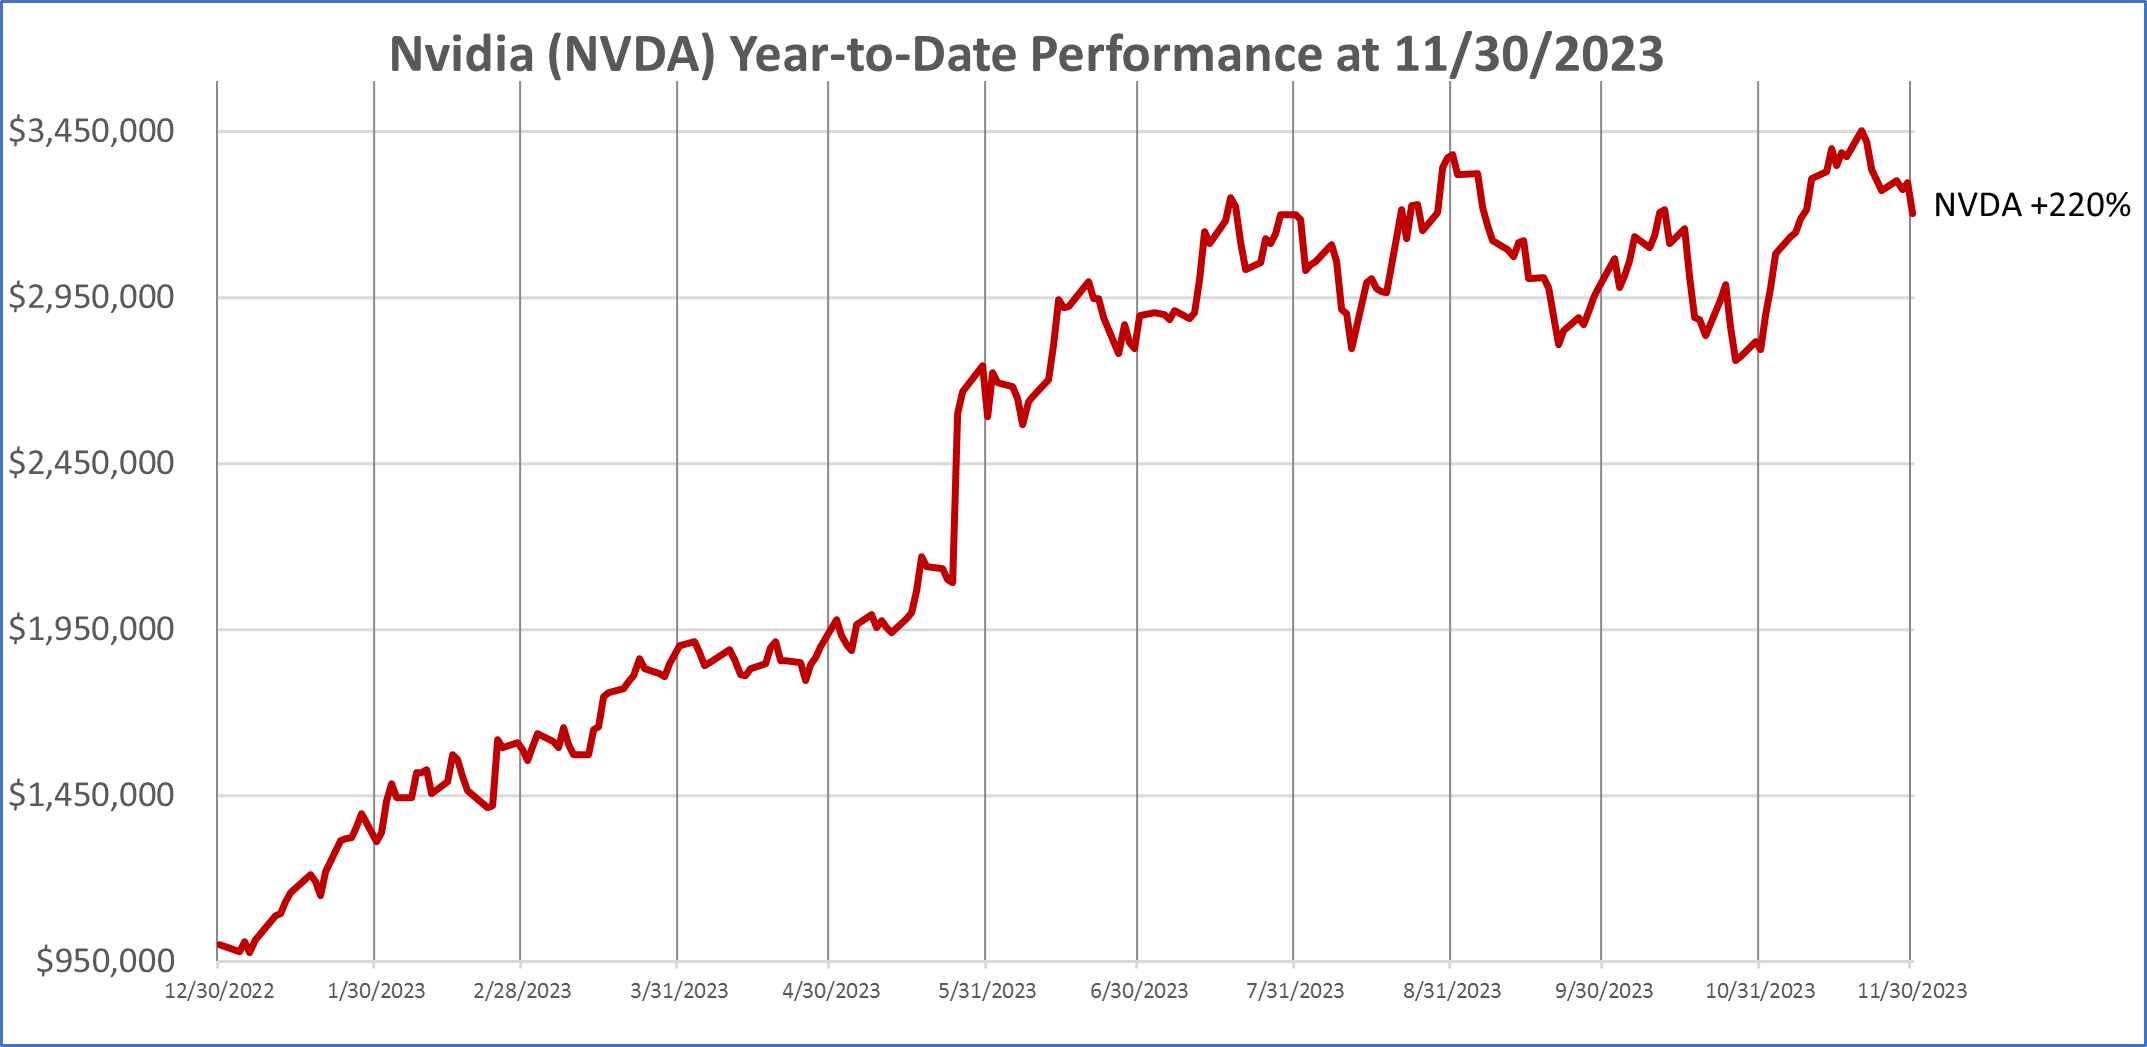
This is the daily chart for Nvidia, a single stock that soared +220% year-to-date through November 30, 2023. [i]
Maybe you compare your portfolio to the S&P 500.
Year-to-date through November 30, 2023, the S&P 500, represented by the SPDR S&P 500 ETF (SPY), is up +20.7%. [ii] It might be appropriate to use the S&P 500 as your benchmark if you invest all your money in large and mid-sized companies that are domiciled in the United States. However, if you are using an important tool like many investors in managing investment risk – diversification – that is, spreading your investments among and within different asset classes, then comparing your performance to the S&P 500 is likely to leave you disappointed.
This year, that disappointment is likely to be WORSE because as we discussed last month in Year-to-Date U.S. Stock Performance in Pictures, the S&P 500 performance thus far this year had been dominated by just 7 stocks – the Magnificent 7 – which Torsten Slok, Chief Economist at Apollo Asset Management said were becoming more and more overvalued and, in our view, more dangerous to invest in. [iii] Are we headed toward a big loss like post the year 2000, when the dot com stocks fell and the S&P 500 had fallen -49% from its peak on March 27, 2000, to its low On October 9, 2022? [iv]
At CIG, we believe in the adage, “Don’t put all your eggs in one basket”. We employ active asset allocation to employ varying levels of exposure to various sectors of domestic and international stocks, fixed income, and alternatives, such as gold and commodities, in an attempt to manage risk throughout market cycles.
How do we compare our strategies’ performance?
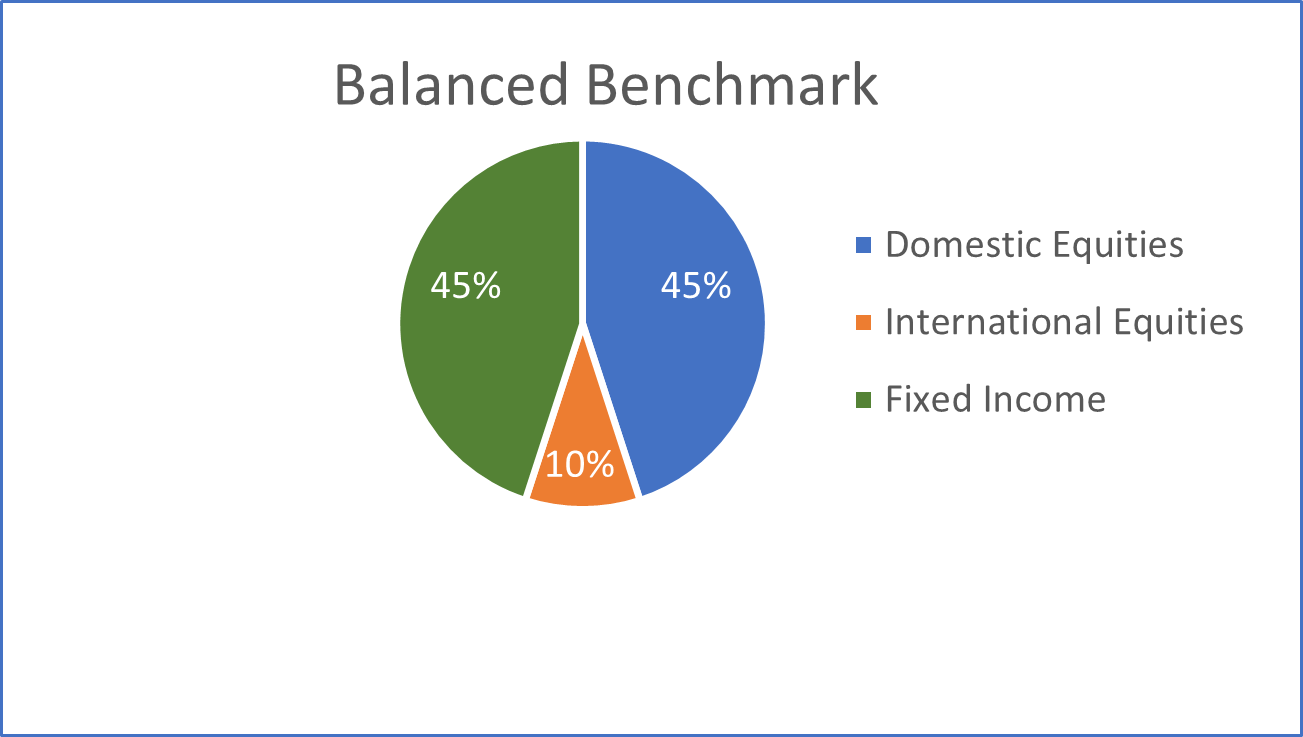
At CIG, we utilize benchmarks that are invested in a blend of three major asset classes- domestic equities, international equities, and fixed income.
- Domestic equities are represented by the Russell 3000 Index, a market capitalization-weighted index which measures the performance of the 3,000 largest U.S. companies and representing approximately 96% of the investible U.S. equity market. [v]
- International equities are represented by the MSCI ACWI ex USA Index, an index covering approximately 85% of the global equity opportunity set outside of the United States. [vi]
- Fixed income is represented by the Bloomberg U.S. Aggregate Index, an index composed of investment-grade government and corporate bonds. [vii]
The pie chart below illustrates the weightings of the three major asset classes in our balanced benchmark. We compare the performance of our clients whom we generally describe as balanced investors to the performance of this balanced benchmark.
In the following bar chart, we compare year-to-date performance of the components of our balanced benchmark to the S&P 500 and Equal-Weighted S&P 500 as of November 30, 2023.
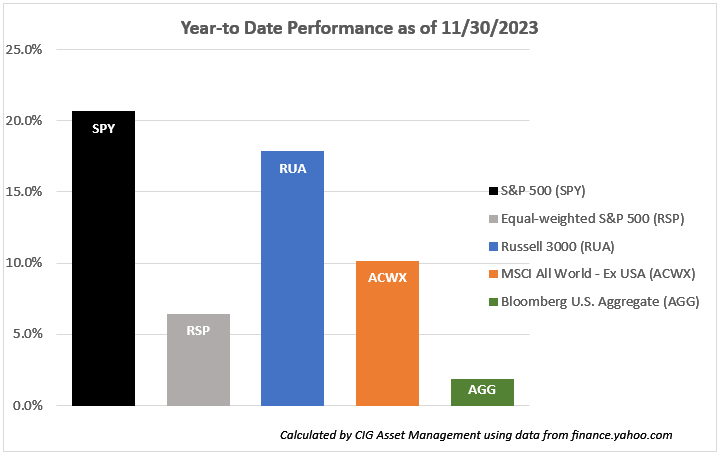
Year-to-date, the Russell 3000 – the domestic equity index we use in our benchmarks – gained +17.8%. The Russell 3000 has a similar issue to Magnificent 7 stock dominance, with 24% of the index invested in these seven stocks but not to the same extent as the S&P 500, with 28%. [viii] Over the same period, the MSCI ACWI ex USA index (ACWX) gained +10.1%, less than half of the S&P 500, and the Bloomberg U.S. Aggregate Index (AGG) was only up +1.9%. [ix] This year, if you employed diversification – spreading your investments among and within different asset classes in the chart above instead of only investing in the S&P 500, you clearly experienced lower returns than the S&P 500.
Now that we have told you about our balanced benchmark, what is the appropriate period to assess how one has done versus the benchmarks? Should you look at it every day? How should we be looking at returns and the amount of risk you are taking?
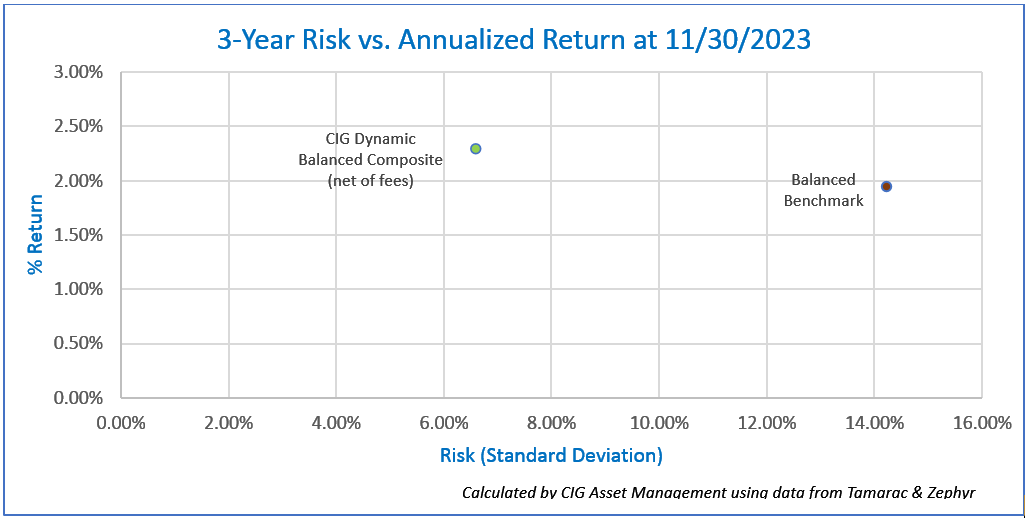
We prefer to look at returns and risk over a trailing 3-year period. We measure risk using the standard deviation of returns. The CIG Dynamic Balanced Composite trailing 3-Year annualized return as of November 30, 2023, is +2.30%, net of fees, and the 3-year standard deviation is 6.6%. [x] The Balanced Benchmark’s trailing 3-year annualized return as of November 30, 2023, is +1.95% and the 3-year standard deviation is 14.2%. [xi]
You can see in the chart below that the CIG Dynamic Balanced Composite is taking less than half (46%) of the risk, as measured by the standard deviation of annualized three year returns, of the balanced benchmark [xii] and is returning 118% of the balanced benchmark’s return on a trailing 3-year annualized basis. [xiii]
At CIG, we believe in risk-balanced investing. We believe investors should consider how much risk they are taking to achieve returns. We think that we should be striving to reach the return necessary to meet the various needs of our client’s financial plans while, at this point in the market cycle, taking as little risk as possible to meet that goal. We want you to sleep at night.
Speaking of risk, let’s go back to the first chart on page one, Nvidia (NVDA). Nvidia has experienced many booms and busts over the years. The stock is currently booming, up +220% year-to-date through November 30, 2023, due to surging sales of its artificial intelligence chip. [xiv] As of December 31st, 2023, we own a small amount of Nvidia in our dynamic and strategic balanced and growth models [xv] via our iShares Semiconductor ETF SOXX holding.
We are very cautious regarding NVDA, the company has experienced two large losses in the past five years. In the fourth quarter of 2018, NVDA stock suffered a -56% drawdown in 82 days [xvi] due to the company warning about excess inventory of graphic chips for gaming. [xvii] In 2022, NVDA stock suffered a -66% drawdown in 329 days [xviii] as cancelled orders from personal computer makers and weakness in crypto mining orders negatively impacted sales and earnings. [xix]
So, what is your benchmark, an individual stock like Nvidia that fell -66% in 329 days in 2022, or an index like the S&P 500 that fell -49% from its peak on March 27, 2000, to its low On October 9, 2022?
We counsel investors to understand what they are invested in – typically a diversified portfolio – and measure their results with the appropriate diversified, blended benchmark. Life is too short to be frustrated.
If you are not a client, we are happy to review how much risk that you are taking to achieve your returns. Please reach out to Brian Lasher (blasher@cigcapitaladvisors.com), Eric T. Pratt (epratt@cigcapitaladvisors.com) or the rest of the CIG team.
This report was prepared by CIG Asset Management and reflects the current opinion of the authors. It is based upon sources and data believed to be accurate and reliable. Opinions and forward-looking statements expressed are subject to change without notice. This information does not constitute a solicitation or an offer to buy or sell any security.
[i] calculated by CIG using data from finance.yahoo.com
[ii] Calculated by CIG Asset Management using data from finance.yahoo.com
[iii] The Daily Spark, published by Apollo 10/18/2023
[iv] Calculated by CIG Asset Management using data from finance.yahoo.com
[v] https://www.lseg.com/en/ftse-russell/indices/russell-us
[vi] https://www.msci.com/documents/10199/86494e1f-914e-4aa5-82a9-2e29ed5adbbf
[vii] https://www.investopedia.com/terms/l/lehmanaggregatebondindex.asp
[viii] The Magnificent 7 is a term coined by Bank of America analyst Michael Hartnett. The seven stocks are Alphabet, Amazon, Apple, Meta Platforms, Microsoft, Nvidia and Tesla. Calculated by CIG Asset Management as of 01/02/2024 using data from State Street Global Advisors and iShares. The S&P 500 index is represented by the SPDR S&P 500 Trust and the Russell 3000 index is represented by the iShares Russell 3000 ETF.
[ix] Calculated by CIG Asset Management using data from finance.yahoo.com
[x] Calculated by CIG Asset Management using data from Zephyr and Tamarac.
[xi] Calculated by CIG Asset Management using data from Tamarac and Zephyr
[xii] The Balanced Benchmark is a blend of 45% Russell 3000, 10% MSCI All-Country World ex US and 45% Bloomberg US Aggregate Bond indices.
[xiii] Calculated by CIG Asset Management using data from Zephyr and Tamarac
[xiv] CFRA research report dated December 8, 2023.
[xv] CIG Dynamic Growth Strategy, CIG Dynamic Balanced Strategy, CIG Strategic Growth Strategy, CIG Strategic Balanced Strategy.
[xvi] Calculated by CIG Asset Management using data from barchart.com
[xvii] https://www.cnbc.com/2018/11/16/nvidia-stock-falls-on-revenue-and-guidance-miss.html
[xviii] Calculated by CIG Asset Management using data from barchart.com
[xix] https://finance.yahoo.com/news/nvidia-stock-dropped-11-rough-231731668.html
agreement
Image: Canva

CIG Press Release: CIG Capital Advisors Announces New Advisory Board as They Posture for Growth in 2024
Contact: Joan Frank
Tel: (248) 330-0001
Email: joan@bfrankcommunications.com
www.bfrankcommunications.com
FOR IMMEDIATE RELEASE:
November 29, 2023 — Southfield, MI —CIG Capital Advisors is gearing up for major strategic growth in the upcoming years, starting with the introduction of its new CIG Advisory Board, which will play a pivotal role in advising and shaping the company’s strategic direction and future growth.
A leading independent wealth management and business advisory services firm, CIG has recruited a distinguished group of thought leaders and innovators to serve on this board, including experts in health care, financial services, investment, and international management to enrich and elevate services for the firm’s expanding client base.
The Advisory Board members include:
- Dr. Mark Kelley, MD – Chair – Former chief executive officer, Henry Ford Medical Group and senior lecturer at Harvard Medical School
- Osman Minkara – Founder and chief executive officer at CIG Capital Advisors
- Jeff Davidson – Former head of investment at Taubman Family Office and senior consultant
- Nigel Thompson – Former president and chief executive officer, Yazaki North America
- Dina Richard – Senior vice president, treasurer and chief investment officer at Trinity Health
- Dr. Raza M. Khan, MD, FACS – Senior partner at Uropartners
- Mindy Richards – Embedded health care consultant and CEO of ChangeScape, Inc.
- Dr. Samer Y. Kazziha, MD, FACC – Senior and head of Cardiovascular Consultants P.C.
The expertise of the Advisory Board will be invaluable in growing CIG’s specialized wealth management and business advisory solutions for successful entrepreneurs and senior executives. The Advisory Board will enhance CIG’s ability to deliver strategic thinking and innovative approaches to a broad range of clients looking to grow their professional or personal wealth opportunities.
“We are honored to welcome these accomplished individuals to our Advisory Board,” said Osman Minkara, founder and CEO of CIG Capital Advisors. “Their guidance and insights will be invaluable as we continue to innovate, grow, and adapt to the ever-changing wealth management and business advisory landscape. We believe that their collective wisdom will help us steer CIG toward new horizons.”
That dedication to excellence is embraced by the Advisory Board, underscoring CIG’s determination to further expand its leadership in the financial industry. “As advisory board members, our mission is to drive innovation and bring about positive change through collective expertise and collaboration,” says Dr. Mark Kelley. “We aim to stay ahead of the curve by anticipating trends and proactively addressing challenges.”
CIG Capital Advisors has built robust integrated services that elevate the client experience. Serving as their clients’ trusted partner, CIG is committed to providing unique solutions to complex problems and to guiding clients on their individualized financial journeys. That forward thinking will drive the firm’s growth in the years ahead, as they offer robust guidance and expertise with the same personalized attention that sets CIG apart from the crowd.
About CIG Capital Advisors
Founded in 1997, CIG Capital Advisors (CIG) is a wealth management and business advisory services firm serving high-net-worth clients—enabling these individuals and families to focus on what is most important to them. CIG tailors its delivery of service based on the situation, goals, and aspirations of each client it works with. The firm seeks to provide exceptional client benefit through its independent, objective, and transparent strategic thinking and implementations. CIG is based in Southfield, MI.
For more information on CIG Capital Advisors visit cigcapitaladvisors.com. Media inquiries contact Joan Frank at B. Frank Communications at (248) 330-0001 or joan@bfrankcommunications.com.
Advisory Board
Image: Conny Schneider/Unsplash

CIG Asset Management Update: Year-to-Date U.S. Stock Performance in Pictures
The chart below shows the year-to-date performance through October 20, 2023, of the market cap-weighted S&P 500 – represented by the SPDR S&P 50 ETF (SPY) gaining +10.4% versus the equal-weighted S&P 500 – represented by the Invesco S&P 500 Equal Weight ETF (RSP) falling -3.5%. [i]
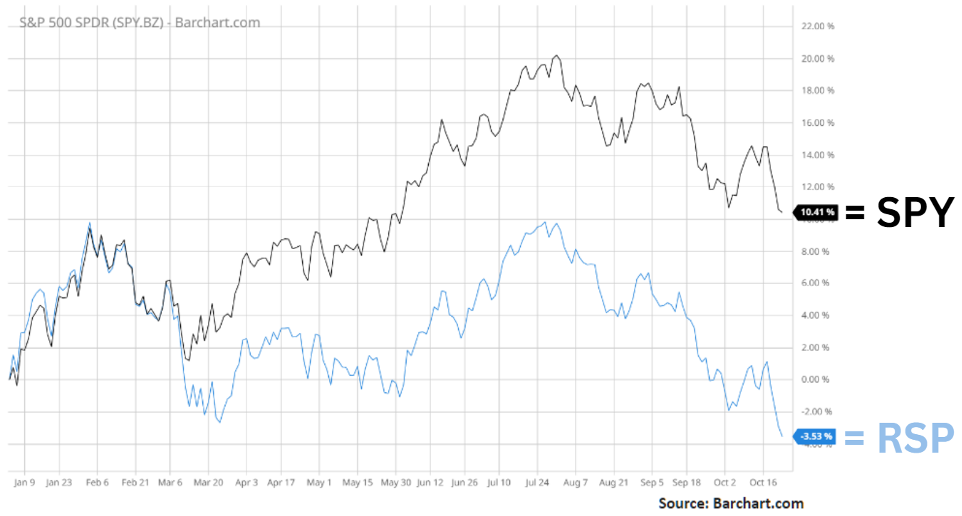
Source: Barchart.com
Why is there such a big difference in returns between the two indices?
Year-to-date through October 24, 2023, the performance of the stock market and its 11 major S&P sectors may best be described as the battle between the “haves” and the “have nots”.
Three sectors, Communication Services, Technology, and Consumer Cyclicals are outperforming the other eight by a wide margin. As seen in the chart below, six sectors are down year-to-date.
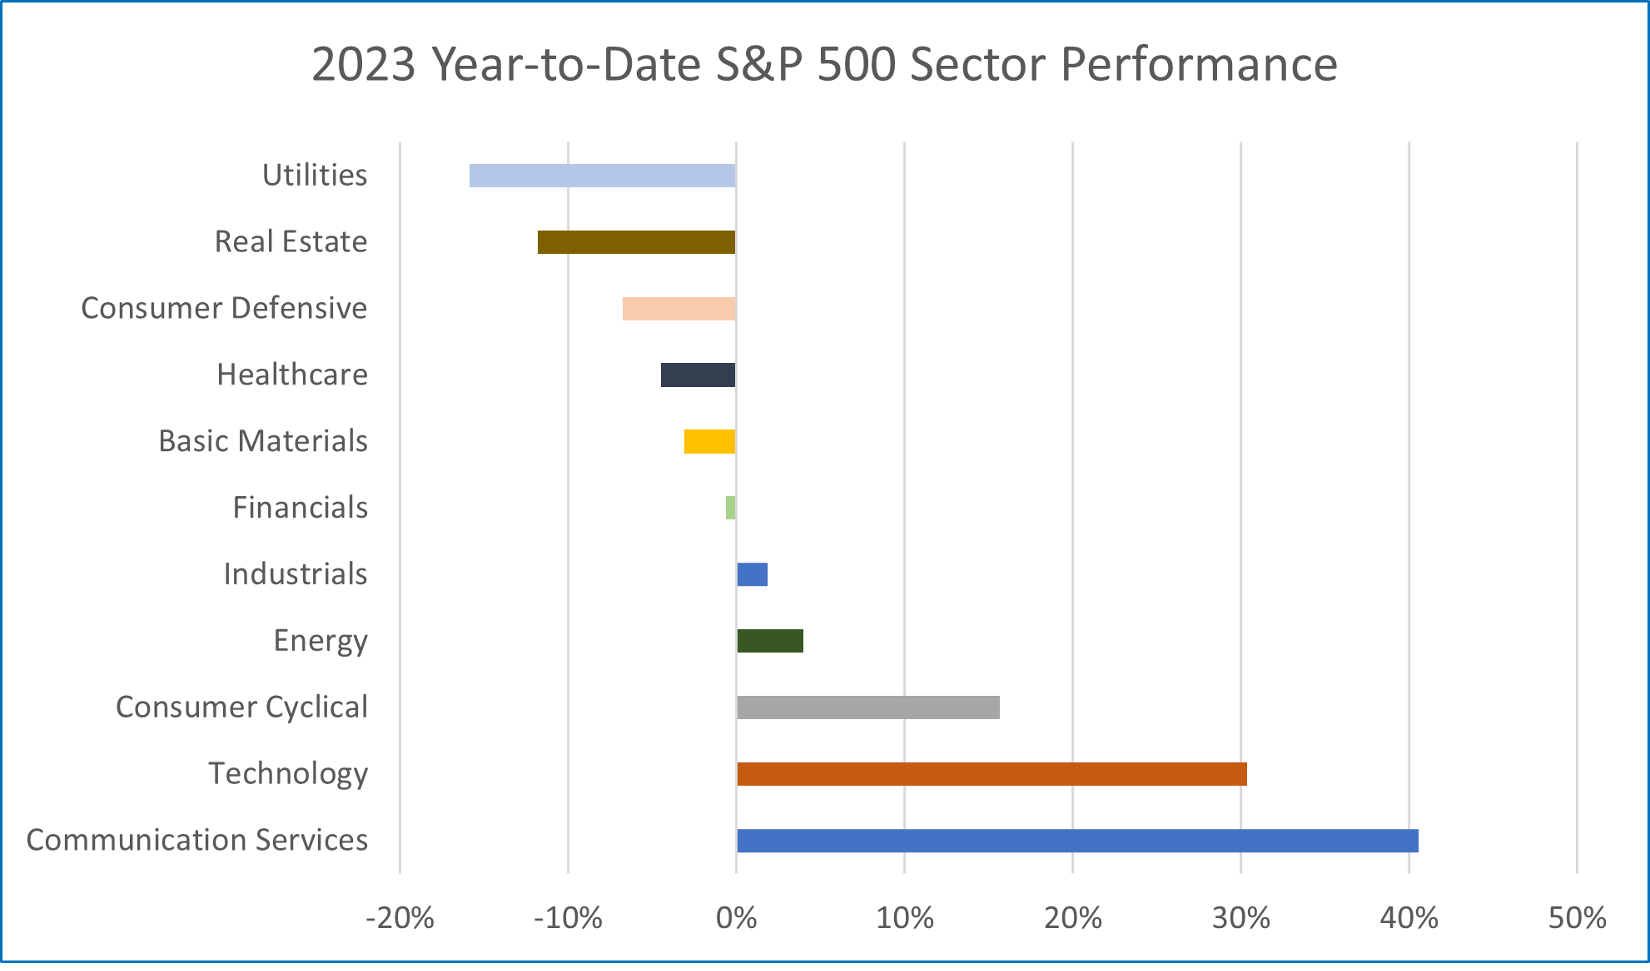
Source: FinViz.com as of October 24, 2023
What is driving the performance of the three outperforming sectors? Why is performance so skewed?

The answer to why there is such a big difference in returns between the equal-weighted S&P 500 and the size-weighted S&P 500 and in returns between sectors lies in this heat map which shows all 500 companies that are included in the S&P 500. [ii]
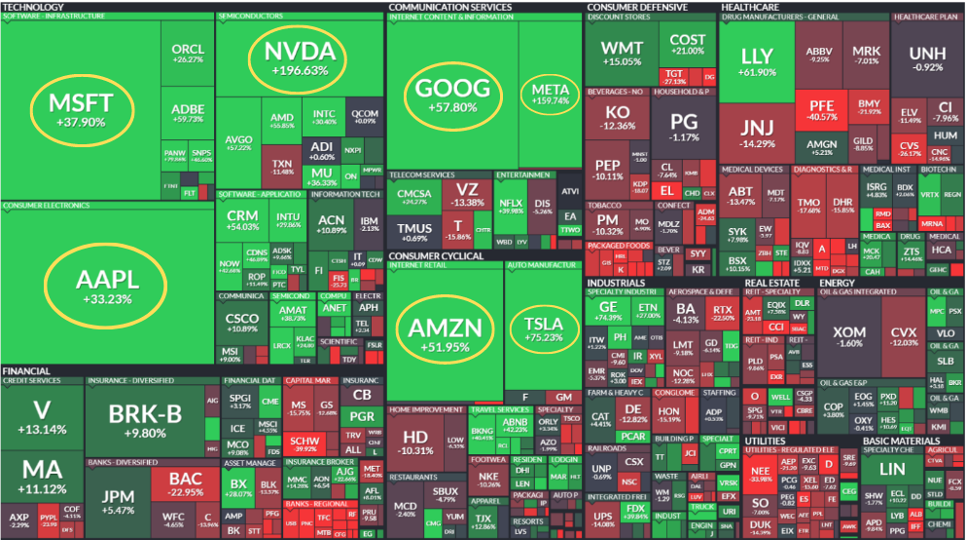
Source: FinViz.com as of October 24, 2023
The answer lies with the seven large bright green boxes with their symbols circled in yellow. All seven of these stocks are in one of the three outperforming sectors previously identified on the S&P 500 Sector Performance bar chart. Bank of America analyst Michael Hartnett has called this group of seven stocks the “Magnificent 7”.[iii] Currently, over 25% of the S&P 500’s total market capitalization is in these Magnificent 7 stocks. [iv]
According to Torsten Slok, Chief Economist at Apollo Asset Management, “The bottom line is that returns this year in the S&P 500 have been driven entirely by returns in the seven biggest stocks, and these seven stocks have become more and more overvalued.”[v] Apollo Asset Management manages over half a trillion dollars in assets.
Why is this so remarkable and when will this situation end?
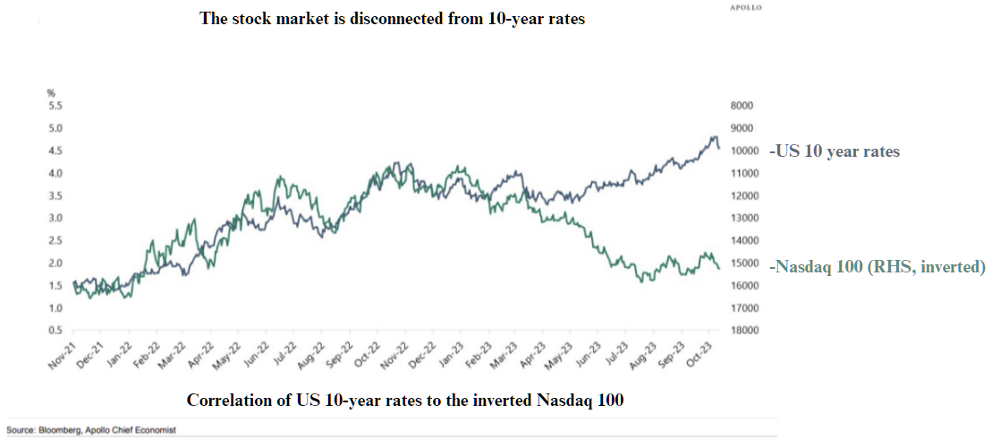
Slok concludes that “tech valuations are very high and inconsistent with the significant rise in long-term interest rates… In short, something has to give. Either stocks have to go down to be consistent with the current level of interest rates. Or long-term interest rates have to go down to be consistent with the current level of stock prices.”[vi]
Year-to-date through September 30, if you invested in a DIVERSIFIED portfolio with 60% invested in the Equal Weighted S&P 500 (RSP) and 40% invested in Bloomberg Barclay Aggregate Bond Index (AGG), you would have generated lower returns than if one chased only these Magnificent 7 stocks. [vii]
Some investors might describe us at CIG as being bearish because we don’t find the Magnificent 7 attractive, but we’re not so pessimistic as to believe there are only seven growth opportunities in the entire global equity market. In particular, we feel that we have identified an investment theme for long-term investors.
We are beginning to allocate money into Clean Transition Investing – a theme where one invests in different areas that work towards net zero emissions, or clean energy. The Paris Agreement of 2015 outlined the long-term goal of reaching net zero emissions by the year 2050.[viii] Fixing the electrical grid, focusing on renewable energy, hydrogen, energy storage, electric vehicles and the required infrastructure that goes along with them, sustainable mining, and smart agriculture are just examples of what need to be worked on.
While the eventual changing of sector leadership across cycles tends to be accompanied by significant market volatility, we will be there to guide you through these changes. CIG’s goals are to provide a financial roadmap for our clients and their families – over both near-term and long-term time horizons – as we implement structures to potentially increase protection of your assets and optimize investment risks and returns, and aid in the creation of legacy platforms.
We would welcome a conversation with you regarding how we can help you navigate these interesting times. We would like to hear from you. Please reach out to Brian Lasher (blasher@cigcapitaladvisors.com), Eric T. Pratt (epratt@cigcapitaladvisors.com) or the rest of the CIG team.

CIG Asset Management Update: A New Bull Market?
Summary:
* Are we in a new bull market?
* S&P 500 performance continues to be concentrated in only a few names.
June 2023 Returns:
| Benchmark / Index | Return | Benchmark / Index | Return |
|---|---|---|---|
| Growth Benchmark[i] |
4.7% |
Balanced Benchmark[ii] |
3.4% |
| S&P 500[iii] |
+6.6% |
Bloomberg US Agg Bond[iv] |
(0.4%) |
| MSCI EAFE[v] |
4.6% |
MSCI Emerging Markets[vi] |
3.8% |
| Gold[vii] |
(2.2%) |
Crude Oil[viii] |
+3.8% |
Commentary:
Domestic equities continued to rally in June after President Biden signed the Fiscal Responsibility Act of 2023, which raised the debt limit into law on June 3, 2023, ending the current debt limit crisis.[ix] On June 8, the S&P 500 rose, putting the index +20% above its October 12, 2022 low – possibly signaling the start of a new bull market.[x] A bull market is commonly defined as a +20% move in stock prices.[xi] The technology-heavy NASDAQ 100 index gained almost +40% for the first half of 2023 – its best first half ever.[xii] Crude oil regained some of May’s losses, advancing +3.8% for the month.[xiii]
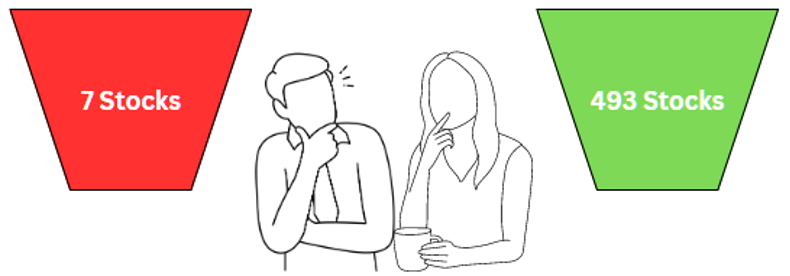
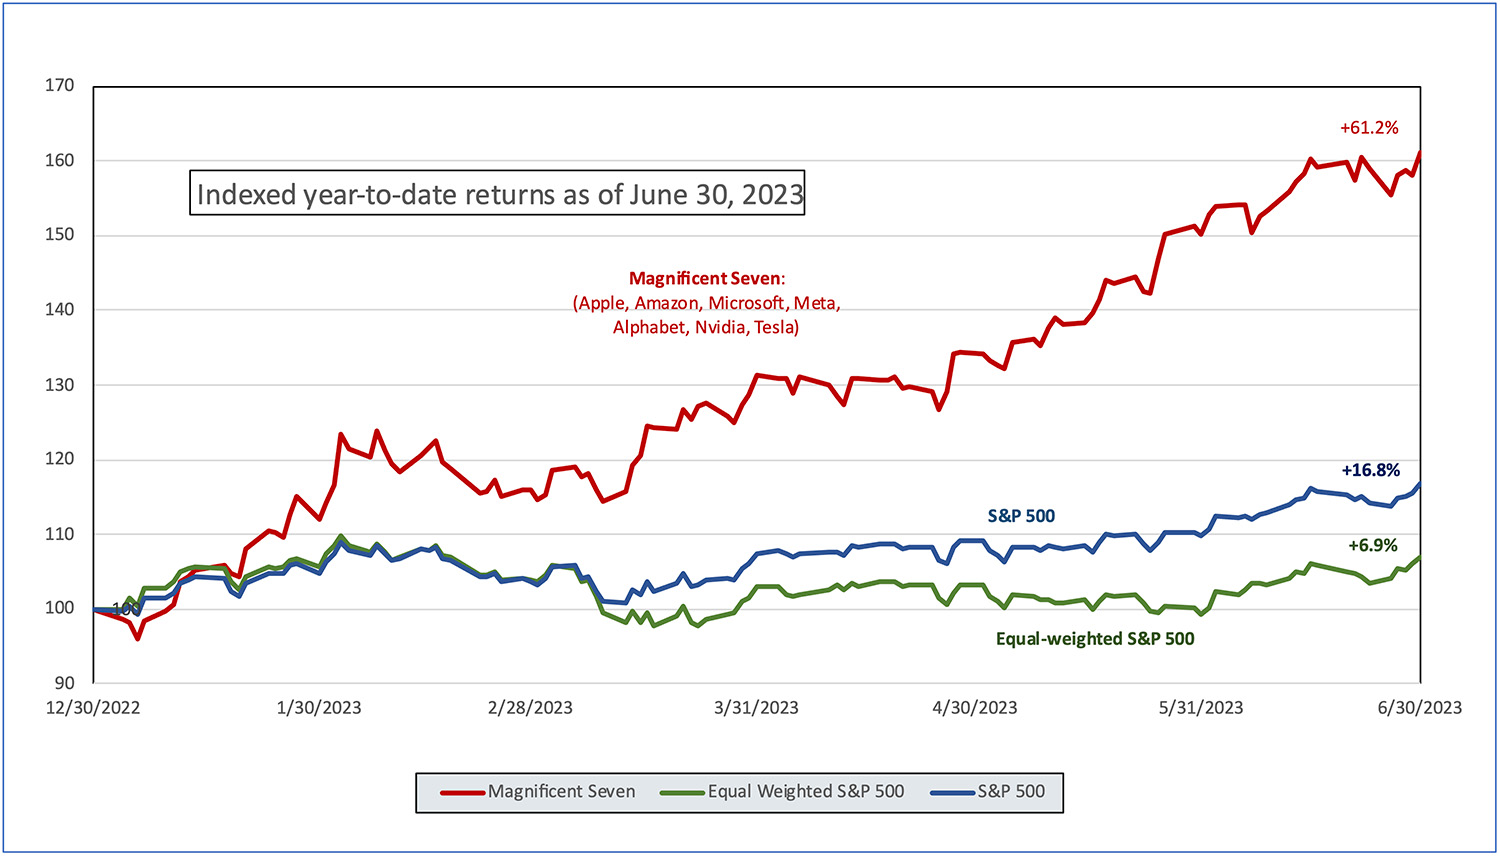
Are we in a new bull market? Technically, when measured from the October 12, 2022 low, the answer is yes. However, the recent rally in stocks has not been broad based. A small number of mega-cap technology stocks have driven returns. Michael Hartnett, investment strategist at Bank of America, has referred to the biggest seven mega-cap monopolistic U.S. tech stocks – Apple, Amazon, Microsoft, Meta, Alphabet, Nvidia and Tesla – as the Magnificent Seven.[xiv] As seen in the following chart, year-to-date through June 30, 2023, the Magnificent Seven gained +61.2%.[xv] The S&P 500, a market cap weighted index, gained +16.8%[xvi] as the equal-weighted S&P 500 was only up +6.9% during this same period.[xvii]
According to J.P. Morgan Asset Management, the top ten largest companies in the S&P 500 accounted for over 95% of the index’s year-to-date return for the first half of 2023.[xviii]
Historically, when a small number of stocks dominate overall market performance, it is not automatically a reason to sell equities. Sometimes the rally will broaden out to stocks that have lagged in performance and sometimes the outperforming stocks will give back some of their returns. While we are hopeful the current rally will broaden out to lagging stocks, we are cautious as many strategists expect a recession at some time in the next twelve months. As we wrote about last month in Technology Bubble 2.0?, it is our opinion that the current outperformance of the Magnificent Seven has been driven by artificial intelligence (A.I.) mania and we are skeptical that the gains can hold. Six of the seven Magnificent Seven stocks are experiencing sharply declining sales and earnings growth this year.[xix]
CNN’s Fear & Greed Index has reached the “Extreme Greed” level as seen in the graphic below.[xx]
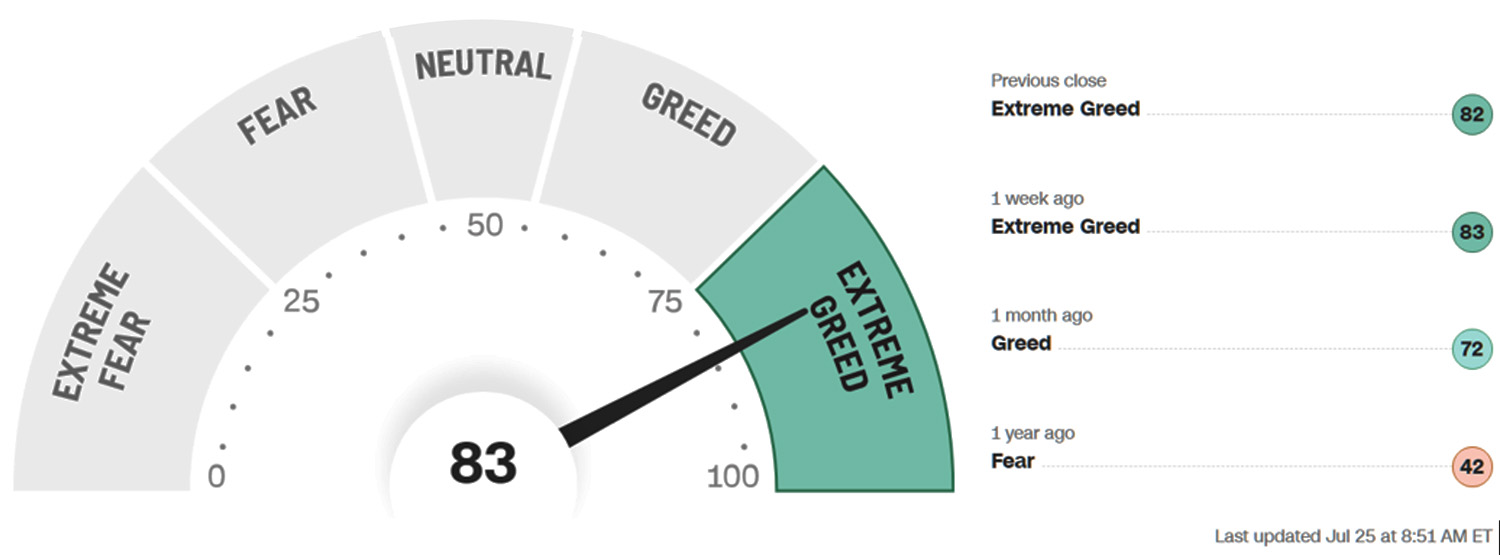
Source: https://www.cnn.com/markets/fear-and-greed as of 8:53am, 7/25/2023
We agree with legendary investor Warren Buffett’s thoughts on fear and greed. Buffett, in his 1986 Berkshire Hathaway letter to shareholders famously wrote, “What we do know, however, is that occasional outbreaks of those two super-contagious diseases, fear and greed, will forever occur in the investment community. The timing of these epidemics will be unpredictable. And the market aberrations produced by them will be equally unpredictable, both as to duration and degree. Therefore, we never try to anticipate the arrival or departure of either disease. Our goal is more modest: we simply attempt to be fearful when others are greedy and to be greedy only when others are fearful.”[xxi]
Many investors currently have FOMO – fear of missing out. We believe many investors are experiencing the disease of greed and it appears dangerous to chase the returns of the Magnificent Seven stocks. Some investors have suffered in the past when they chased returns for fear of missing out. Chuck Prince, CEO of Citigroup in July 2007 was interviewed by the Financial Times regarding his company’s investment exposure and said that global liquidity was enormous and, “As long as the music is playing, you’ve got to get up and dance. We’re still dancing.”[xxii] As Prince was saying “get up and dance” in July 2007, Bear Stearns was bailing out two hedge funds with $20 billion of exposure to subprime mortgages. Many historians cite Bear Stearns as the beginning of the 2007-2008 Great Financial Crisis (GFC). During the GFC, stock markets experienced large drawdowns and it took years for investors to recover. We wrote about just how long it took markets to recover in What If the Bubble Bursts?[xxiii] Some stocks never recovered – Citigroup’s stock currently trades -90% lower than where it was in July 2007.[xxiv] Citigroup’s CEO may have better served his shareholders if he sat the dance out. Have investors already forgotten that earlier this year we experienced three of the four largest bank failures ever – First Republic Bank, Silicon Valley Bank and Signature Bank?[xxv] The Federal Reserve has not forgotten. On July 10, Michael Barr, the Federal Reserve’s Vice Chair for Supervision announced that he is advocating tougher bank capital requirements and tougher annual stress tests for U.S. banks.[xxvi] Will tougher banking requirements affect liquidity?
At CIG, we are not entirely sitting the current dance out. We are limiting our equity exposure. At the end of June 2023, our CIG Dynamic Growth Strategy held -29% less U.S. equities than the growth benchmark.[xxvii] We have taken this difference and put it into liquid alternative investments which helped us outperform the markets last year and aim to offer some protection again should markets sour in the second half of this year.
To attempt to strike the right balance in client portfolios, we think that we should be striving to reach the return necessary to meet the various needs of our clients’ financial plans while taking as little risk as possible to meet that goal. For many clients, now at mid-year, we are halfway there.
We would like to hear from you. Please reach out to Brian Lasher (BLasher@cigcapitaladvisors.com), Eric T. Pratt (EPratt@cigcapitaladvisors.com) or the rest of the CIG team.