
Update from CIG Asset Management – What’s Your Benchmark?
Do you compare your investment portfolio’s performance to a popular stock that you hear about on CNBC?
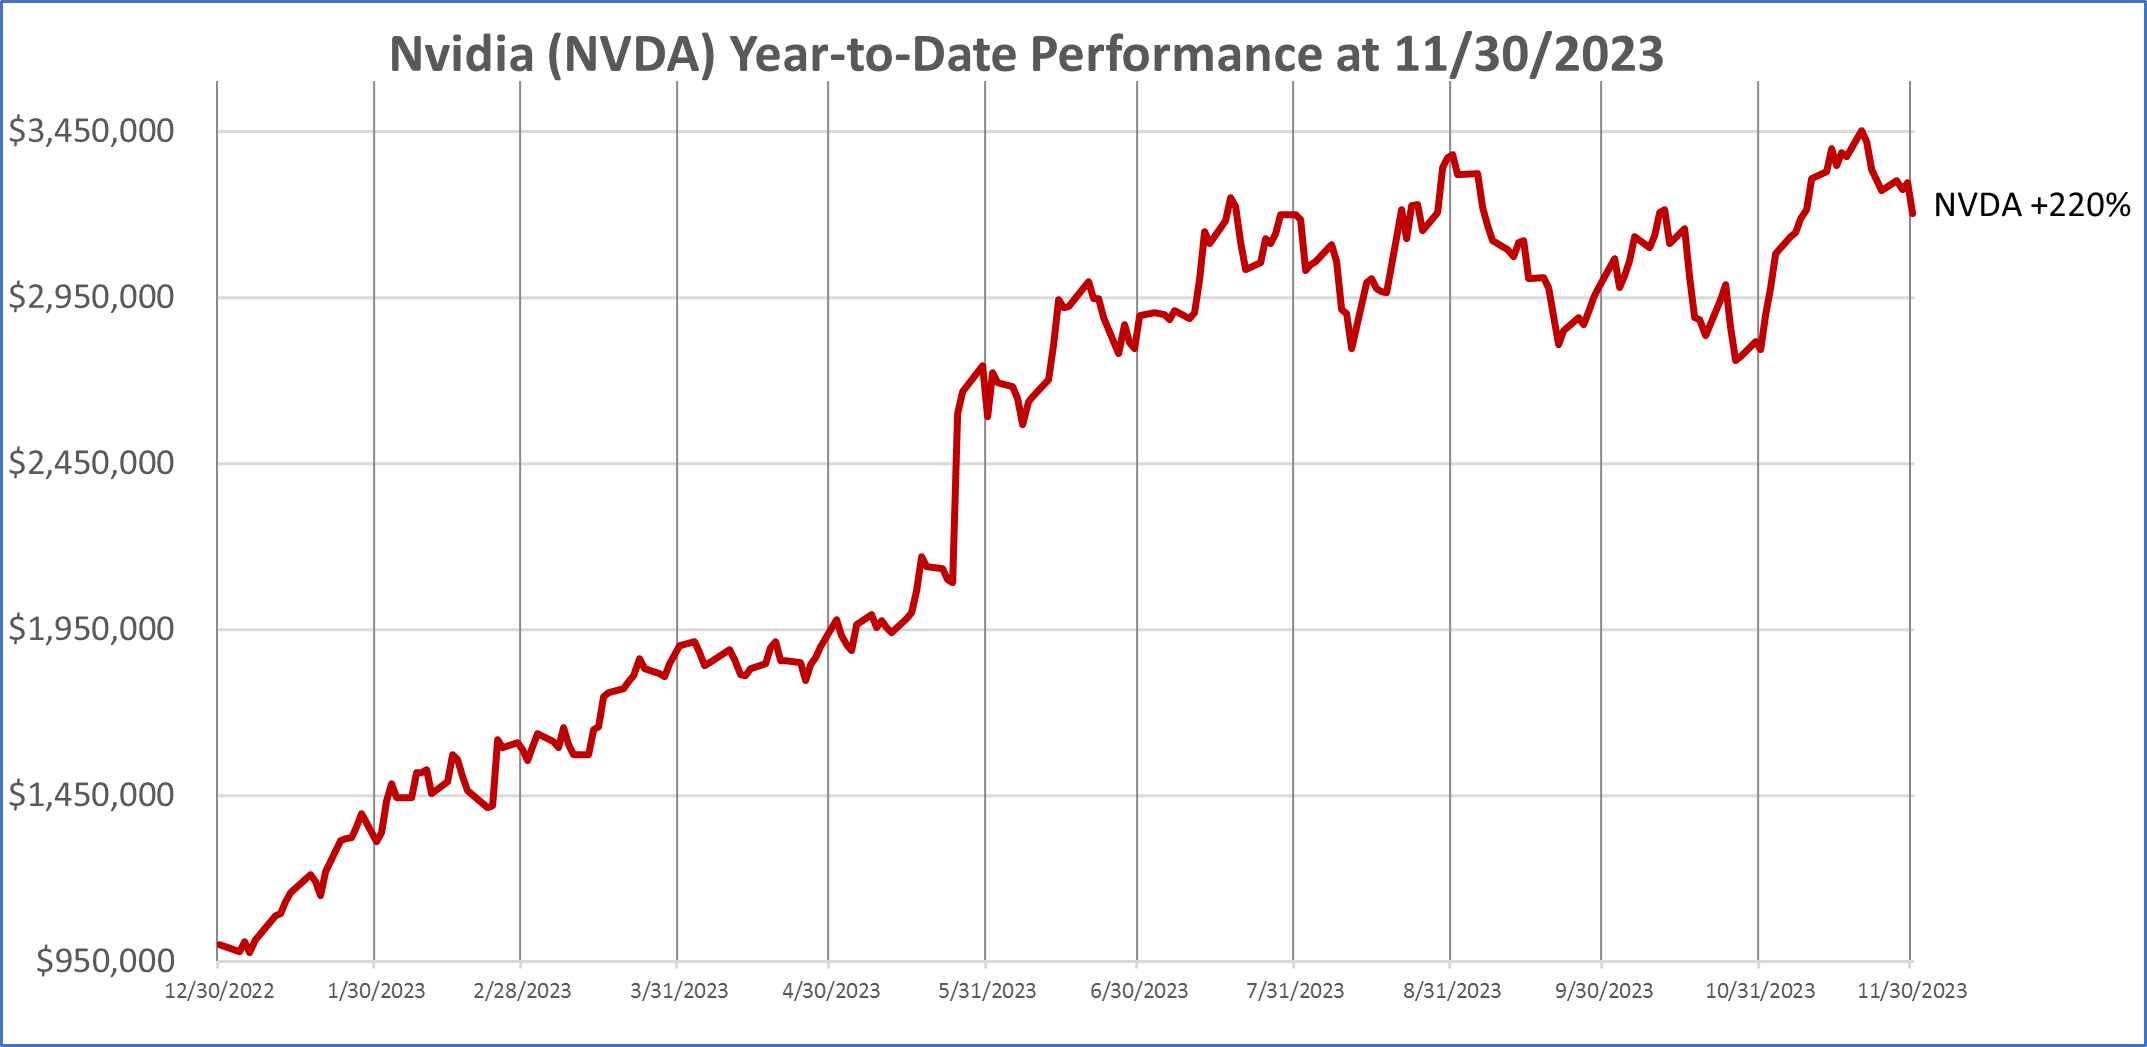
This is the daily chart for Nvidia, a single stock that soared +220% year-to-date through November 30, 2023. [i]
Maybe you compare your portfolio to the S&P 500.
Year-to-date through November 30, 2023, the S&P 500, represented by the SPDR S&P 500 ETF (SPY), is up +20.7%. [ii] It might be appropriate to use the S&P 500 as your benchmark if you invest all your money in large and mid-sized companies that are domiciled in the United States. However, if you are using an important tool like many investors in managing investment risk – diversification – that is, spreading your investments among and within different asset classes, then comparing your performance to the S&P 500 is likely to leave you disappointed.
This year, that disappointment is likely to be WORSE because as we discussed last month in Year-to-Date U.S. Stock Performance in Pictures, the S&P 500 performance thus far this year had been dominated by just 7 stocks – the Magnificent 7 – which Torsten Slok, Chief Economist at Apollo Asset Management said were becoming more and more overvalued and, in our view, more dangerous to invest in. [iii] Are we headed toward a big loss like post the year 2000, when the dot com stocks fell and the S&P 500 had fallen -49% from its peak on March 27, 2000, to its low On October 9, 2022? [iv]
At CIG, we believe in the adage, “Don’t put all your eggs in one basket”. We employ active asset allocation to employ varying levels of exposure to various sectors of domestic and international stocks, fixed income, and alternatives, such as gold and commodities, in an attempt to manage risk throughout market cycles.
How do we compare our strategies’ performance?
At CIG, we utilize benchmarks that are invested in a blend of three major asset classes- domestic equities, international equities, and fixed income.
- Domestic equities are represented by the Russell 3000 Index, a market capitalization-weighted index which measures the performance of the 3,000 largest U.S. companies and representing approximately 96% of the investible U.S. equity market. [v]
- International equities are represented by the MSCI ACWI ex USA Index, an index covering approximately 85% of the global equity opportunity set outside of the United States. [vi]
- Fixed income is represented by the Bloomberg U.S. Aggregate Index, an index composed of investment-grade government and corporate bonds. [vii]
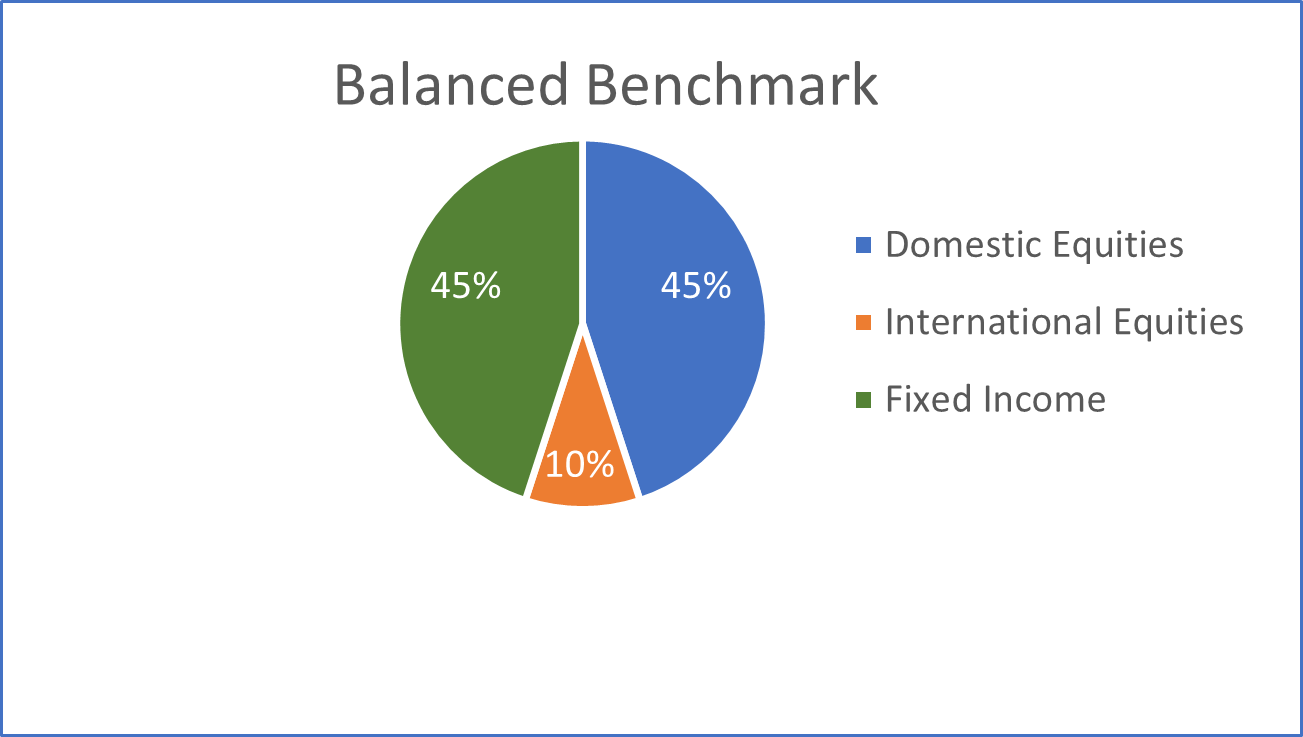
The pie chart below illustrates the weightings of the three major asset classes in our balanced benchmark. We compare the performance of our clients whom we generally describe as balanced investors to the performance of this balanced benchmark.
In the following bar chart, we compare year-to-date performance of the components of our balanced benchmark to the S&P 500 and Equal-Weighted S&P 500 as of November 30, 2023.
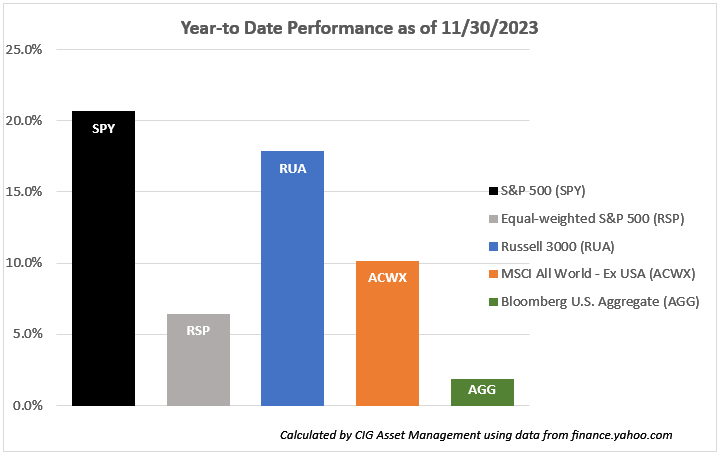
Year-to-date, the Russell 3000 – the domestic equity index we use in our benchmarks – gained +17.8%. The Russell 3000 has a similar issue to Magnificent 7 stock dominance, with 24% of the index invested in these seven stocks but not to the same extent as the S&P 500, with 28%. [viii] Over the same period, the MSCI ACWI ex USA index (ACWX) gained +10.1%, less than half of the S&P 500, and the Bloomberg U.S. Aggregate Index (AGG) was only up +1.9%. [ix] This year, if you employed diversification – spreading your investments among and within different asset classes in the chart above instead of only investing in the S&P 500, you clearly experienced lower returns than the S&P 500.
Now that we have told you about our balanced benchmark, what is the appropriate period to assess how one has done versus the benchmarks? Should you look at it every day? How should we be looking at returns and the amount of risk you are taking?
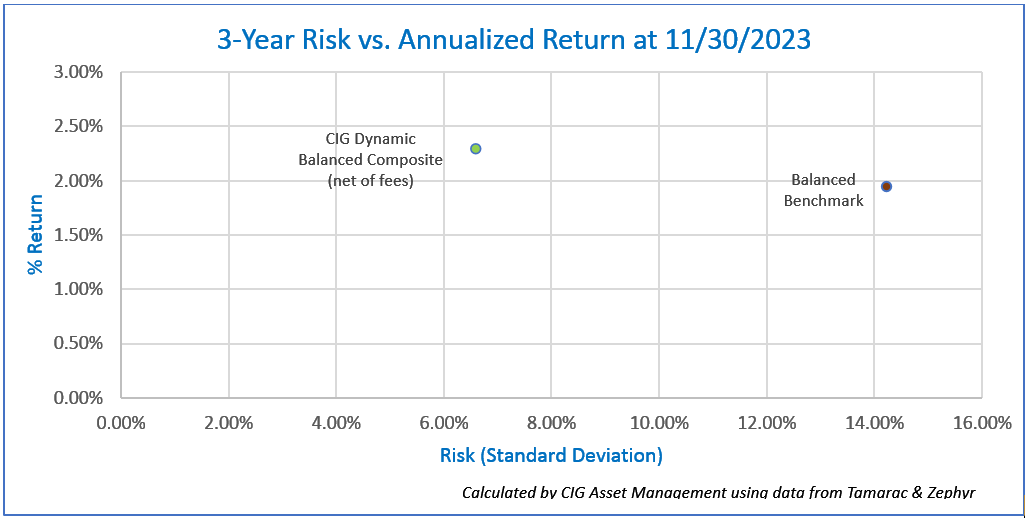
We prefer to look at returns and risk over a trailing 3-year period. We measure risk using the standard deviation of returns. The CIG Dynamic Balanced Composite trailing 3-Year annualized return as of November 30, 2023, is +2.30%, net of fees, and the 3-year standard deviation is 6.6%. [x] The Balanced Benchmark’s trailing 3-year annualized return as of November 30, 2023, is +1.95% and the 3-year standard deviation is 14.2%. [xi]
You can see in the chart below that the CIG Dynamic Balanced Composite is taking less than half (46%) of the risk, as measured by the standard deviation of annualized three year returns, of the balanced benchmark [xii] and is returning 118% of the balanced benchmark’s return on a trailing 3-year annualized basis. [xiii]
At CIG, we believe in risk-balanced investing. We believe investors should consider how much risk they are taking to achieve returns. We think that we should be striving to reach the return necessary to meet the various needs of our client’s financial plans while, at this point in the market cycle, taking as little risk as possible to meet that goal. We want you to sleep at night.
Speaking of risk, let’s go back to the first chart on page one, Nvidia (NVDA). Nvidia has experienced many booms and busts over the years. The stock is currently booming, up +220% year-to-date through November 30, 2023, due to surging sales of its artificial intelligence chip. [xiv] As of December 31st, 2023, we own a small amount of Nvidia in our dynamic and strategic balanced and growth models [xv] via our iShares Semiconductor ETF SOXX holding.
We are very cautious regarding NVDA, the company has experienced two large losses in the past five years. In the fourth quarter of 2018, NVDA stock suffered a -56% drawdown in 82 days [xvi] due to the company warning about excess inventory of graphic chips for gaming. [xvii] In 2022, NVDA stock suffered a -66% drawdown in 329 days [xviii] as cancelled orders from personal computer makers and weakness in crypto mining orders negatively impacted sales and earnings. [xix]
So, what is your benchmark, an individual stock like Nvidia that fell -66% in 329 days in 2022, or an index like the S&P 500 that fell -49% from its peak on March 27, 2000, to its low On October 9, 2022?
We counsel investors to understand what they are invested in – typically a diversified portfolio – and measure their results with the appropriate diversified, blended benchmark. Life is too short to be frustrated.
If you are not a client, we are happy to review how much risk that you are taking to achieve your returns. Please reach out to Brian Lasher (blasher@cigcapitaladvisors.com), Eric T. Pratt (epratt@cigcapitaladvisors.com) or the rest of the CIG team.
This report was prepared by CIG Asset Management and reflects the current opinion of the authors. It is based upon sources and data believed to be accurate and reliable. Opinions and forward-looking statements expressed are subject to change without notice. This information does not constitute a solicitation or an offer to buy or sell any security.
[i] calculated by CIG using data from finance.yahoo.com
[ii] Calculated by CIG Asset Management using data from finance.yahoo.com
[iii] The Daily Spark, published by Apollo 10/18/2023
[iv] Calculated by CIG Asset Management using data from finance.yahoo.com
[v] https://www.lseg.com/en/ftse-russell/indices/russell-us
[vi] https://www.msci.com/documents/10199/86494e1f-914e-4aa5-82a9-2e29ed5adbbf
[vii] https://www.investopedia.com/terms/l/lehmanaggregatebondindex.asp
[viii] The Magnificent 7 is a term coined by Bank of America analyst Michael Hartnett. The seven stocks are Alphabet, Amazon, Apple, Meta Platforms, Microsoft, Nvidia and Tesla. Calculated by CIG Asset Management as of 01/02/2024 using data from State Street Global Advisors and iShares. The S&P 500 index is represented by the SPDR S&P 500 Trust and the Russell 3000 index is represented by the iShares Russell 3000 ETF.
[ix] Calculated by CIG Asset Management using data from finance.yahoo.com
[x] Calculated by CIG Asset Management using data from Zephyr and Tamarac.
[xi] Calculated by CIG Asset Management using data from Tamarac and Zephyr
[xii] The Balanced Benchmark is a blend of 45% Russell 3000, 10% MSCI All-Country World ex US and 45% Bloomberg US Aggregate Bond indices.
[xiii] Calculated by CIG Asset Management using data from Zephyr and Tamarac
[xiv] CFRA research report dated December 8, 2023.
[xv] CIG Dynamic Growth Strategy, CIG Dynamic Balanced Strategy, CIG Strategic Growth Strategy, CIG Strategic Balanced Strategy.
[xvi] Calculated by CIG Asset Management using data from barchart.com
[xvii] https://www.cnbc.com/2018/11/16/nvidia-stock-falls-on-revenue-and-guidance-miss.html
[xviii] Calculated by CIG Asset Management using data from barchart.com
[xix] https://finance.yahoo.com/news/nvidia-stock-dropped-11-rough-231731668.html
agreement
Image: Canva

CIG Asset Management Update April 2020: Uncharted Territory
Equity markets embarked on their own version of the much hoped-for “v” shaped economic recovery during the month of April, even as economic data continued to record nasty numbers. The S&P 500(1) gained +12.7%, recovering much of the prior month’s losses. Outside of the U.S., the MSCI EAFE net(2) was up +6.5% and the MSCI Emerging Markets Index was up +9.2%(2). Within fixed income, the Barclays U.S. Aggregate Total Return Index (3) returned +1.8% and the Barclays U.S. High Yield Index(3) increased +4.5% for the month.
In April, there was a continued tug-of-war between economic reality and hopes that the worst of the pandemic may be behind us:
On Friday, April 3, it was reported that the March unemployment rate rose to 4.4%, the highest since August 2017.(4) Over the following weekend, many anecdotal news stories came out, spreading hope that COVID-19 was peaking. The ensuing Monday, April 8, the S&P 500 was up +7.03% for the day(5).
The weekly unemployment report on April 9 showed another 6.6 million in weekly claims(6), only to be quickly forgotten about as the Federal Reserve issued a statement within seconds of the Department of Labor release. The Fed announced a $2.3 trillion relief package including the Main Street Lending Program, to lend money to mid-sized businesses, and a municipal and corporate bond buying program. This latest Fed action put them far past anything they attempted during the 2008 Great Financial Crisis.
The April 16 weekly unemployment claims were 5.2 million(6), and the following day, a report that Remdesivir, an anti-viral drug may help treat symptoms of COVID-19, was made public.
Then on April 21, West Texas Intermediate oil futures settled at a negative number – never before had that happened! The following day, President Trump tweeted that we could shoot Iran boats down in the Persian Gulf, and of course, the oil and the stock markets rallied.
On April 23, weekly unemployment claims totaled 4.4 million(6). The following day, April 24, President Trump said that Apple CEO Tim Cook told him in a private conversation that he believes there will be a “v” shaped economic recovery, and markets moved higher.
April 30 weekly report brought another 3.8 million unemployed claims(6). The following weekend, several states began to gradually reopen their economies.
As can be clearly seen in the above timeline, every extremely negative economic statistic that was reported in April was met soon after by either a Federal Reserve announcement, a Trump tweet or positive news stories about pandemic hopes.
No rallies are more violent than bear market rallies and seeing April produce one of the most forceful rallies in decades fits that playbook. We would argue that the markets just followed a historic playbook given historic interventions on the monetary and fiscal fronts. Warren Buffett indicated at his May shareholders’ meeting that he’s not finding places of value to invest and has announced the selling of all airline shares with the view that the impacts of the recent crisis will not magically disappear but will take time to filter through the system.
In the meantime, what is driving the performance of the S&P 500 Index? To oversimplify, it comes down to five companies; Facebook (FB), Amazon (AMZN), Apple (AAPL), Microsoft (MSFT) and Alphabet (GOOGL). The acronym that most on Wall Street use is FAAMG. Year-to-date through April 30, the FAAMG stocks are up an average of +10% versus the other 495 companies in the S&P 500 down -13%(7).
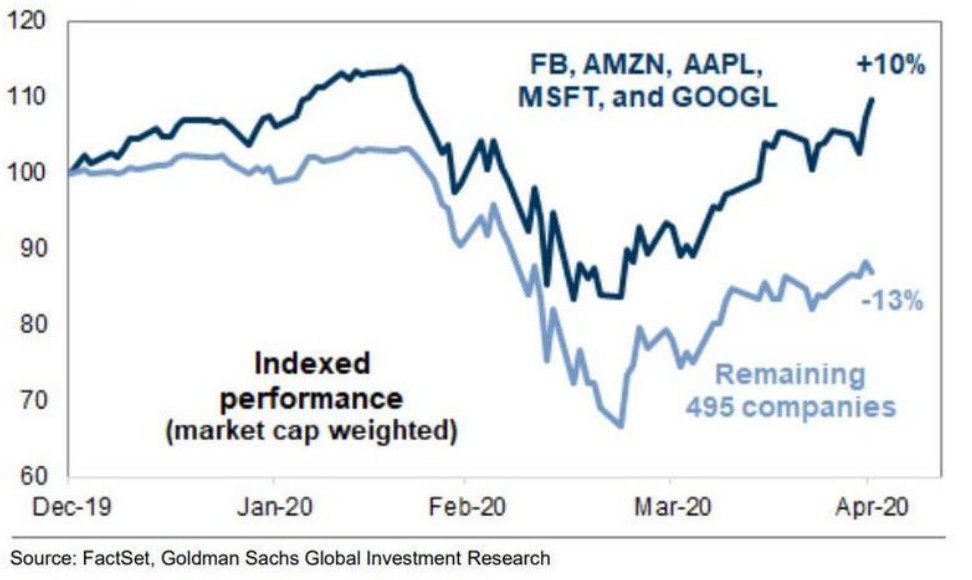
The performance spread between the FAAMG stocks and rest of the S&P 500 will most likely narrow over time. The lagging 495 stocks could begin to catch up with the leaders, FAAMG could start underperforming, or a combination of the two.
We have mentioned before that it’s not possible to forecast the path of the pandemic. In contrast to the above, states reopening and the massive Federal stimulus have already produced “green shoots” suggesting that the economy could begin to recover. Starbucks announced on May 5 they planned to open 85% of its locations by the end of the week, with contactless pickup and cashless payments. Simon Properties, the country’s largest shopping mall operator, announced it would open malls as states allow it. Recent activity on the Apple map app is showing signs that driving activity is starting to rebound. We would especially like to strike an optimistic tone on that last point.
Here at CIG we continue to be proactive and nimble as we see how long this bear market rally and tug-of-war can continue.
This report was prepared by CIG Asset Management and reflects the current opinion of the authors. It is based upon sources and data believed to be accurate and reliable. Opinions and forward-looking statements expressed are subject to change without notice. This information does not constitute a solicitation or an offer to buy or sell any security.
SOURCES:
- Calculated from data obtained from Yahoo Finance, as of May 1, 2020.
- MSCI, as of May 1, 2020
- NEPC
- Bureau of Labor Statistics, April 3, 2020
- Calculated from data obtained from Yahoo Finance, as of May 1, 2020
- United States Department of Labor.
- FactSet, Goldman Sachs Global Investment Research
CIG Asset Management Update October 2019: The Undercurrent in the Markets
Equity markets finished a challenging third quarter of 2019 with positive returns. While the last three months have been held back by worries about trade relations and slowing economic growth, the quarter’s other dominating force of Central Bank (CB) easing won out in September, especially in Europe. International stocks, as measured by MSCI EAFE Net(1), […]

CIG Asset Management Update September 2019: The Surge in Safe-Haven Assets
Although global equities generally lost money in August, the S&P 500 Index(1) closed just 3.3% below its all-time high. However, investors’ uneasiness dramatically drove market participants concerned about the escalating trade conflicts, slowing global growth and possible Chinese incursions into Hong Kong to safe-haven investments. The number of dramatic daily moves in bonds, one safe-haven […]
CIG Asset Management Update June 2019: Economic War Throttles Market in May
China and the U.S. entered into an economic war in May and the markets suffered. Very quickly we have moved past the stage of trade tensions, trade frictions, a trade dispute, or even a tariff war between two superpowers. At month end, tariffs were also announced on Mexico. Given the ratcheting up of national security […]
CIG Asset Management April 2019 Update
Following the very difficult end of 2018, stocks made a strong comeback in the first quarter of 2019, and most of it hinged on the Federal Reserve. We have come a long way since Fed Chairman Powell appeared to drive down the market on October 3 with these comments: “The extremely accommodating low interest rates […]