
Update from CIG Asset Management: Extremes May Create Opportunities
The stock market rally continues. Through June 13, 2024, the S&P 500 has gained +14.7% year-to-date and we still haven’t seen a single-day decline of over 2% in 479 days, the third longest stretch in the past 25 years. [i] We wrote about this extraordinary winning streak in last month’s update, Where are we now?
This year, some investors who have a diversified portfolio that owns many stocks across many sectors, may feel like they are missing out on the current rally. They may see on CNBC or read in the Wall Street Journal that the market is at its all-time high, yet their own portfolio is not.
Closely examining the following extreme market internals; narrow sector performance, large market cap outperformance and S&P 500 index concentration can help explain what is happening beneath the surface.
Sector performance is narrowing again. In our CIG Asset Management Update on April 1, 2024, we discussed encouraging signs that the stock market rally may be broadening. We may have been early on that call. As you can see in the chart below, month-to-date at June 14, 2024, the technology sector has gained +9.1%, communication services – which is mostly comprised of Meta and Google – advanced +1.7%, and the other nine of the eleven S&P 500 sectors were all down. [ii]
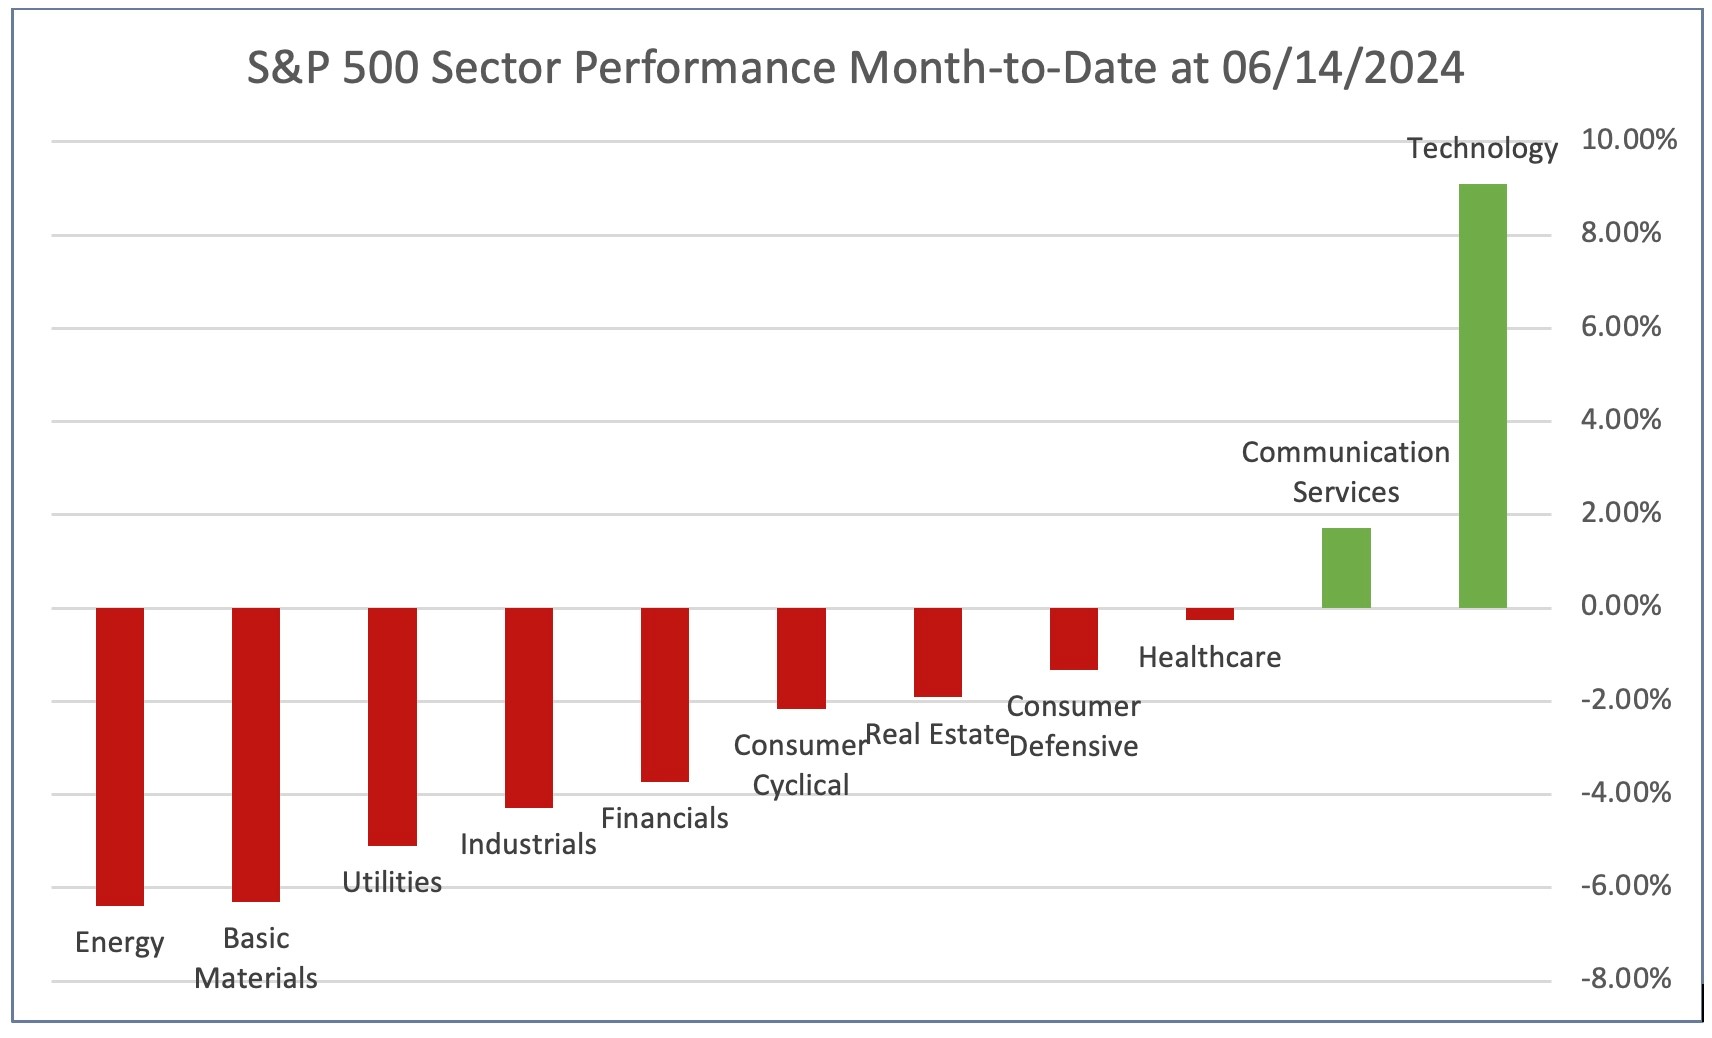 Chart by CIG Asset Management using data from FinViz
Large market-cap out performance. The S&P 500 index is weighted by market capitalization– that is, the larger the total value of the company, the higher the weighting in the index. It’s currently experiencing historic outperformance versus the equal-weighted S&P 500. In fact, while the S&P 500 – represented by the SPDR S&P 500 ETF Trust (SPY) has advanced +14.6% year-to date through 06/14/2024, the equal-weighted S&P 500 500 – represented by the Invesco S&P 500 Equal Weight ETF (RSP) is only up +4.2%. [iii] .
The following chart shows the relative performance of the market-cap weighted S&P 500 (SPY) versus the equal-weighted S&P 500 (RSP) for the 5-year period ending June 14, 2024. When the blue line is below 1.0, RSP is outperforming SPY. As you can clearly see, this has been a rarity over the past five years.
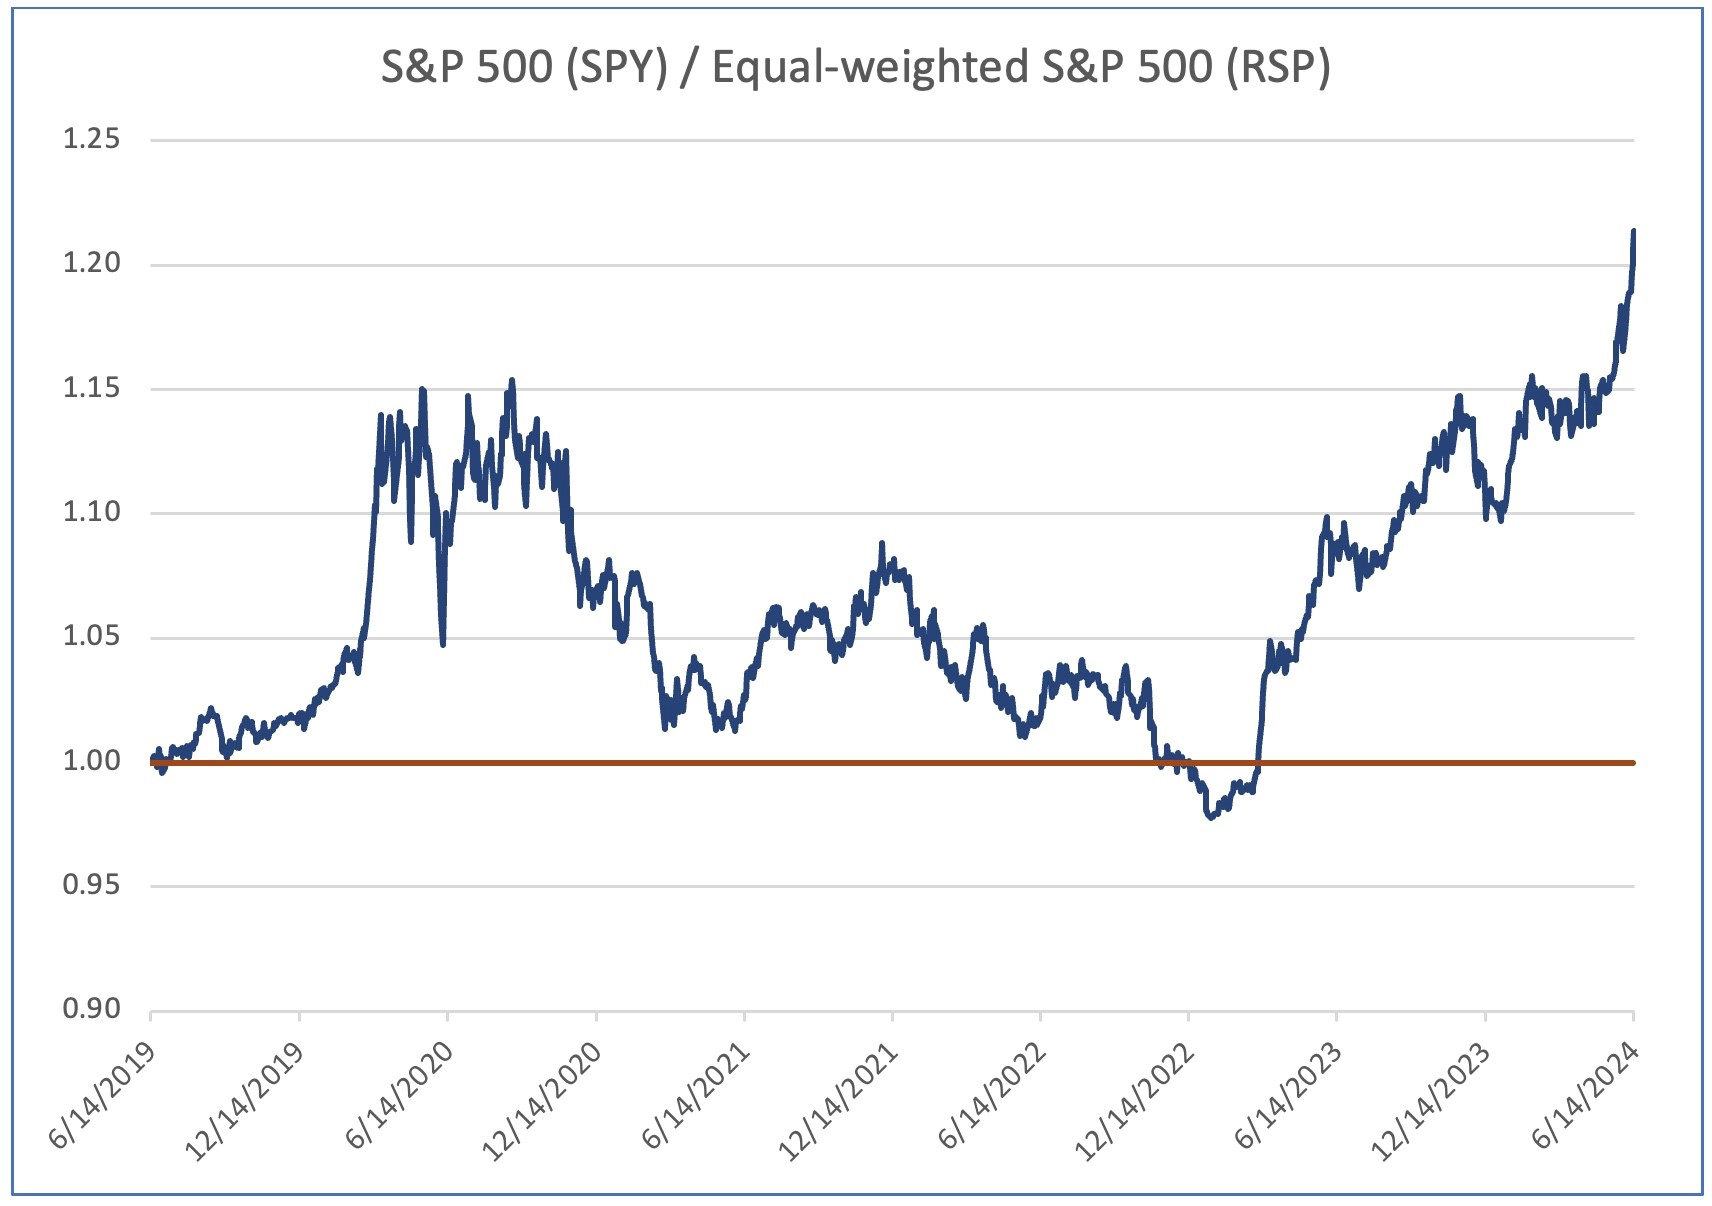 Chart by CIG Asset Management using data from Barchart.com.
The slope of the blue line has recently been increasing – this indicates that the outperformance is widening. This tells us that the larger companies are outperforming the smaller companies. What companies are outperforming? The answer is large-cap stocks in the technology sector, and we believe their returns are being driven by the hopes that Artificial Intelligence (AI) will contribute massive revenues and earnings to this sector.
S&P 500 index concentration. On June 9, 2024, Apollo Chief Economist Torsten Slok posted the following chart in The Daily Spark.
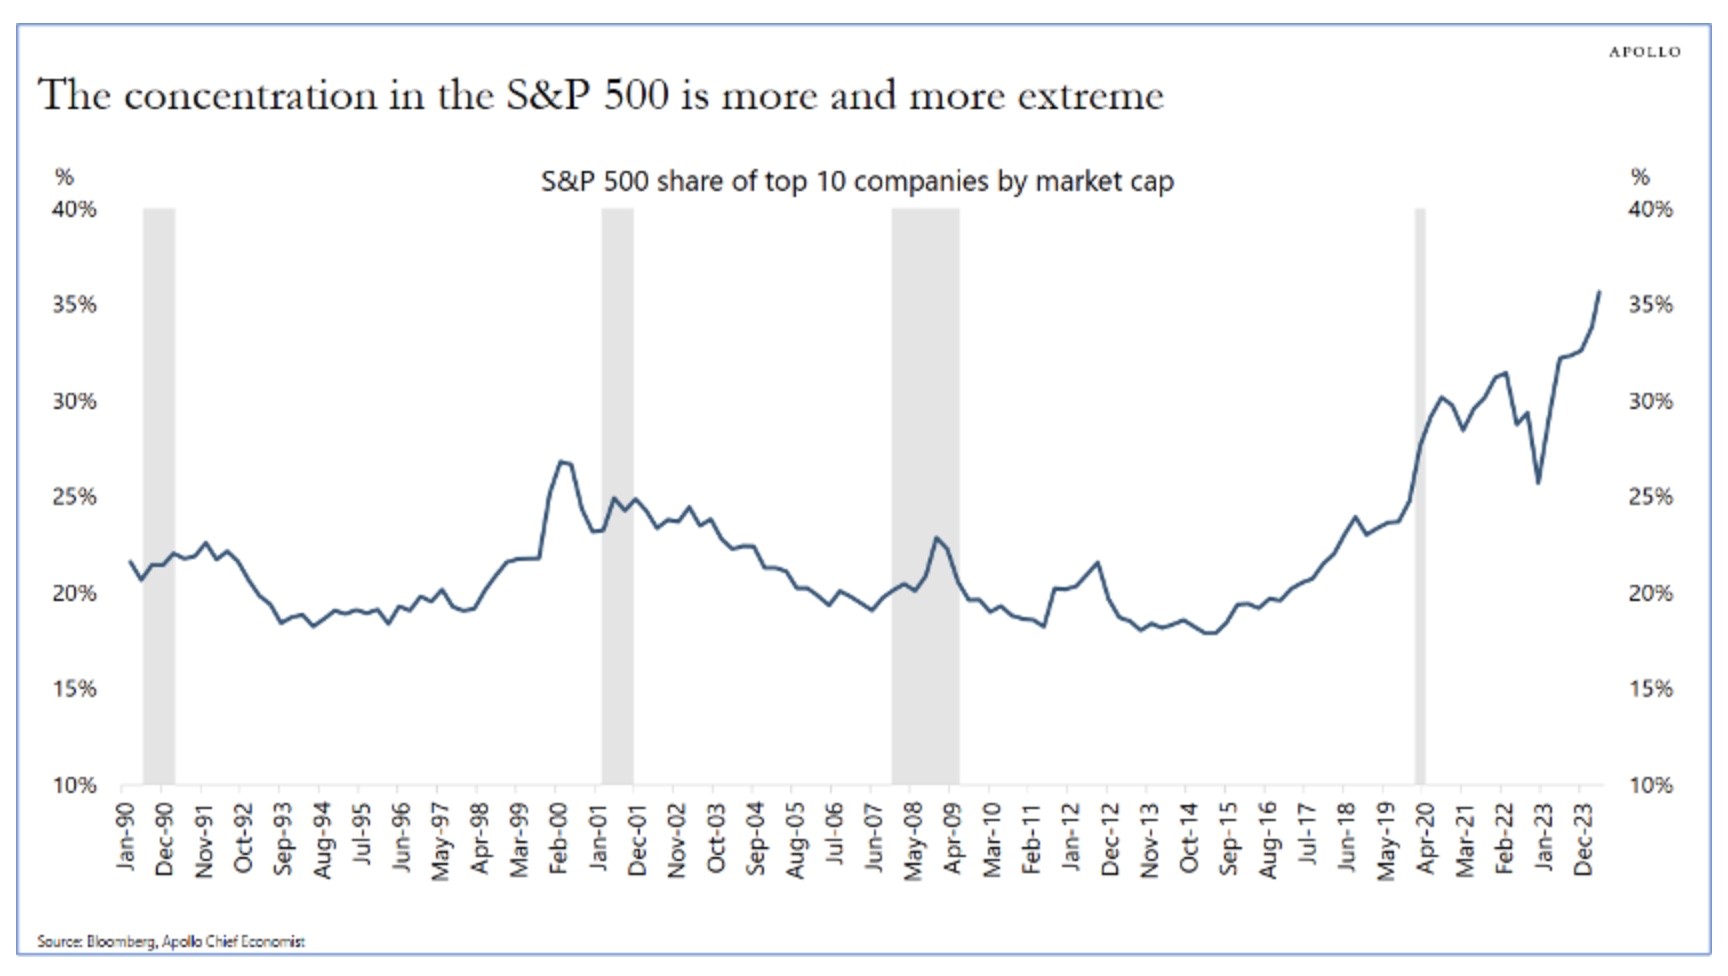 Source: Apollo The Daily Spark 06/09/2024
Currently, ten out of the 500 stocks in the S&P 500 account for over a third of its total value. These high-growth stocks have been major contributors to recent S&P 500 returns. Such extreme concentration is rare. Only three of those ten largest companies are outside of the Technology or Communications sectors: Berkshire Hathaway, Eli Lilly and JP Morgan. [iv] This is great when the top ten are moving higher and add excess returns to the market cap weighted S&P 500 index but can have the opposite effect if the hopes that AI will produce enormous profits for the companies involved does not prove to be true.
Growth versus Value. The following chart shows the ratio of the indexed returns of the Russell 1000 Growth Index and the Russell 1000 Value Index. The Russell 1000 Growth Index is currently outperforming the Russell 1000 Value Index by the biggest margin in decades! As of June 14, 2024, nine of the top ten stocks in the iShares Russell 1000 Growth ETF – which tracks the index – were technology related stocks and were a total of 53%, of the index. [v]
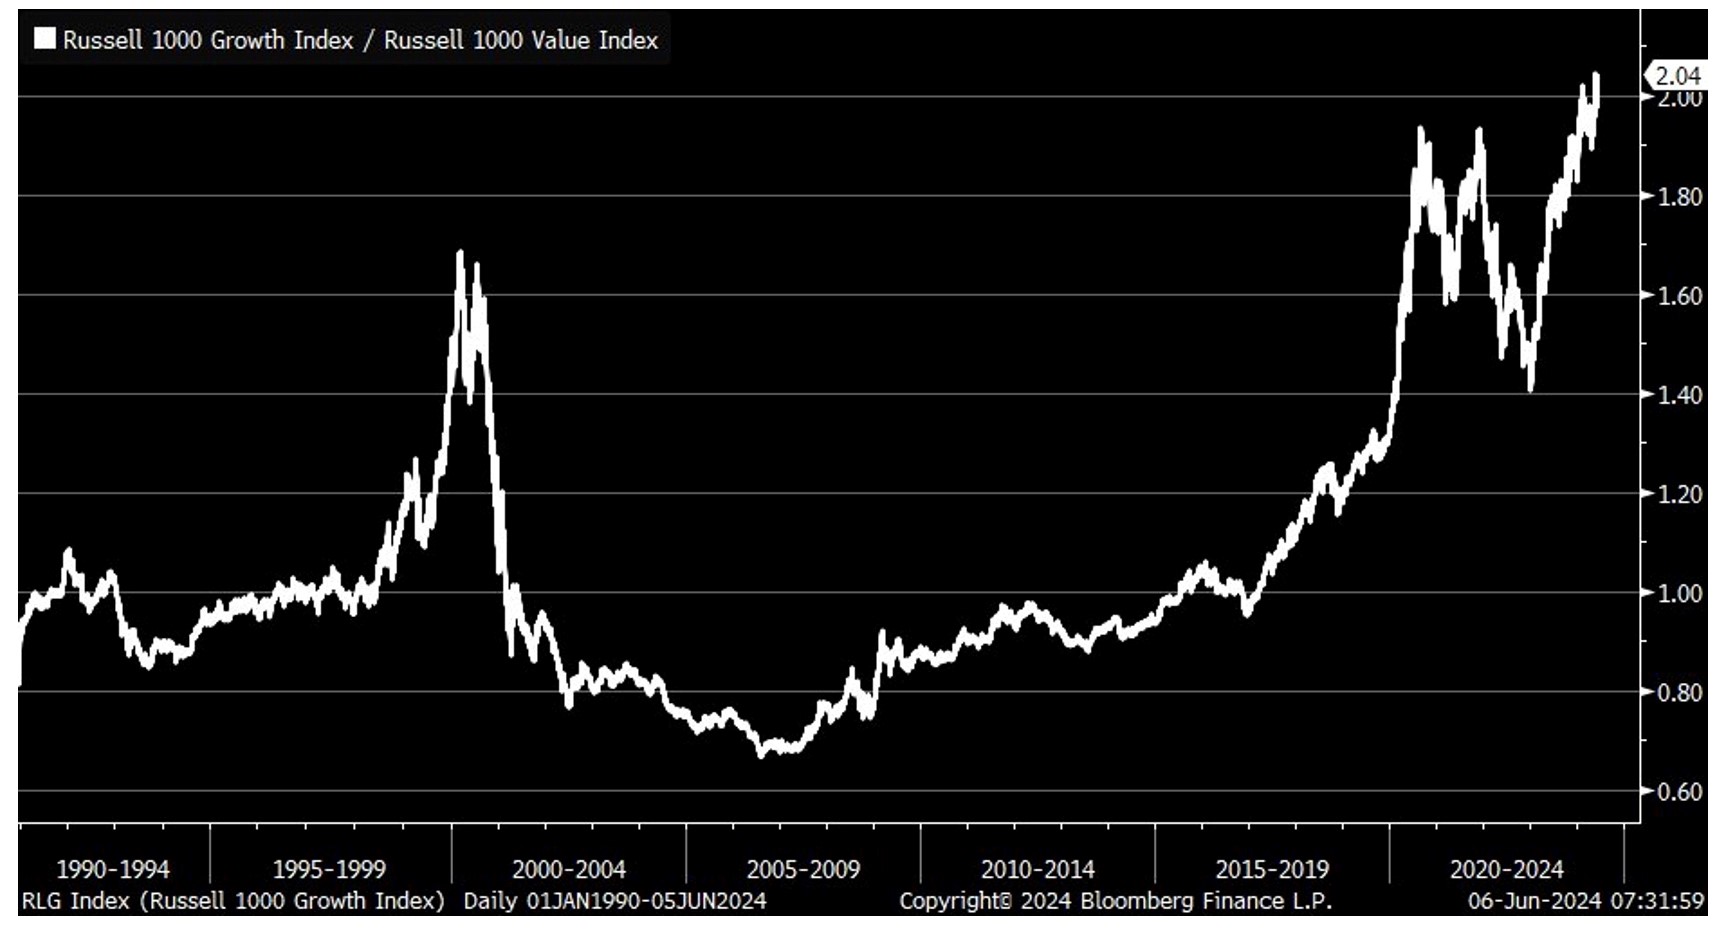 Source: Bloomberg 06/06/2024
1. Value may once again outperform growth. The significant spike in the year 2000 during the dot-com bubble serves as a historical reference. Right now, we’re witnessing another surge in large-cap technology stocks, which we attribute to an AI bubble. In 2000, after the dot-com bubble burst, value stocks outperformed growth stocks. We’ve strategically positioned our clients’ portfolios to potentially benefit from this trend if the AI bubble deflates.
2 Profit-Taking and Rebalancing: When a sector or set of stocks significantly outperforms, we consider taking profits and rebalancing client portfolios. This can be an attractive exit point. We will look for tax harvesting opportunities as well as we rebalance.
3. Buying Opportunities: Conversely, when a sector or set of stocks underperforms, it may present an opportune entry point. To take advantage of this opportunity, we look to add positions before a sector recovers.
4. Contrarian Approach: Small-cap stocks and value stocks, often overlooked during market extremes, might be particularly appealing to contrarian investors right now. Year-to-date through [June 14, 2024], the Russell 2000 index of small-cap stocks is down -1.0%. [vi]
In navigating these market dynamics, we recognize that extremes can create opportunities. Whether it’s profit-taking, rebalancing, or adopting a contrarian approach, staying informed and maintaining an active management strategy will be crucial. In doing so, we continue to manage diversified strategies for the long run.
Please reach out to Brian Lasher (blasher@cigcapitaladvisors.com), Eric T. Pratt (epratt@cigcapitaladvisors.com) or the rest of the CIG team.
[i] Calculated by CIG Asset Management using data from finance.yahoo.com
[ii] Calculated by CIG Asset Management using data from finance.yahoo.com
[iii] Calculated by CIG Asset Management using data from finance.yahoo.com
[iv] Calculated by CIG Asset Management using data from finance.yahoo.com
[v] https://www.ishares.com/us/products/239706/ishares-russell-1000-growth-etf
[vi] Calculated by CIG Asset Management using data from finance.yahoo.com

CIG Asset Management Update: The Stock Market Rally May Be Broadening
In October 2023, we shared the CIG Asset Management Update: Year-to-Date U.S. Stock Performance in Pictures and we discussed how the Magnificent 7[i], seven mega-cap growth stocks, were driving the returns of the S&P 500.
This outperformance continued through year end as you can see in the December 31, 2023 FinViz heat map below.
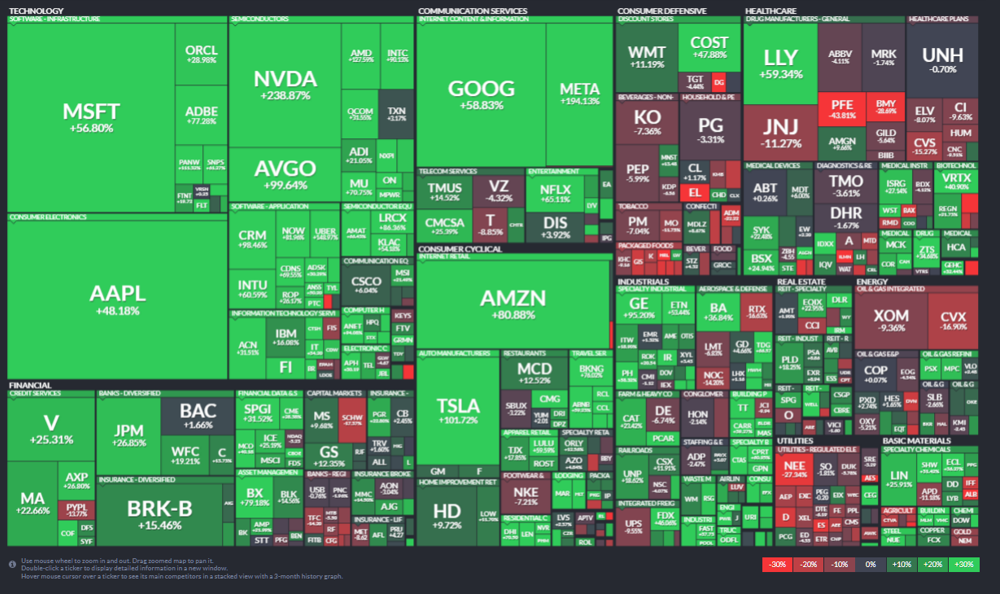
Source: FinViz as of 12/31/2023
In the year, 2023, the Magnificent 7 stocks experienced an average return of +111% while the S&P 500 Index only gained +26%. The Equal-Weighted S&P 500 Index only gained +12%. If you removed the Magnificent 7 stocks from the Equal-Weighted S&P 500 Index, you would have only gained +8%. [ii]
The strong performance of the Magnificent 7 stocks has extended into 2024. As of February 29, 2024, these seven stocks have gained +12.7%, outpacing the S&P 500’s increase of +7.1% and the Equal-Weighted S&P 500 Index’s gain of +3.2%.[iii]
We believe the Magnificent 7 stocks are currently trading at levels considered expensive compared to historical standards. Torsten Slok, Apollo’s Chief Economist, has recently showed that when you compare the median 12-month forward price-to-earnings (PE) ratio of the top ten companies in the S&P 500, which include all of the Magnificent 7 stocks, they are much more expensive now than they were during the tech bubble of the 1990s. [iv]
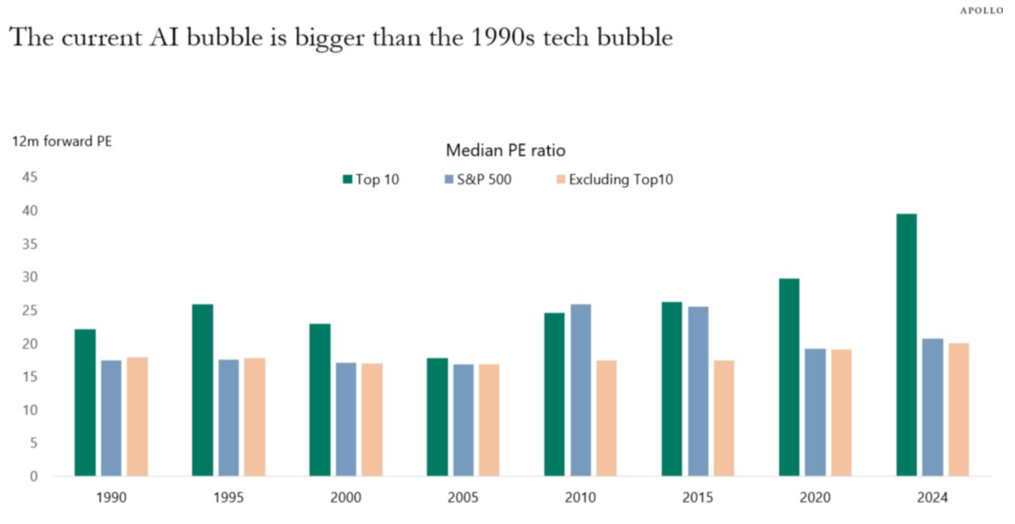
Source:Bloomberg, Apollo Chief Economist. Note: Data as of January 31, 2024.
With that being said, we are seeing some encouraging signs that the stock market rally may finally be starting to broaden out. For the week ended 3/6/2024, we saw four of the Magnificent 7 stocks; Microsoft (MSFT), Apple (AAPL), Alphabet (GOOG), and Tesla (TSLA) move lower as many other stocks outside of the technology sector rose. You can see this in the March 6, 2024 FinViz heat-map below.
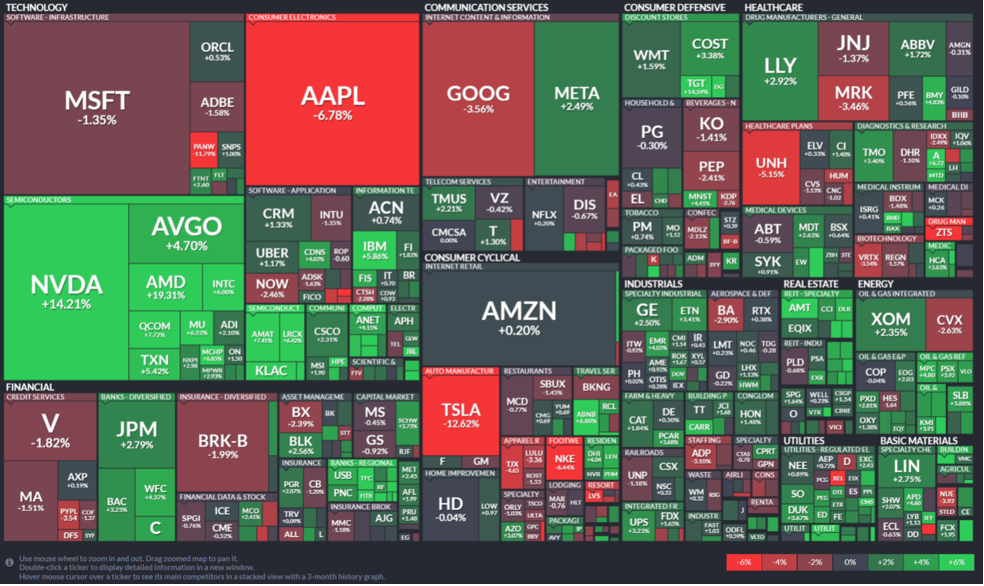
Source: FinViz as of 3/6/2024
While we find it encouraging to see a wider equity market participation, we still believe strongly in the value of diversification. Diversification is not supposed to maximize returns, it is designed to reduce investment risk. A diversified portfolio at times won’t keep up with the market when the bulk of returns are concentrated in a small group of stocks like the Magnificent 7. We strive to diversify our investments amongst industries and sectors, size (large-cap and small-cap), geography, growth versus value and alternative asset classes. Some of these investments are negatively correlated to the stock market – what that means is historically when the stock market traded lower – these investments gained in value. Past performance is not a guarantee of future results, but history helps guide us.
At CIG, we believe in risk-balanced investing. We believe investors should consider how much risk they are taking to achieve returns. We think that we should be striving to reach the return necessary to meet the various needs of our client’s financial plans while, at this point in the market cycle, taking as little risk as possible to meet that goal. We want you to sleep at night.
Please reach out to Brian Lasher (blasher@cigcapitaladvisors.com), Eric T. Pratt (epratt@cigcapitaladvisors.com) or the rest of the CIG team.
This report was prepared by CIG Asset Management and reflects the current opinion of the authors. It is based upon sources and data believed to be accurate and reliable. Opinions and forward-looking statements expressed are subject to change without notice. This information does not constitute a solicitation or an offer to buy or sell any security.
[i] The Magnificent 7 stocks are: Apple (AAPL), Microsoft (MSFT), Alphabet (GOOGL), Amazon.com (AMZN), Nvidia (NVDA), Tesla (TSLA), and Meta Platforms (META)
[ii] https://www.forbes.com/sites/greatspeculations/2024/01/22/2023-in-review/?sh=78aab8bd690b
[iii] Calculated by CIG Asset Management for the Roundhill Magnificent Seven ETF (MAGS) using data from finance.yahoo.com
[iv] The Daily Spark, February 25, 2024 – Apollo Academy

CIG Asset Management Update: Technology Bubble 2.0?
Commentary:
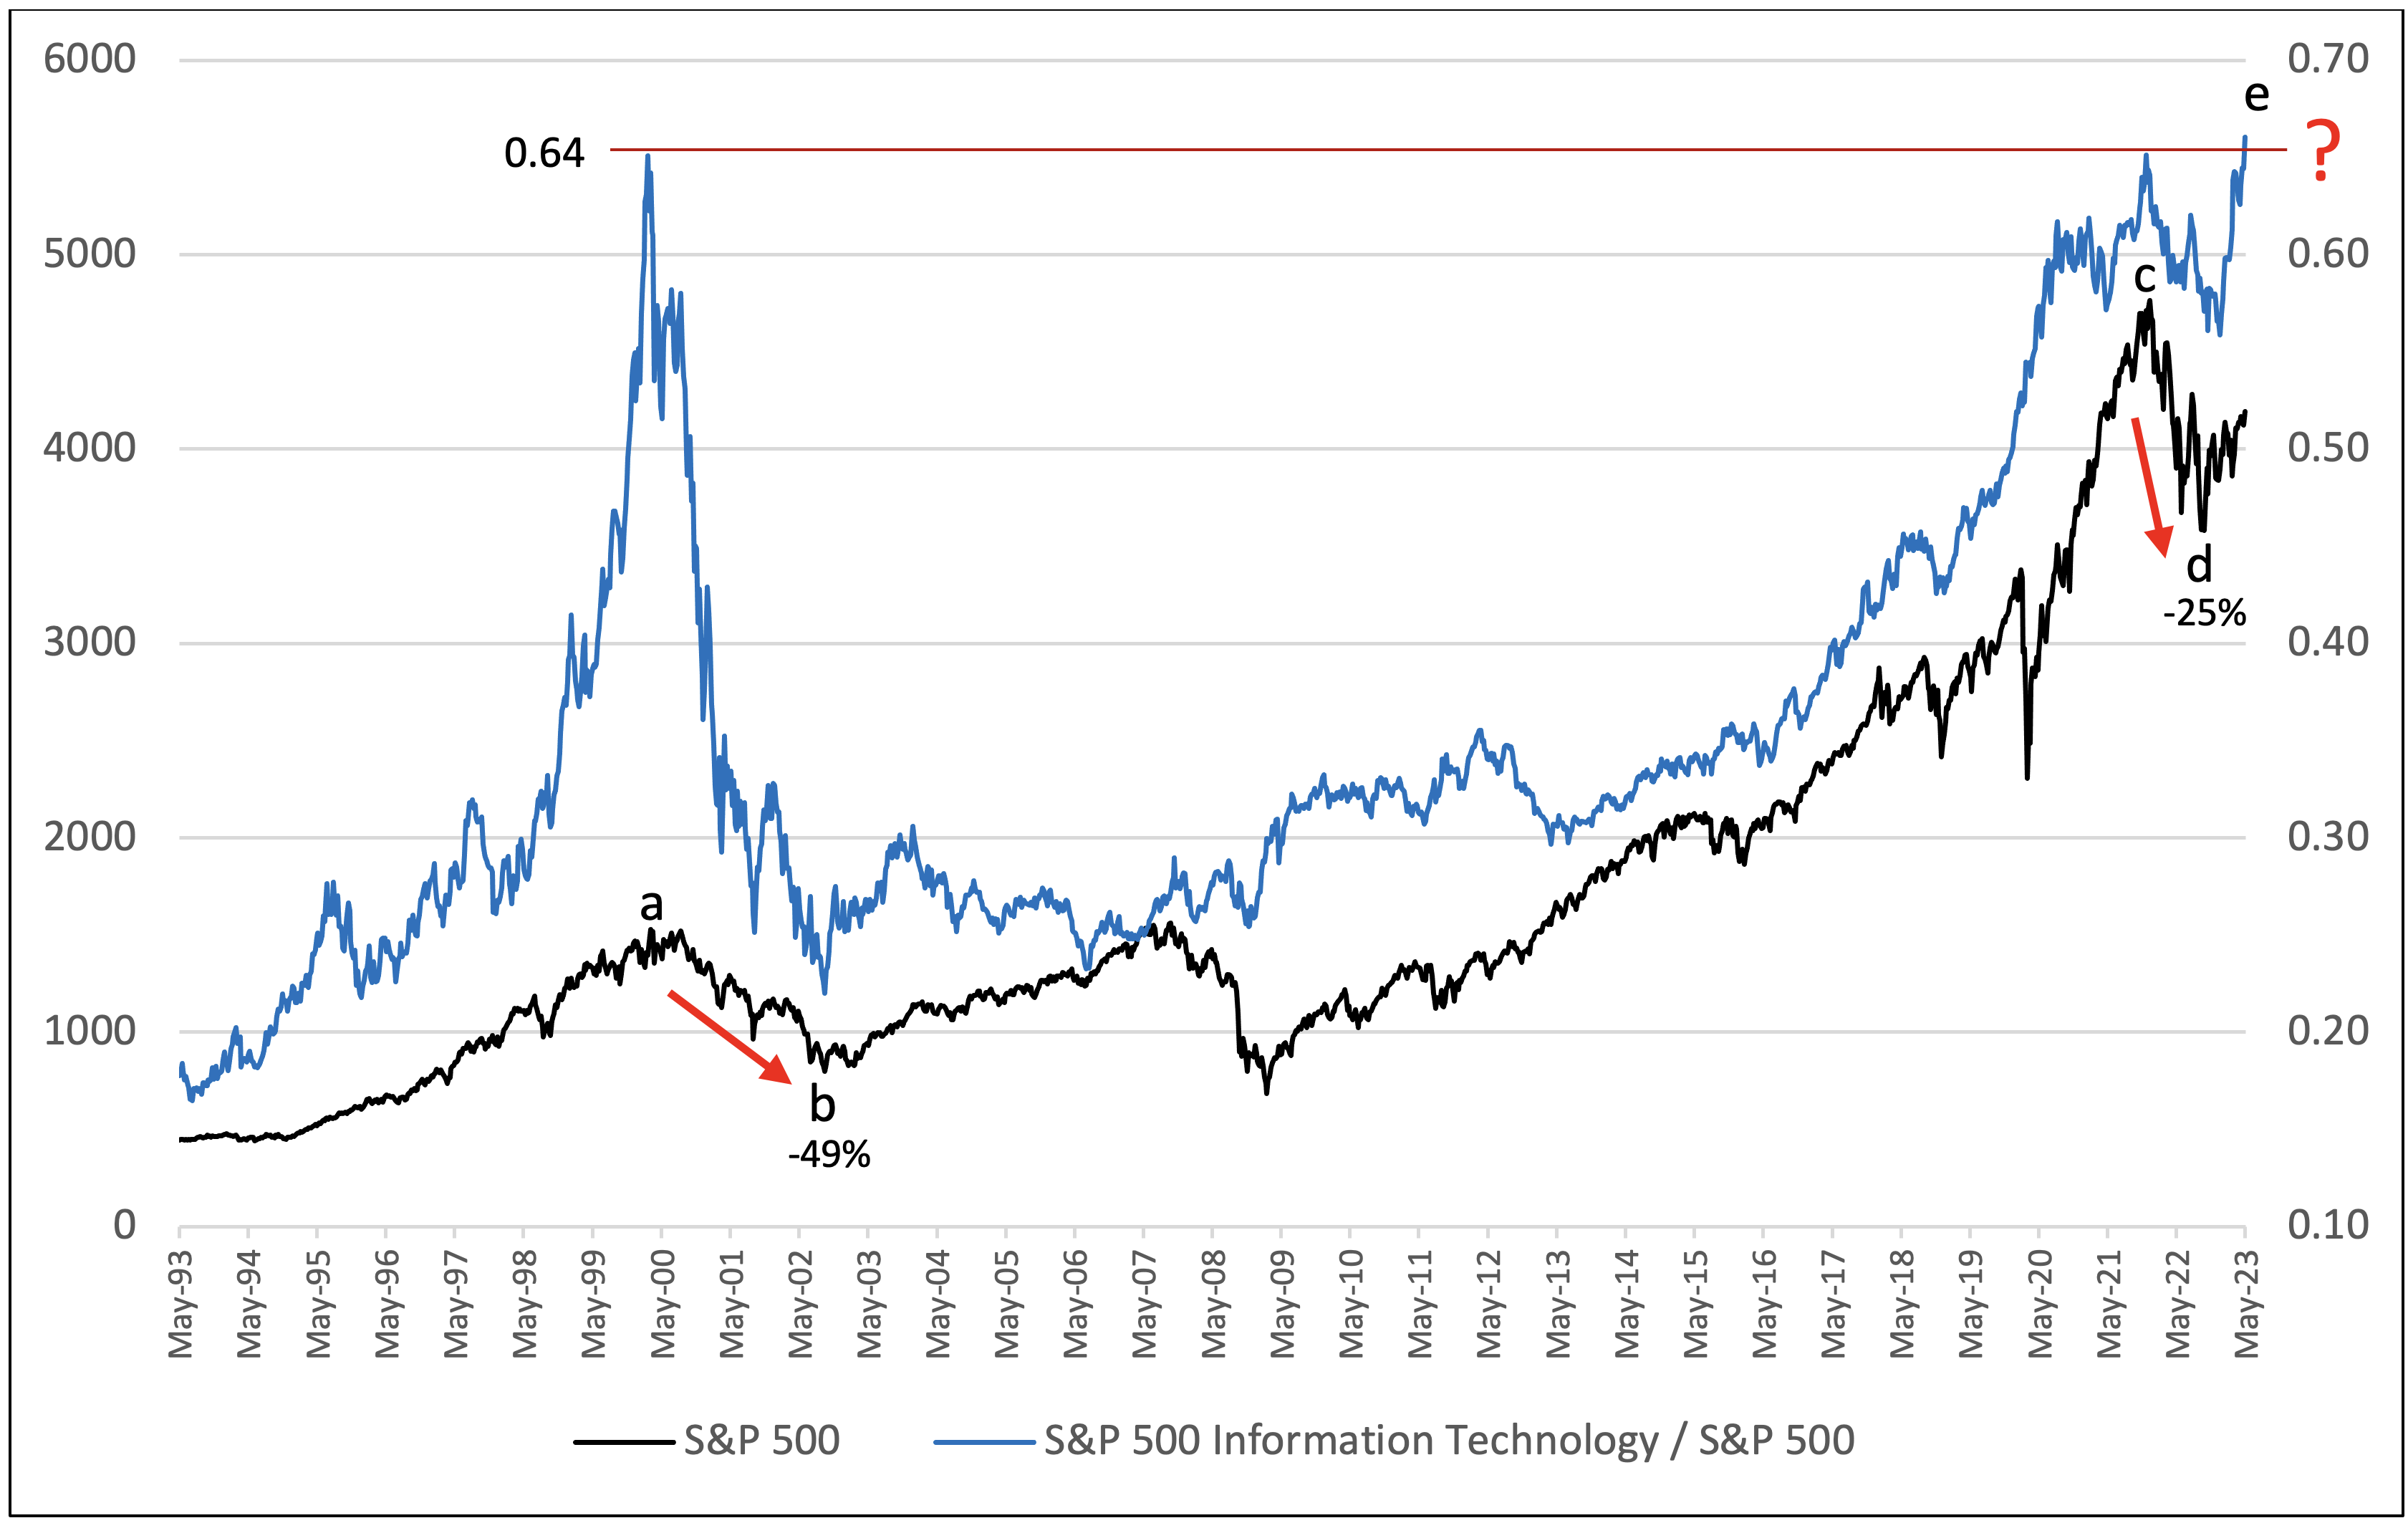
The performance ratio of the S&P 500 Information Technology Sector to the S&P 500[i] (the blue line on the above chart) has hit an all-time high of 0.66. The ratio’s previous all-time high was set in March 2000 at 0.64. As we previously discussed in What If the Bubble Bursts?, from March 27, 2000 (a) to October 9, 2002 (b) the S&P 500 (black line) fell -49% and then it took over 7 years to recover its losses after the peak. This same ratio hit 0.64 again on December 27, 2021 (c) and was followed by a -25% drawdown in the S&P 500 through October 10, 2022. (d) Now, as of May 15, 2023, this important ratio has hit a new all-time high of 0.66. (e)[ii] Will history repeat? Are we currently in a second massive technology bubble? No one knows for sure – but we are very cautious.
The rally thus far year-to-date has been narrow and concentrated in a few names. Six S&P 500 stocks – Apple, Microsoft, Nvidia, Alphabet, Amazon, and Meta – have contributed 90% of the gains of the overall index year-to-date through May 18, 2023.[iii] Five of these stocks are working on incorporating artificial intelligence (A.I.) into their business models and product offerings. While A.I. could be disruptive in the long run, the euphoria in anything A.I.-related reminds us of 1999, when many of the dot-com stocks soared in value with the internet as we know it now was still in its infancy.
Consequently, we continue to attempt to optimize our client’s exposure to the information technology sector in our pursuit of navigating our clients’ investments through these potentially turbulent market conditions. It is impossible to predict where these developments will lead, of course, but periods of upheaval can create opportunities for transformative change. We stand ready to possibly increase our allocation to domestic equities should the market rally broaden out to other sectors that have not kept up with the mega-cap growth stocks that have led year-to-date thus far. If we experience a significant market drawdown, then great opportunities could exist in the market which we would endeavor to evaluate and potentially participate in.
While volatility has moved lower over the course of 2023[iv], we do not expect that to persist for the remainder of the year. Therefore, we continue to stay the course of risk-balanced investing. We remain focused on striking the right aggressiveness versus defensiveness in client portfolios given the evolving uncertainty in the markets, the economy, and geopolitics.
Please reach out to Brian Lasher (BLasher@cigcapitaladvisors.com), Eric T. Pratt (EPratt@cigcapitaladvisors.com) or the rest of the CIG team if you have any questions.

CIG Asset Management Update: Are We Experiencing Another “Bear Market Rally”?
Commentary:
Domestic stocks bounced in October, with the S&P 500 gaining +8.1% after September’s -9.2% drawdown.[ix] Fixed income lost -1.3% as measured by the Bloomberg U.S. Aggregate Index.[x] International Equities in developed markets gained +5.4%[xi], while Emerging Market Equities lost -3.1%.[xii]
We believe it is important to zoom out to gain a greater perspective and look at the journey the stock market, as measured by the S&P 500, has taken since early-2020 through to early-November 2022, focusing on several timeframes in the chart below. The market was at an all-time high in February 2020, (A), just before Covid-19 lockdowns shook the global economy. The market then fell 33% until it bottomed out on March 23, 2020, (B). The market then steadily rallied to a new all-time high from the Covid-19 low to January 3, 2022, (C), as central banks worldwide intervened and provided massive liquidity through quantitative easing and low interest rates. Ever since the market hit its all-time high in early-January of this year, it has traded in a channel of successively lower highs and lower lows.[xiii]
Is it possible we are currently experiencing the third Bear Market rally since the all-time high in January 2022? Bear Market rallies have been defined as significant counter trend recoveries that can last as briefly as a few weeks to as long as several months before the market reverses course to a new low. The chart below serves to illustrate the concept of a Bear Market rally.
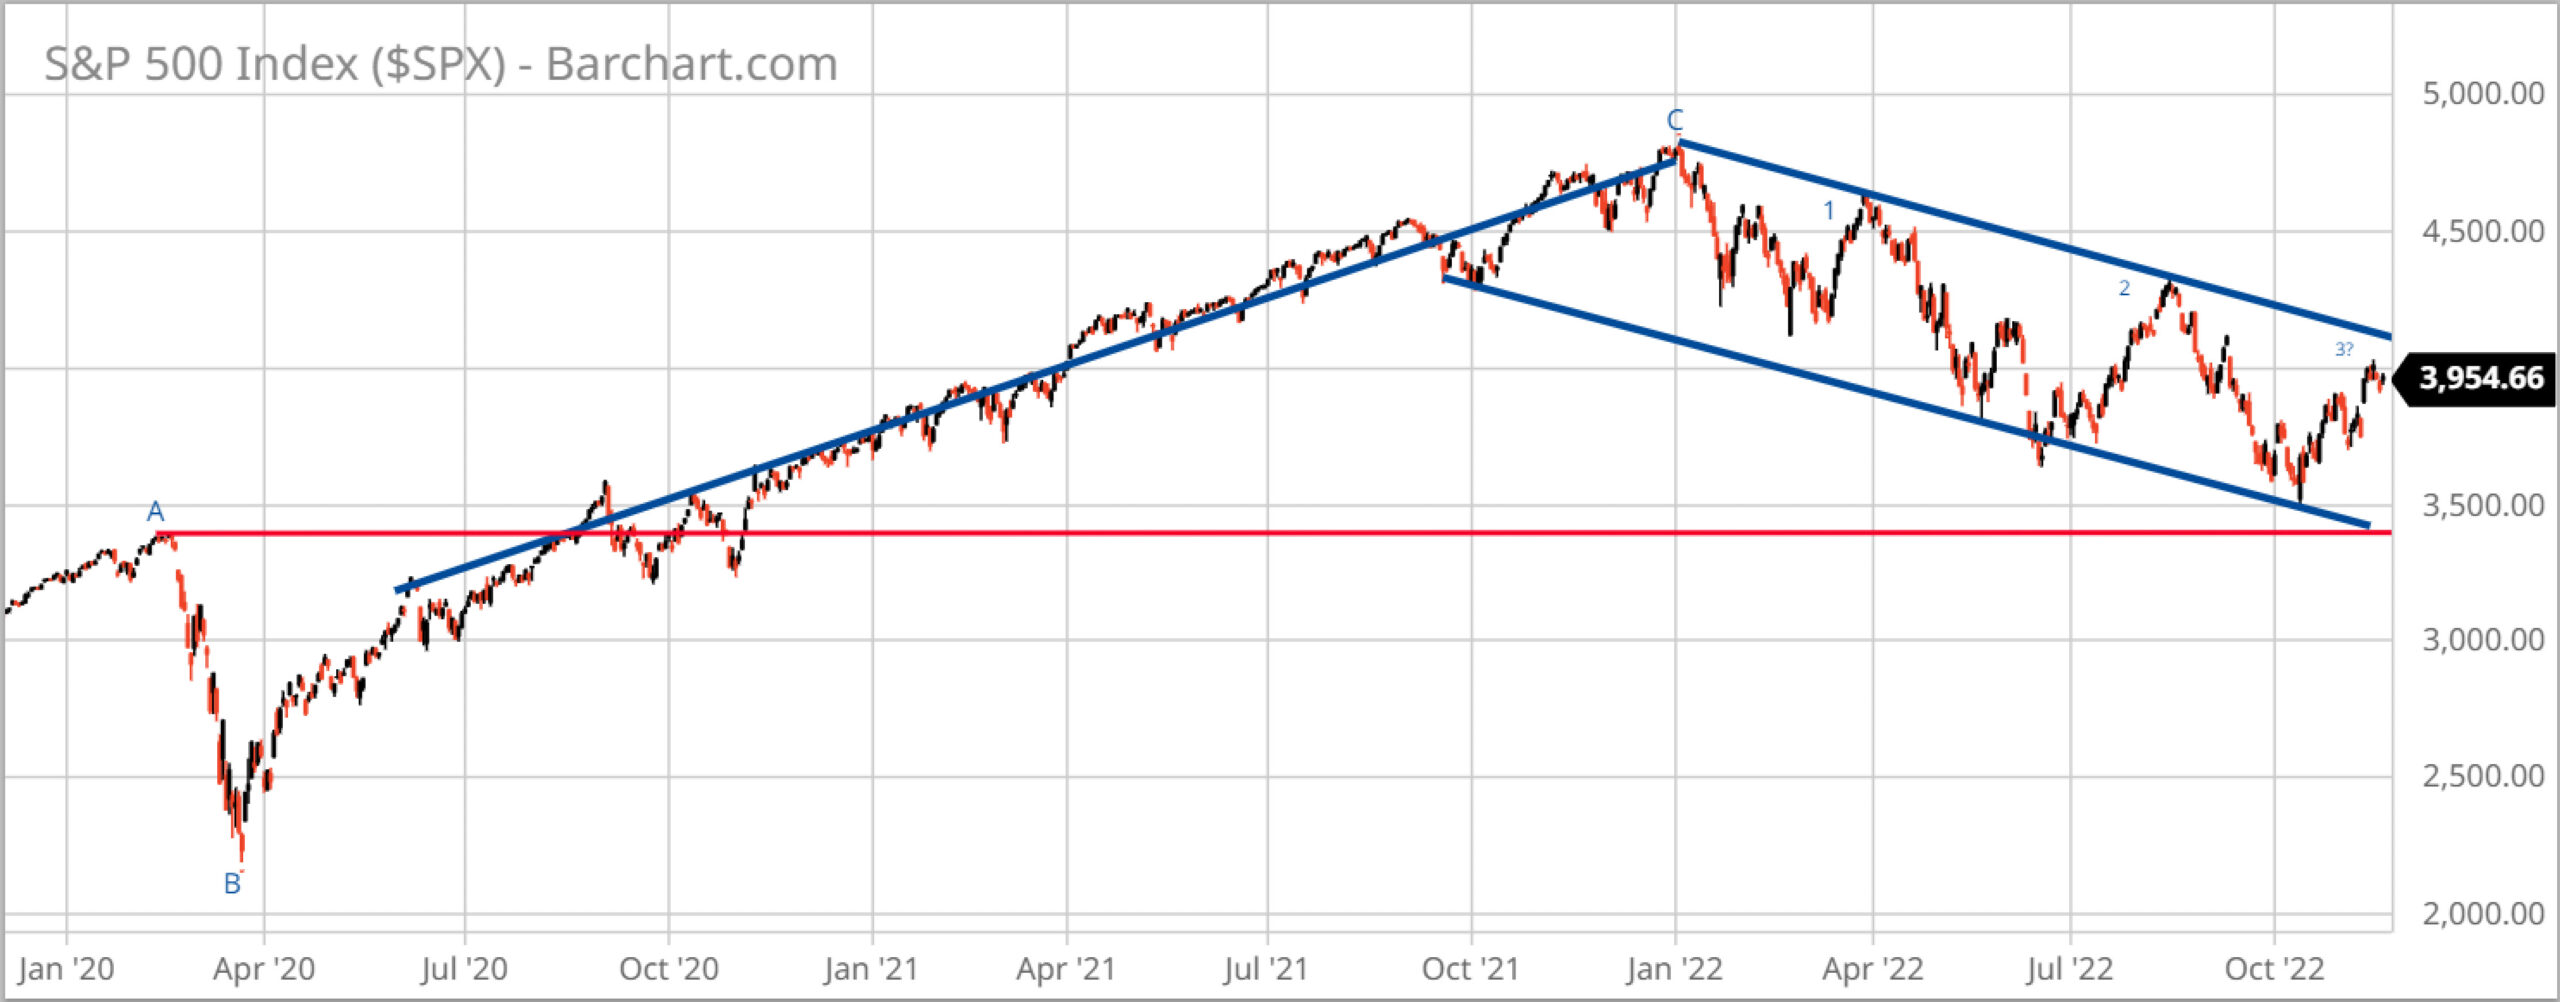 Source: Barchart.com
While we are encouraged by the stock market’s resilience seen from October into early-November, equities are historically expensive. The total market capitalization of U.S. stocks currently is 153% of U.S. gross domestic product (GDP), almost the same level as the 157% dot-com peak in March 2000, which was right before that bubble burst.[xiv] One overvalued stock, for example, is Apple, Inc. (AAPL). Apple’s stock soared +8% after it reported its recent quarterly earnings results as being slightly better than expected. Apple beat Wall Street analysts’ earnings expectations because of its iMac sales while both its services and iPhone sales disappointed. Apple CEO Tim Cook explained that “silicon-related wafer supply constraints were not significant in the quarter” (microchip shortages ended), and it allowed the company to satisfy back orders and “fill the channel” at resellers and retailers. Between 2008 and 2016, Apple’s price-to-earnings ratio was in a range of 10 to 17 and its compounded annual earnings per share growth rate over that same period was 30%.[xv] Now, it trades at more than 24 times earnings, with analysts expecting only 3% growth in 2023![xvi] Many other technology stocks are similarly overvalued on a historic basis.
We reduced exposure to technology stocks in October in our actively managed strategies before earnings were announced and just recently added back technology exposure in three targeted areas that are all down significantly from their highs: cloud computing, semiconductors, and cyber security.
Year-to-date (through to 10/31/2022), our CIG Dynamic Growth Strategy composite has avoided approximately 44% of the losses of the growth benchmark, and the CIG Dynamic Balanced Strategy has avoided approximately 59% of the losses of the balanced benchmark.[xvii]
We would welcome the opportunity to engage with you — via voice or email — to discuss your questions, and market challenges and opportunities, as well as the benefits of active investment management.