
VIP: CIG Asset Management Update: “Don’t Fight the Fed”
Commentary:
Domestic stocks continued October’s gains with the S&P 500 gaining +5.2% in November.[ix] Fixed income advanced +3.7% as measured by the Bloomberg U.S. Aggregate Index[x], as the yield on the 10-Year U.S. Treasury bonds fell -0.37% to 3.70% on November 30.[xi] Gold gained +6.7%[xii], International Equities in developed markets gained +11.3%[xiii], and Emerging Market Equities soared +14.8%[xiv], as the U.S. Dollar Index fell -4.9%.
Equities have benefited over the past two months from longer-term interest rates, as measured by the yield on the 10-Year U.S. Treasury bond, falling from their recent peak of 4.33% on October 20, to 3.41% on December 7.[xv] Investors appear to be encouraged by the September and October Consumer Price Index (CPI) reports that showed the rate of inflation has decelerated on a month-over-month basis (i.e., CPI was 8.2% in September and 7.7% in October).[xvi] Despite CPI remaining at 7.7% over the past year[xvii], some feel that the Federal Reserve has already raised rates too much and will need to cut rates as early as next year to keep the economy out of a recession.
“Don’t fight the Fed”, coined in 1970 by Martin Zweig, a finance professor and famed investor, is a mantra that suggests investors should align their investments with the current monetary policies of the Federal Reserve; that not doing so imperils investors’ portfolios. On November 30, Federal Reserve Chairman Jerome Powell spoke at the Hutchins Center on Fiscal and Monetary Policy, Brookings Institution, in Washington, D.C. In his speech, Powell noted, “It makes sense to moderate the pace of our rate increases as we approach the level of restraint that will be sufficient to bring inflation down. The time for moderating the pace of rate increases may come as soon as the December meeting.” Powell continued, “The timing of that moderation is far less significant than the questions of how much further we will need to raise rates to control inflation, and the length of time it will be necessary to hold policy at a restrictive level. It is likely that restoring price stability will require holding policy at a restrictive level for some time.”[xviii]
Investors appear to be “fighting the Fed” as long-term bond yields continue to fall even as short-term rates like the Federal Funds Effective Rate (Fed Funds), an overnight interest rate, are moving higher. In a normal (or less abnormal) world, short-term debt has a lower yield than longer-term debt of the same quality (i.e., it costs more — the interest rate — to borrow for a longer time). On rare occasion, short-term debt has traded at higher yields than long-term debt — this is called an inverted yield curve. Even rarer is when the Fed Funds is at a higher yield than the 10-Year U.S. Treasury bond, which is what just occurred in November 2022.
Let’s explore what has happened after the Fed Funds Rate (blue line) exceeds the yield on a 10-year U.S. Treasury bond (red line), as shown in the following chart:
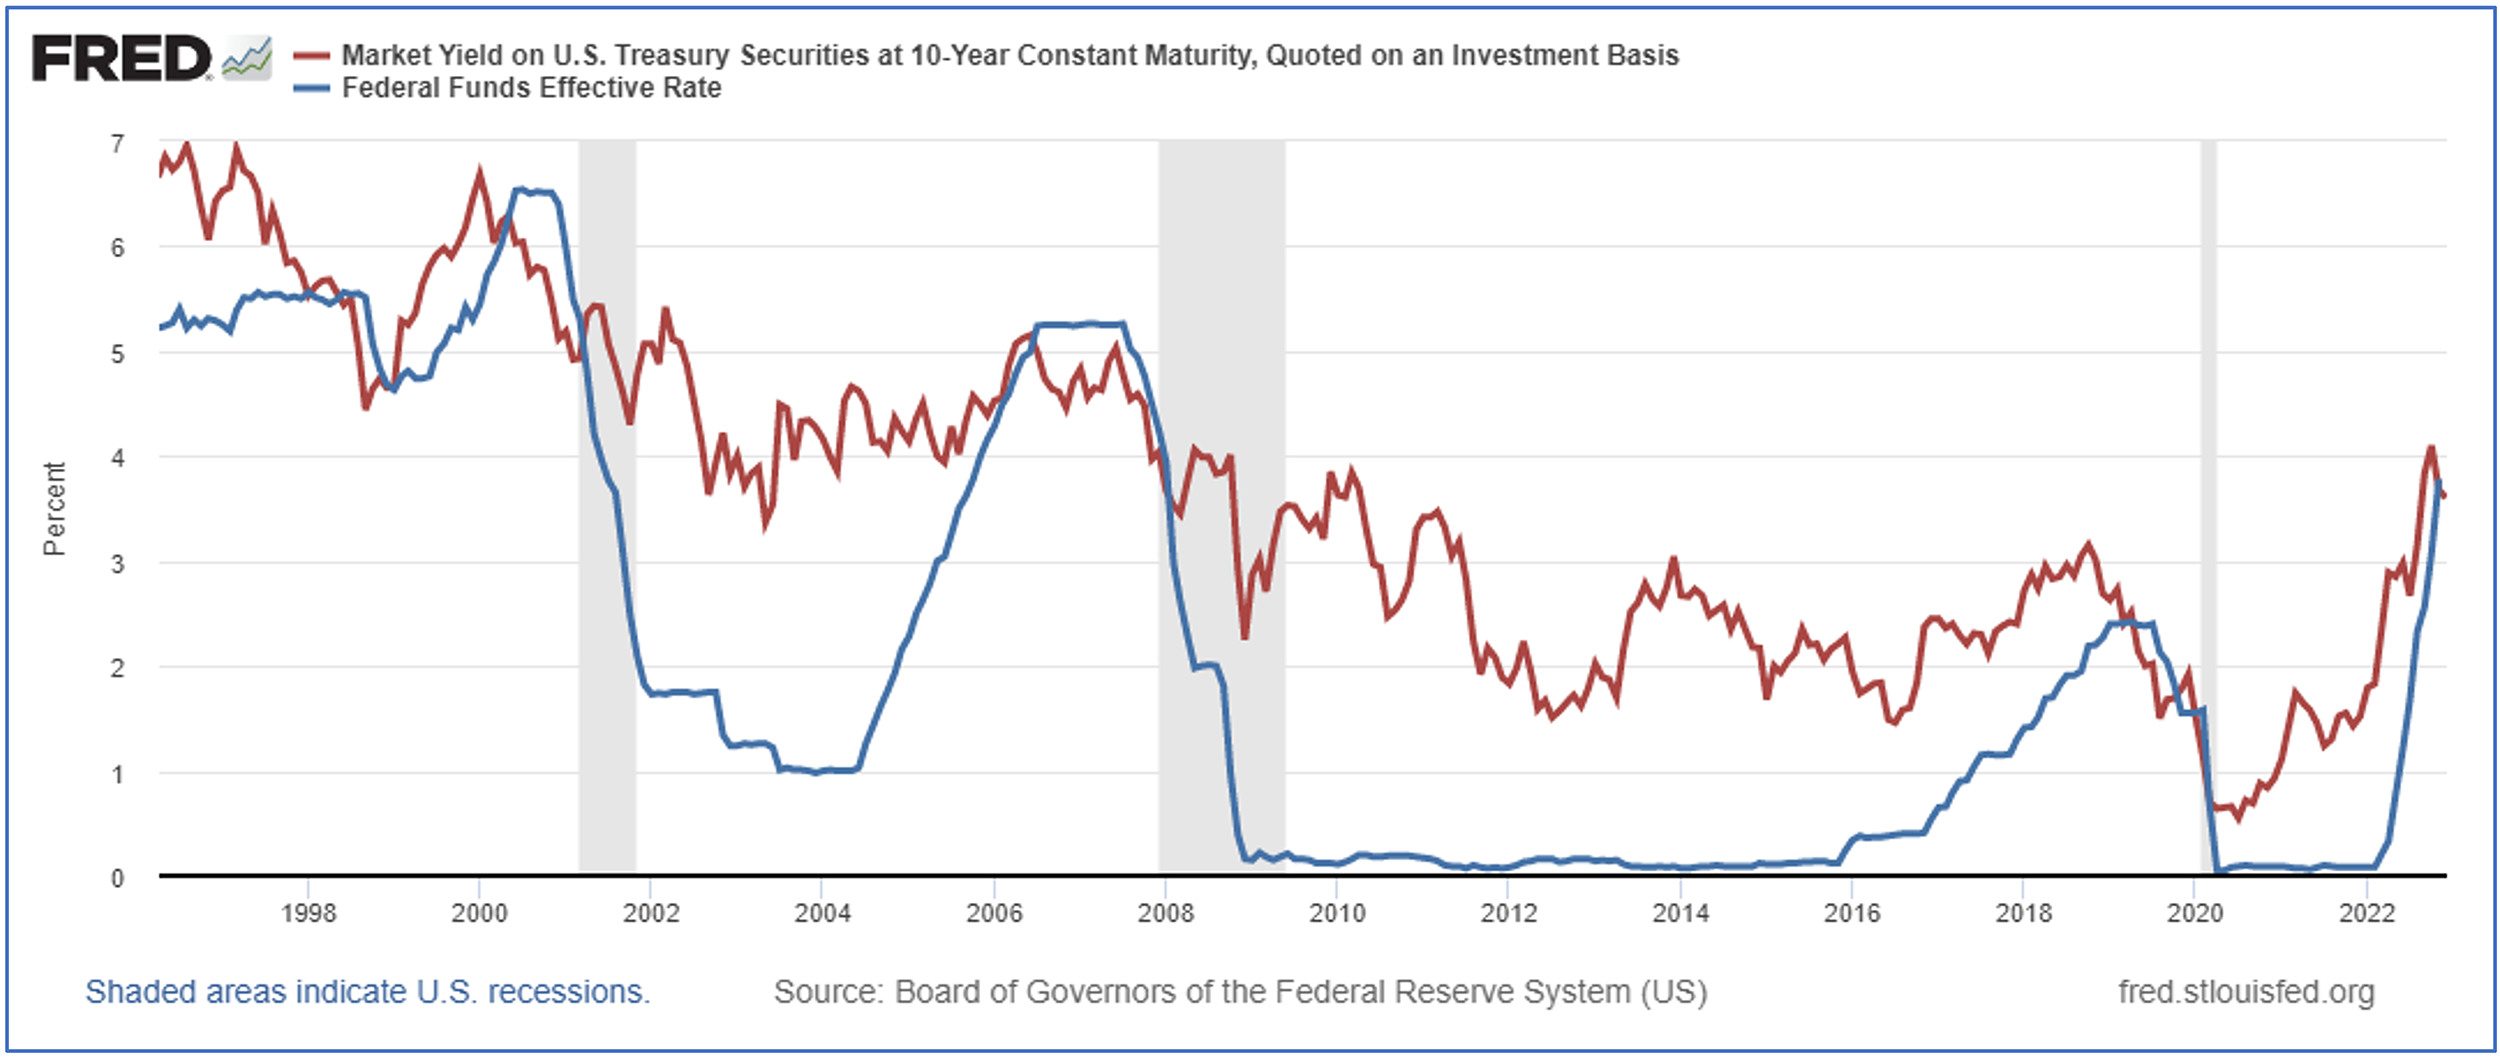 Source: fred.stlouisfed.org
- May 2000. Stocks traded lower for two years; the dot-com bubble burst; and the U.S. economy entered a recession.[xix]
- July 2006. A year later, Bear Stearns failed; the housing bubble began to burst; and the 2007-2008 Great Financial Crisis sent the U.S. economy into a deep recession.[xx]
- Spring 2019. A year later, COVID-19 shut down the word economy; stocks fell; and the U.S. economy entered a brief recession.[xxi]
Perhaps inflation will drop to the Federal Reserve’s 2% goal and they will be able to engineer a soft-landing for the economy. Perhaps not. Regardless, as illustrated in the above chart, be careful what you wish for: markets and the economy suffered initially each of the last three times the Fed started cutting rates.
As we maneuver through these difficult conditions, we continue to apply our disciplined approach to Asset Management. Our CIG Dynamic Growth Strategy composite was able to capture 85% of the upside of the growth benchmark during November 2022 while year-to-date through 11/30/2022, it has avoided approximately 57% of the losses of the growth benchmark. Our CIG Dynamic Balanced Strategy captured 79% of the upside of the balanced benchmark during November 2022 while year-to-date through 11/30/2022, it has avoided approximately 65% of the losses of the balanced benchmark.[xxii]
We would welcome the opportunity to connect with you via voice or email to discuss how active management could protect your portfolio and capture opportunities when other investors are “fighting the Fed”.


CIG Asset Management Update: Are We Experiencing Another “Bear Market Rally”?
Commentary:
Domestic stocks bounced in October, with the S&P 500 gaining +8.1% after September’s -9.2% drawdown.[ix] Fixed income lost -1.3% as measured by the Bloomberg U.S. Aggregate Index.[x] International Equities in developed markets gained +5.4%[xi], while Emerging Market Equities lost -3.1%.[xii]
We believe it is important to zoom out to gain a greater perspective and look at the journey the stock market, as measured by the S&P 500, has taken since early-2020 through to early-November 2022, focusing on several timeframes in the chart below. The market was at an all-time high in February 2020, (A), just before Covid-19 lockdowns shook the global economy. The market then fell 33% until it bottomed out on March 23, 2020, (B). The market then steadily rallied to a new all-time high from the Covid-19 low to January 3, 2022, (C), as central banks worldwide intervened and provided massive liquidity through quantitative easing and low interest rates. Ever since the market hit its all-time high in early-January of this year, it has traded in a channel of successively lower highs and lower lows.[xiii]
Is it possible we are currently experiencing the third Bear Market rally since the all-time high in January 2022? Bear Market rallies have been defined as significant counter trend recoveries that can last as briefly as a few weeks to as long as several months before the market reverses course to a new low. The chart below serves to illustrate the concept of a Bear Market rally.
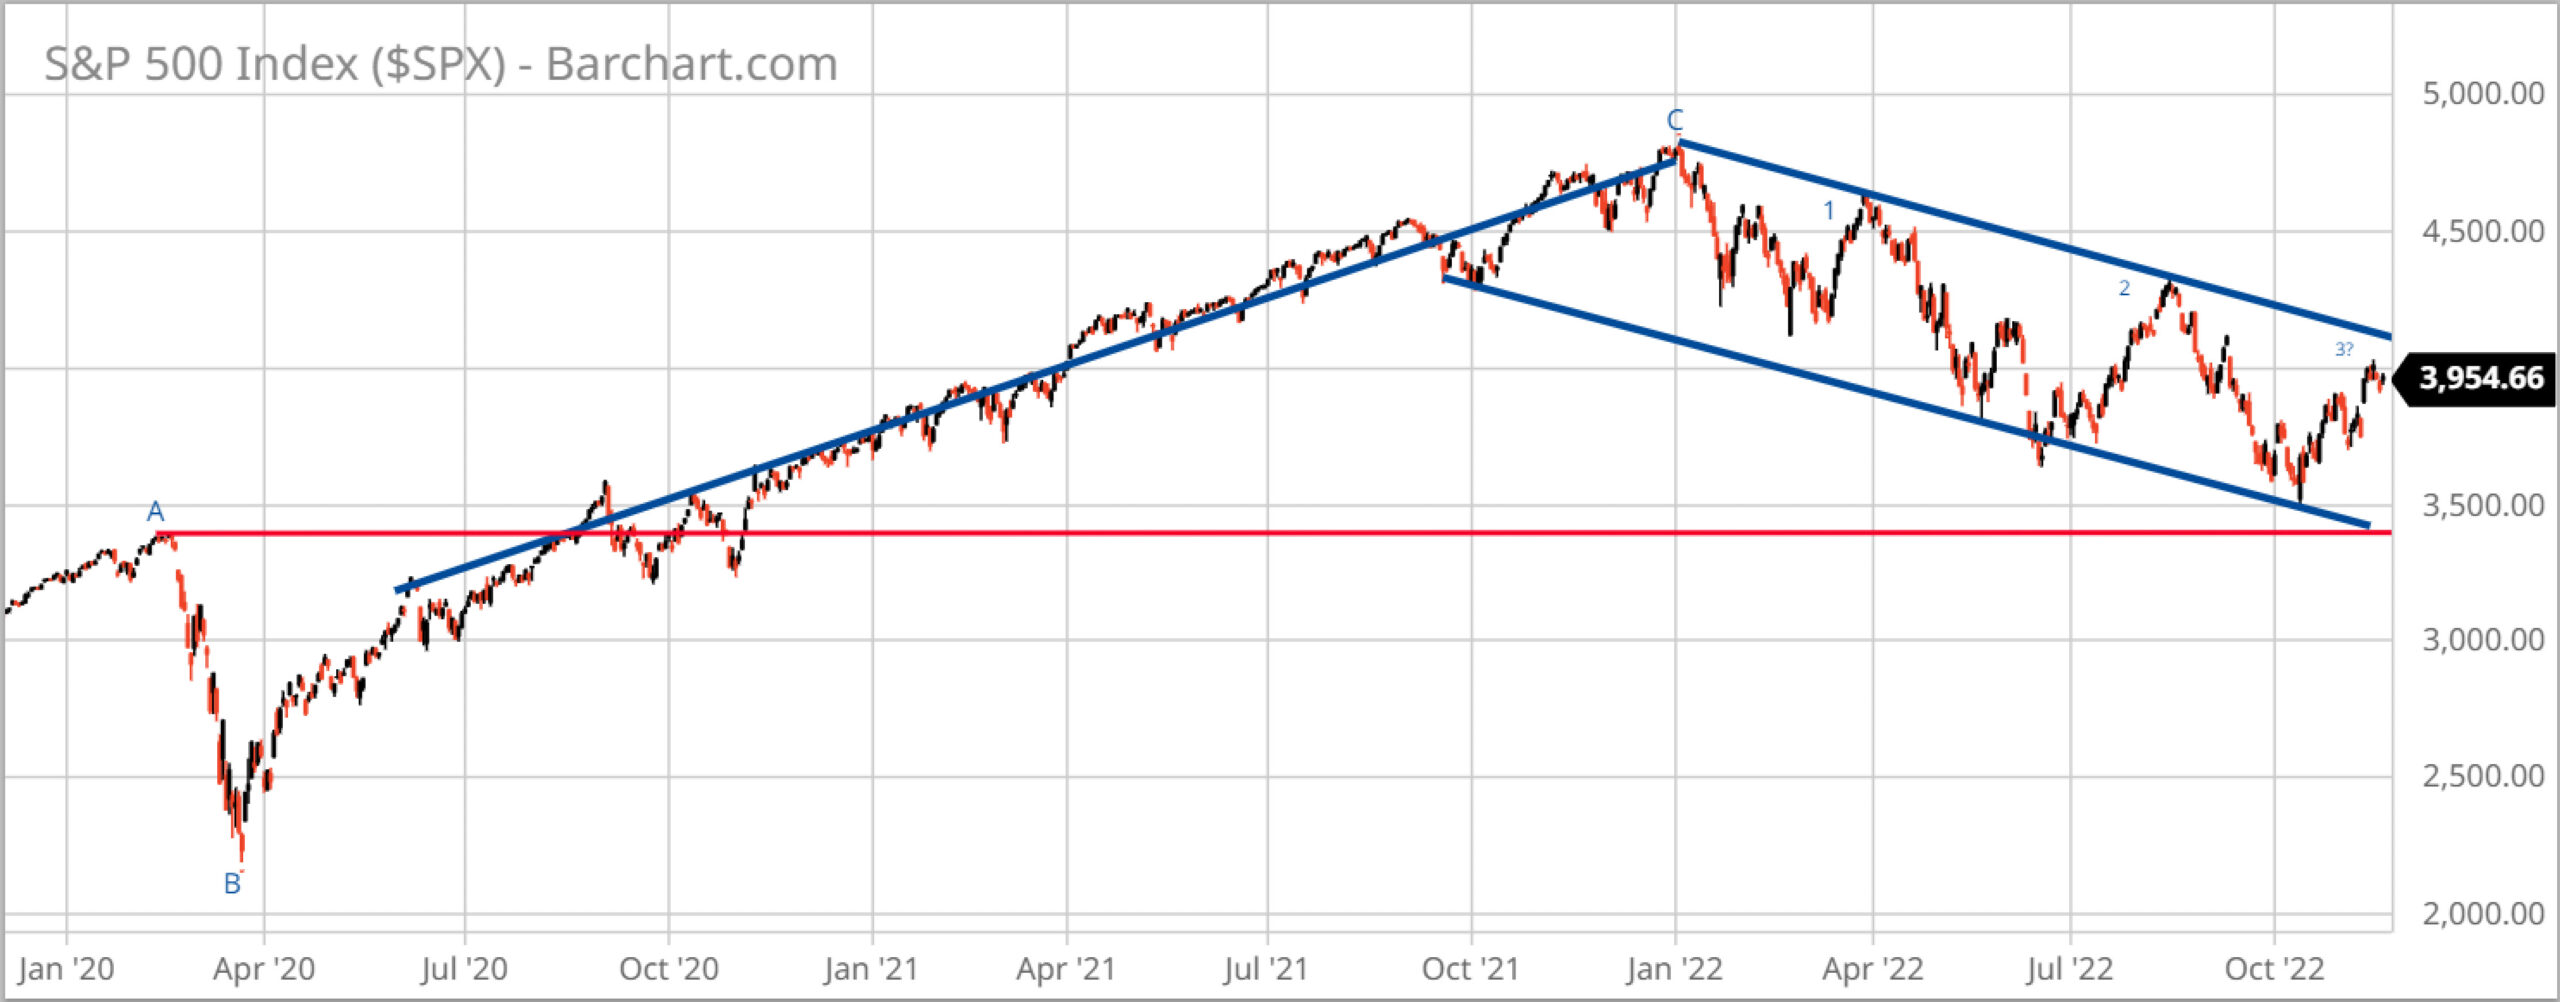 Source: Barchart.com
While we are encouraged by the stock market’s resilience seen from October into early-November, equities are historically expensive. The total market capitalization of U.S. stocks currently is 153% of U.S. gross domestic product (GDP), almost the same level as the 157% dot-com peak in March 2000, which was right before that bubble burst.[xiv] One overvalued stock, for example, is Apple, Inc. (AAPL). Apple’s stock soared +8% after it reported its recent quarterly earnings results as being slightly better than expected. Apple beat Wall Street analysts’ earnings expectations because of its iMac sales while both its services and iPhone sales disappointed. Apple CEO Tim Cook explained that “silicon-related wafer supply constraints were not significant in the quarter” (microchip shortages ended), and it allowed the company to satisfy back orders and “fill the channel” at resellers and retailers. Between 2008 and 2016, Apple’s price-to-earnings ratio was in a range of 10 to 17 and its compounded annual earnings per share growth rate over that same period was 30%.[xv] Now, it trades at more than 24 times earnings, with analysts expecting only 3% growth in 2023![xvi] Many other technology stocks are similarly overvalued on a historic basis.
We reduced exposure to technology stocks in October in our actively managed strategies before earnings were announced and just recently added back technology exposure in three targeted areas that are all down significantly from their highs: cloud computing, semiconductors, and cyber security.
Year-to-date (through to 10/31/2022), our CIG Dynamic Growth Strategy composite has avoided approximately 44% of the losses of the growth benchmark, and the CIG Dynamic Balanced Strategy has avoided approximately 59% of the losses of the balanced benchmark.[xvii]
We would welcome the opportunity to engage with you — via voice or email — to discuss your questions, and market challenges and opportunities, as well as the benefits of active investment management.
VIP: CIG Asset Management Update: Are We Experiencing Another “Bear Market Rally”?
Commentary:
Domestic stocks bounced in October, with the S&P 500 gaining +8.1% after September’s -9.2% drawdown.[ix] Fixed income lost -1.3% as measured by the Bloomberg U.S. Aggregate Index.[x] International Equities in developed markets gained +5.4%[xi], while Emerging Market Equities lost -3.1%.[xii]
We believe it is important to zoom out to gain a greater perspective and look at the journey the stock market, as measured by the S&P 500, has taken since early-2020 through to early-November 2022, focusing on several timeframes in the chart below. The market was at an all-time high in February 2020, (A), just before Covid-19 lockdowns shook the global economy. The market then fell 33% until it bottomed out on March 23, 2020, (B). The market then steadily rallied to a new all-time high from the Covid-19 low to January 3, 2022, (C), as central banks worldwide intervened and provided massive liquidity through quantitative easing and low interest rates. Ever since the market hit its all-time high in early-January of this year, it has traded in a channel of successively lower highs and lower lows.[xiii]
Is it possible we are currently experiencing the third Bear Market rally since the all-time high in January 2022? Bear Market rallies have been defined as significant counter trend recoveries that can last as briefly as a few weeks to as long as several months before the market reverses course to a new low. The chart below serves to illustrate the concept of a Bear Market rally.
Source: Barchart.com
While we are encouraged by the stock market’s resilience seen from October into early-November, equities are historically expensive. The total market capitalization of U.S. stocks currently is 153% of U.S. gross domestic product (GDP), almost the same level as the 157% dot-com peak in March 2000, which was right before that bubble burst.[xiv] One overvalued stock, for example, is Apple, Inc. (AAPL). Apple’s stock soared +8% after it reported its recent quarterly earnings results as being slightly better than expected. Apple beat Wall Street analysts’ earnings expectations because of its iMac sales while both its services and iPhone sales disappointed. Apple CEO Tim Cook explained that “silicon-related wafer supply constraints were not significant in the quarter” (microchip shortages ended), and it allowed the company to satisfy back orders and “fill the channel” at resellers and retailers. Between 2008 and 2016, Apple’s price-to-earnings ratio was in a range of 10 to 17 and its compounded annual earnings per share growth rate over that same period was 30%.[xv] Now, it trades at more than 24 times earnings, with analysts expecting only 3% growth in 2023![xvi] Many other technology stocks are similarly overvalued on a historic basis.
We reduced exposure to technology stocks in October in our actively managed strategies before earnings were announced and just recently added back technology exposure in three targeted areas that are all down significantly from their highs: cloud computing, semiconductors, and cyber security.
Year-to-date (through to 10/31/2022), our CIG Dynamic Growth Strategy composite has avoided approximately 44% of the losses of the growth benchmark, and the CIG Dynamic Balanced Strategy has avoided approximately 59% of the losses of the balanced benchmark.[xvii]
We would welcome the opportunity to engage with you — via voice or email — to discuss your questions, and market challenges and opportunities, as well as the benefits of active investment management.


CIG Asset Management Update: Think Different
Commentary:
U.S. equities, as measured by the S&P 500, were up +9.2%, the best month since November 2020. International Equities were up +5.0%[x]. Fixed income gained +2.4% as measured by the Bloomberg U.S. Aggregate Index.[xi] Gold fell -2.3%[xii] and crude oil lost -6.8%[xiii] as the U.S. Dollar Index gained +1.3%.[xiv]
On Wednesday, July 27, the Federal Open Market Committee raised the Federal Funds Rate (the interest rate at which depository institutions trade federal funds [balances held at Federal Reserve Banks] with each other overnight) by +0.75% to a range of 2.25% to 2.50%.[xv] During the press conference that followed the rate announcement, Federal Reserve Chair Jerome Powell said the Fed had already reached a “neutral” level of interest rates—one that neither boosts nor restricts economic activity. The S&P 500 gained +3.8% from the start of Powell’s press conference at 2:30p.m. July 27 through the close on July 29.[xvi] Many market observers attribute the post-FOMC meeting rally to Powell’s “neutral” comment. Has the Fed already done the heavy lifting? We think not and believe we are not alone in this thinking. Former Treasury Secretary Lawrence Summers said on Wall Street Week, “Jay Powell said things that, to be blunt, were analytically indefensible,” and “There is no conceivable way that a 2.5% interest rate, in an economy inflating like this, is anywhere near neutral.” Mohamed El-Erian, Chief Economic Adviser to Allianz SE and President of Queen’s College, said that “the zip code for neutral is above where we are now.”[xvii]
We have illustrated below just how far behind the curve the Fed currently is in its fight against inflation. In the previous seven tightening cycles, the Federal Reserve raised the Fed Funds Rate to a level higher than the inflation rate, as measured by CPI at that time, to bring prices down. As recently as April 2019, the effective Fed Funds Rate, the volume-weighted median rate, was 2.4% while CPI was up +2.0% year-over-year.[xviii]
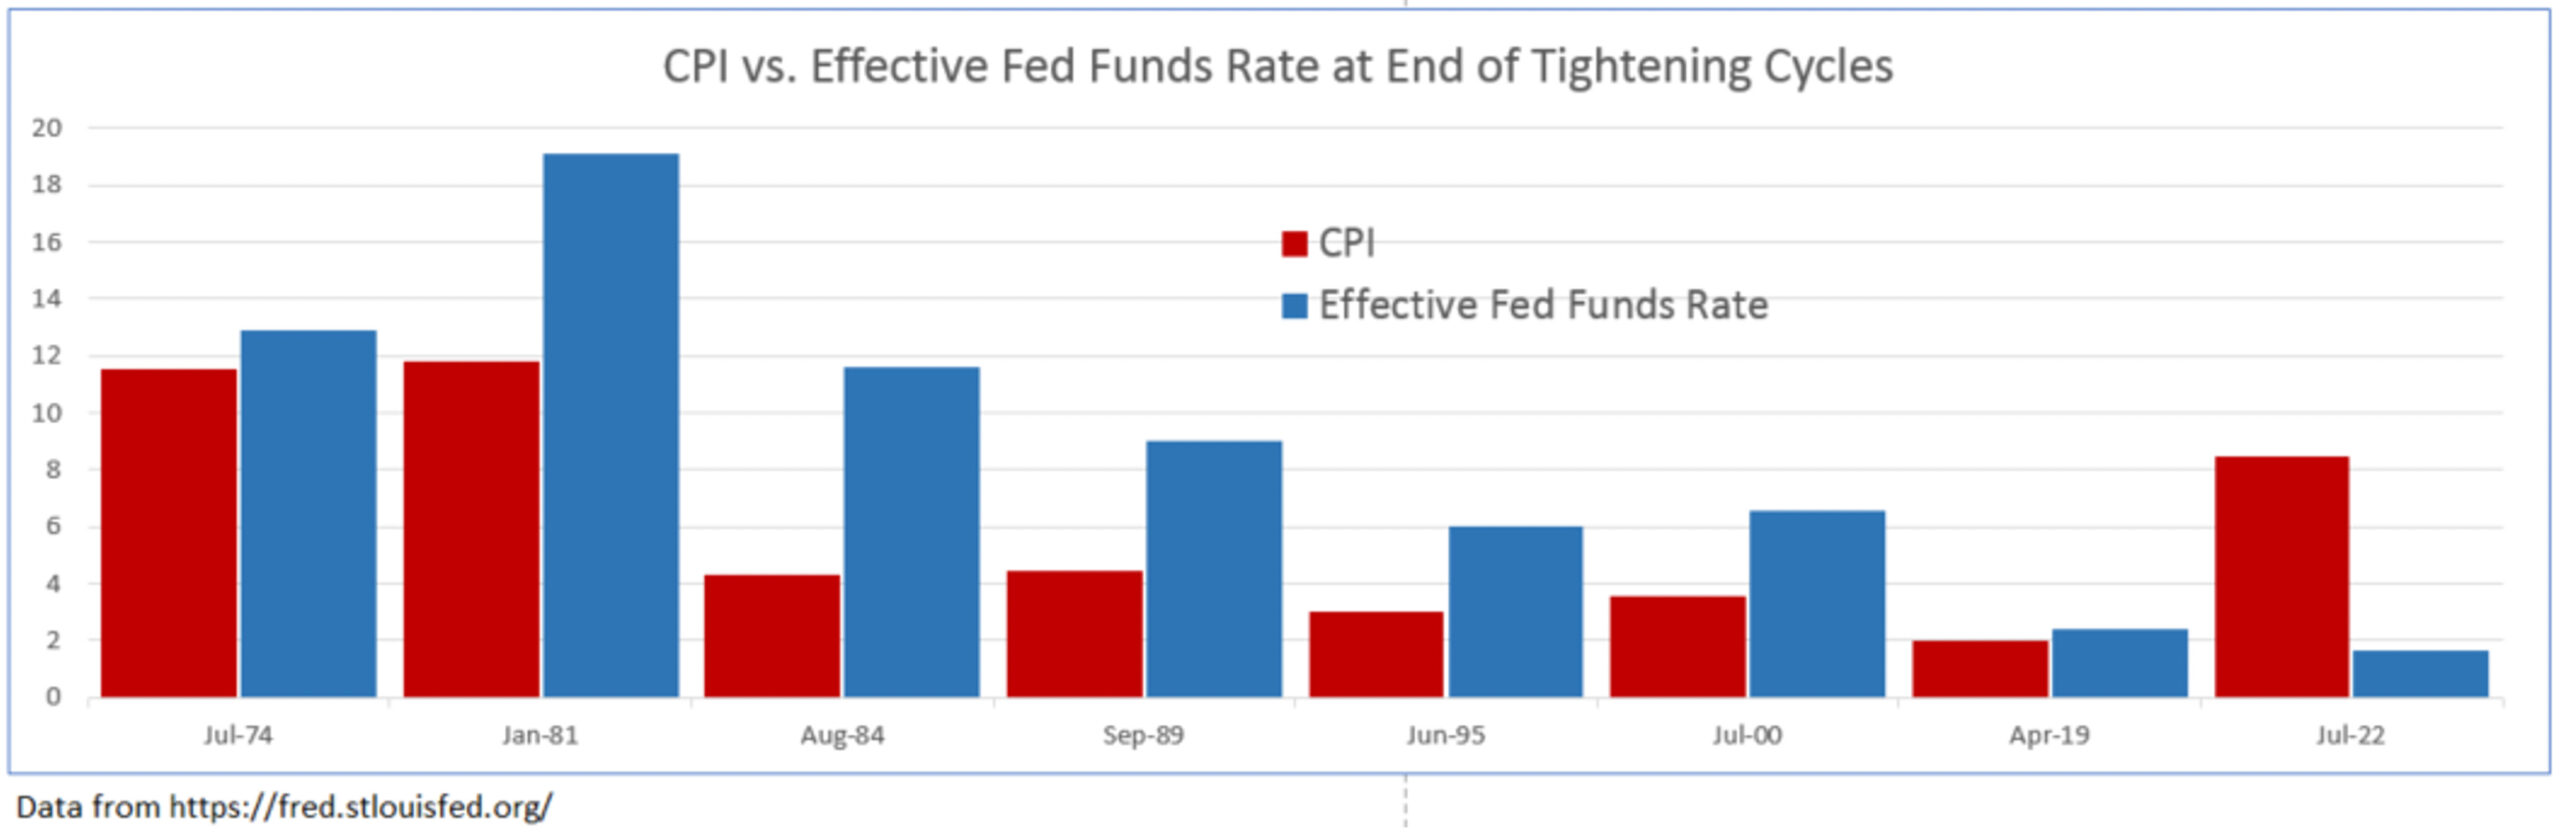
July 2022 CPI was up +8.5% year-over-year, while the effective Fed Funds Rate is only 1.68%.[xix] We find it incredulous that with over four times the amount of inflation now versus in 2019 and with the effective Fed Funds Rate lower than it was, that the Fed is at “neutral”. The Fed may very well need to raise short-term interest rates a lot more to combat inflation. If it does, we believe stocks will have a sell off.
Having stock, interest rate, and other views that diverge from the collective wisdom of the market can be quite rewarding. In 1997, Apple Inc. launched the “Think Different” advertising campaign. The slogan was launched shortly after Steve Jobs returned to Apple to counter IBM’s slogan at the time, “Think”, a campaign for their ThinkPad.[xx] Apple’s market capitalization in 1997 was around $2.3 billion[xxi] and grew to $2.6 trillion at the end of July 2022.[xxii] IBM’s market cap in 1997 was around $86 billion[xxiii] and only grew to about $119 billion at the end of July 2022.[xxiv] “Think Different” has been very rewarding for Apple—not because of the slogan, but their strategies. Over that 25-year period, excluding dividends, an investment in Apple grew over +100,000% versus IBM’s +38% growth. Howard Marks, legendary investor and co-founder of Oaktree Capital Management, recently wrote a memo to investors titled, I Beg to Differ.[xxv] Marks’ memo highlighted, among many other things, how active investing and contrarian investing are some of the few ways that investors can achieve better returns than the market. In other words, think different.
Marks’ memo has fortified our investment committee’s approach to the entire investment decision-making process. Here we list nine items that we live by each day.
1. Most investors will have average returns. They may be good or bad, but they will be average.
2. If you are happy with average returns, buy index funds and allocate the same as the respective benchmark.
3. To be above average, one must stray from consensus behavior and do something different. One must over/underweight sectors, asset classes and markets. This is “active investing”.
4. Active investing carries both the risk of below average returns and the potential reward of above average returns.
5. When one departs from the herd of passive index investing, they need to use “second-level thinking” to dig deep to develop their investment strategy.
6. Second-level thinking, as Marks describes it is different, deep, convoluted and complex. It takes into account questions, such as:
a. What is the range of future outcomes?
b. What outcome do I think will occur?
c. What is the probability I’m right?
d. What does the consensus think?
e. How does my expectation differ from consensus?
7. Contrarian thinking can be beneficial at market extremes. To effectively act contrary to the masses one must know what the herd is doing, why it is doing it, why they are wrong and what your solution is.
8. Active investing and contrary thinking carry with it the risk of being wrong in hopes of reaping the reward of being right. An active investor seeks better returns than the herd at risk of falling ehind.
9. Howard Marks says it best, “Unconventional behavior is the only road to superior investment results, but it isn’t for everyone. In addition to superior skill, successful investing requires the ability to look wrong for a while and survive some mistakes.”
The CIG investment committee takes great pride in “Think Different”. We are currently over or underweight sectors, asset classes and markets in an attempt to limit risk while seeking to provide a return to meet our clients’ goals in their financial plans. The following are just a few items that we have a different opinion on than the conventional wisdom of many investors, a group that we call “the herd”.
1. The U.S. equity markets are still historically very overvalued—the herd is “buying the dip”.[xxvi]
2. Markets likely have not priced in an extended Russia/Ukraine conflict or the possibility of a China/Taiwan conflict, even though Blackrock rates the likelihood of both “high”.[xxvii]
3. The Fed raising rates at the fastest pace since 1981 and possible quantitative tightening as we head into a recession will be quite damaging to the economy and stock markets—the herd is already placing bets on the timing of the first interest rate cut.[xxviii]
4. Inflation will remain elevated for longer than most economists forecast—The herd believes inflation has peaked and will rapidly come down and the Fed will stop raising interest rates in the near term.[xxix]
Thinking differently is what allowed us to position our portfolios defensively in 2021 and as a result, year-to-date through July 31, our CIG Dynamic Growth Strategy composite has avoided approximately 54% of the growth benchmark’s losses and our CIG Dynamic Balanced Strategy composite has avoided approximately 61% of the balanced benchmark’s losses.[xxx]
Thinking differently does not mean being universally bearish or bullish about the future. Our thinking differently at CIG is about embedding imagination, like Steve Jobs did at Apple, in repeatable processes. In our case, we assess a wide range of scenarios and possible outcomes which are dependent on the path of critical, potentially life-transformative events to help clients succeed, regardless of how interesting the times are—now or at any point in the future.
We would welcome the opportunity to connect with you via voice or email to discuss how you think (differently) about life… about the markets and the value of active investment management.

CIG Asset Management Update: Quantitative Tightening: The Fed, its Tools and Policies
Commentary:
June 2022 brought to a close the first half of the year and proved to be a difficult month for investors. The U.S. equities, as measured by the S&P 500, were down -8.25%.[ix] International Equities were down -9.28%[x] in spite of Chinese stocks gaining +6.66% [xi] as their economy reopened from COVID lockdowns. Fixed income offered no relief and lost -3.79% as measured by the Bloomberg U.S. Aggregate Index.[xii] Gold fell -2.09%[xiii] and crude oil lost -7.77%[xiv] as the U.S. Dollar Index gained +2.66%.[xv] The S&P 500 wrapped up the first half of 2022, down -20% year-to-date, marking its worst first half performance in 50 years. 10-year U.S. Treasury bonds had their worst first half performance since 1788, just before George Washington became our first president.[xvi]
Why has the first half of 2022 delivered such unfavorable returns across so many different asset classes? We believe the end of Quantitative Easing, “QE”, may be the root cause. During QE, the Federal Reserve (Fed) bought bonds in the open market in an attempt to increase the money supply and liquidity and lower borrowing costs. QE was first used in the U.S. in reaction to the Great Financial Crisis in 2007-2008. The first three rounds of QE ballooned the Fed’s balance sheet from $900 billion to $4.5 Trillion and ended in 2014.[xvii] During the fourth round of QE, the Fed, in response to the COVID-19 pandemic, almost doubled the balance sheet from 2014 levels to nearly $9 trillion.[xviii]
We discussed the Fed balance sheet a year ago in our June 2021 CIG Asset Management Review: Inflation and Fragility. In that review, we talked about how Federal Reserve asset purchases created a massive liquidity wave which dramatically increased the discomfort of holding cash with 0% yield and amplified the desirability of buying risky stocks that investors expect will offer higher returns. We cautioned that without continued Fed intervention, volatility would likely increase. Volatility has indeed increased—significantly. For the entirety of 2021, our proprietary CIG Volatility Signal was on for only 6 out of 252 trading days (2% of the days). Year-to-date through June 30, our Signal has been on for 76 out of 124 trading days (approximately 61% of the days). We have updated the chart from our June 2021 discussion below. The strong correlation between what appears to be an ever-increasing balance sheet and a stronger stock market, the S&P 500, continued until January 2022, when the Federal Reserve suddenly pivoted from a position of “inflation is transitory” to being more hawkish.
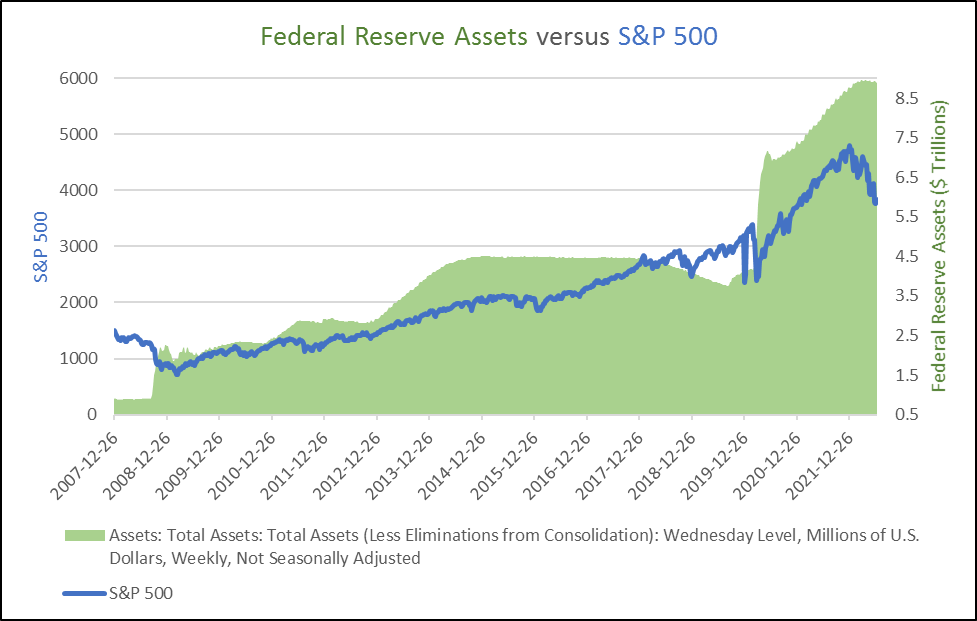
Data from: https://fred.stlouisfed.org and investing.com
On May 4, 2022, the Fed announced it would start reducing its nearly $9 trillion balance sheet on June 1 at the rate of $30 billion of treasury securities and $17.5 billion of mortgage-backed securities. This is so-called “quantitative tightening,” “QT”. Additionally, The Fed said it would increase the monthly reduction to $95 billion three months later.[xix] What progress has the U.S. Fed made in balance sheet reduction so far? The Fed only reduced its assets by $1 billion in June, which is nowhere close to the $47.5 billion that they originally talked about.[xx]
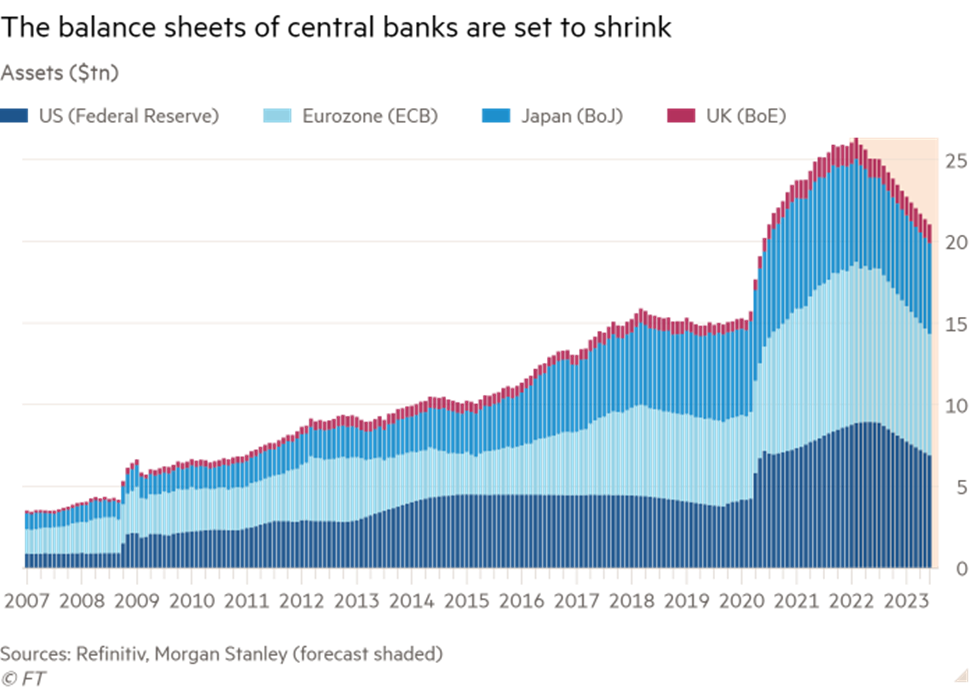
The U.S. Fed is not the only central bank considering shrinking their balance sheet and it’s no wonder, with central bank balance sheets being 5 times greater than they were before the 2008 Great Financial Crisis.[xxi] The Fed has just raised short-term interest rates from 0.25% to 1.75%.[xxii] Many economists expect the Fed to raise short-term rates an additional +0.75% at the July FOMC meeting. Suddenly, money markets and certificates of deposits offer a nominal yield. Morgan Stanley has estimated that in total, the world’s central banks may reduce their balance sheets by about $5 trillion by the end of 2023.
Could a 20% reduction in central banks’ balance sheets have a negative effect on the world’s stock markets? It is entirely possible. The Buffet Ratio, named after Warren Buffet, is a measure of total U.S. stock market capitalization to U.S. GDP. It has already fallen -22% from its all-time high of 202.5% in August 2021 to 157.5% as of June 12, 2022. The stock market, however, remains significantly overvalued, as we are simply back to the peak valuation of 157.5% in March 2000, which was right before the dot-com bubble burst.[xxiii]
Mere talk of reducing the Fed balance sheet in January sparked volatility and sent stocks into a bear market.
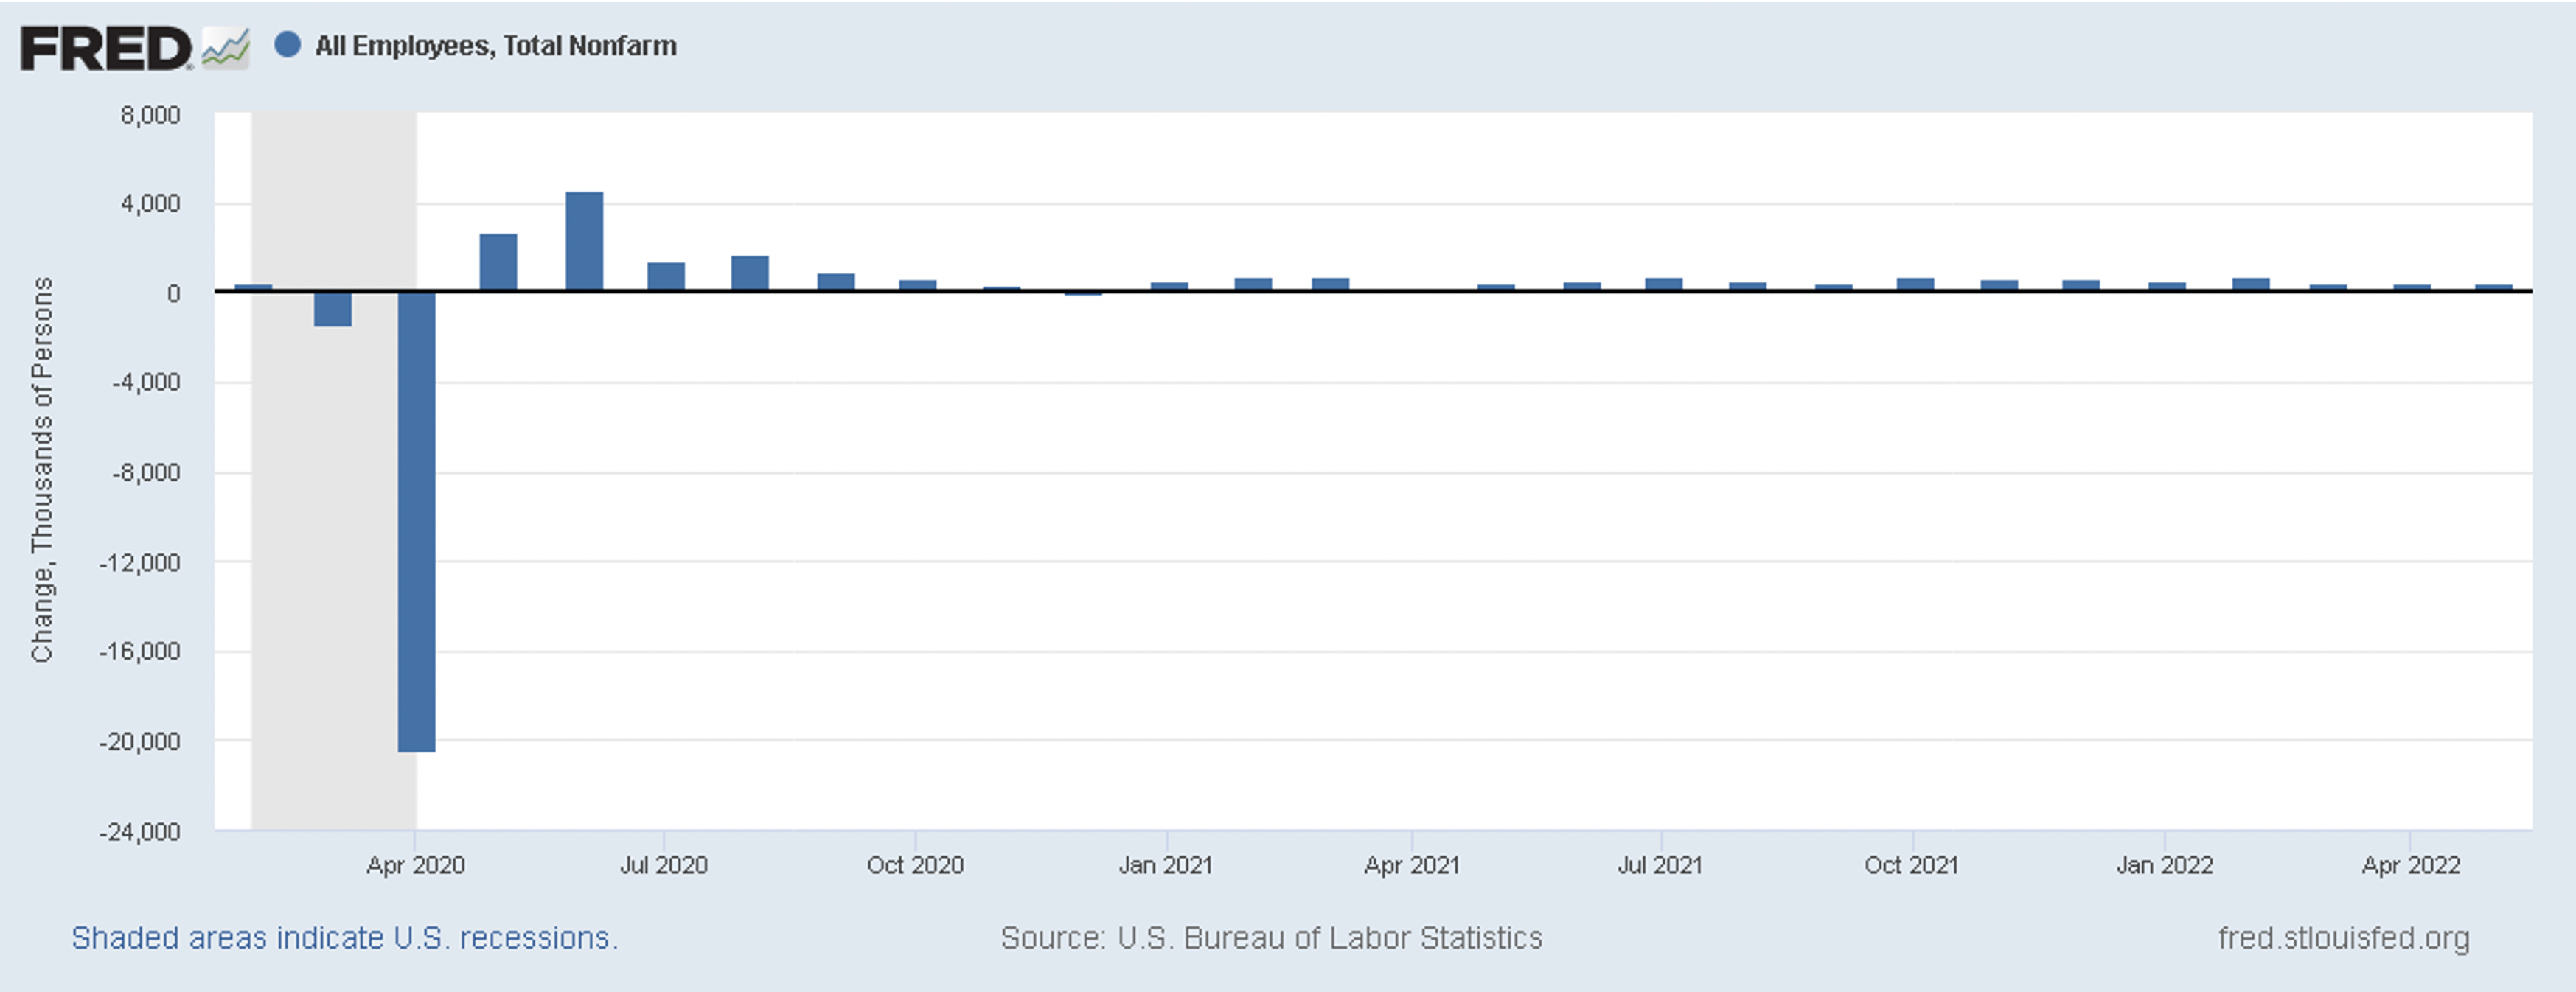
The Fed has gotten itself into a tough spot. Perhaps the economy will slow down so rapidly that inflation fades quickly, and the central bankers do not have to try and unload bonds. If the Fed maintains its almost $9 trillion balance sheet, or in fact increases it as a response to an unforeseen economic crisis, investors would likely be willing to take on more risk and send stocks higher. If employment remains strong and inflation remains historically high, they will be pressured to continue to raise interest rates and reduce liquidity by decreasing the balance sheet. June nonfarm payrolls were much stronger than expected, with 372,000 jobs created for the month versus the Dow Jones estimate of 250,000.[xxiv] June CPI showed inflation was up +9.1%, hotter than the +8.8% Dow Jones estimate[xxv] and the largest year-over-year increase since 1981.[xxvi]
Q2 2022 earnings season will bring the results of corporate efforts last quarter, as well as – more importantly – the outlook of those companies’ CEOs for what they see lies ahead for the rest of the year. The Federal Open Market Committee (FOMC) will meet on July 26-27 to determine how much to raise short-term interest rates. Higher rates mean less money for companies to spend on stock buybacks and real corporate expenditures and consumers to purchase goods and services.
Active management strategies are vital during periods when answers to important questions are unknown. Will the Fed do what they say they would and reduce their balance sheet? Could a 20% reduction in central banks’ balance sheets have a severely negative effect on the world’s stock markets? Will geopolitical stability be impacted? Will a “hard landing” and recession lead to no QT that brings the return of past trends or will various troubles create a future that has little similarity to history? Democratic decline, aging populations, fiscal deficits, polarizing geopolitics and deglobalization suggest uncharted territory ahead. How long this uncertainty lasts remains an open question and prudent investors must contemplate all scenarios.
Meanwhile, we “take arms against a sea of troubles”[xxvii] by continuing to take much less risk in our managed accounts versus traditional benchmarks. We will be patient and remain vigilant until some clarity is gained regarding inflation, interest rates and the direction of the economy. To QT or Not To QT: that is the question. Ah, “what [soft landing] dreams may come” from the World’s central bankers.
The Bard’s wisdom — “This above all: to thine own self be true”[xxviii] — prompts us to seek your questions, concerns and perspectives on the markets, the economy, and the value of careful active management, especially during uncertain times. We would welcome the opportunity to connect with you via voice or email.

VIP: CIG Asset Management Update: Stagflation – Is a Perfect Storm Forming?
Commentary:
Energy prices continued to climb during the month of May, adding to fears that inflation may be persistent. Natural gas gained +12.4%, adding to its +28.3% gain in April.[ix] Crude oil advanced +9.53% for the month to $114.67 per barrel.[x] The S&P 500 hit its 52-week low on May 20 and briefly entered “bear market territory”, down -20% from its all-time high and then bounced in the last week of trading to close up for the month.
Stagflation is the “perfect storm” of negative news: rising unemployment, rising costs and a slowing economy. The classical definition is persistent inflation combined with stagnant consumer demand and relatively high unemployment. Is the U.S. economy about to be hit by a stagflation storm the likes of which have not been seen since the 1970s? Let’s consider each of these indicators:
Is the U.S. economy experiencing persistent inflation? Yes. Personal Consumption Expenditures Index excluding Food and Energy was up +4.9% year-over-year in April 2022.[xi]

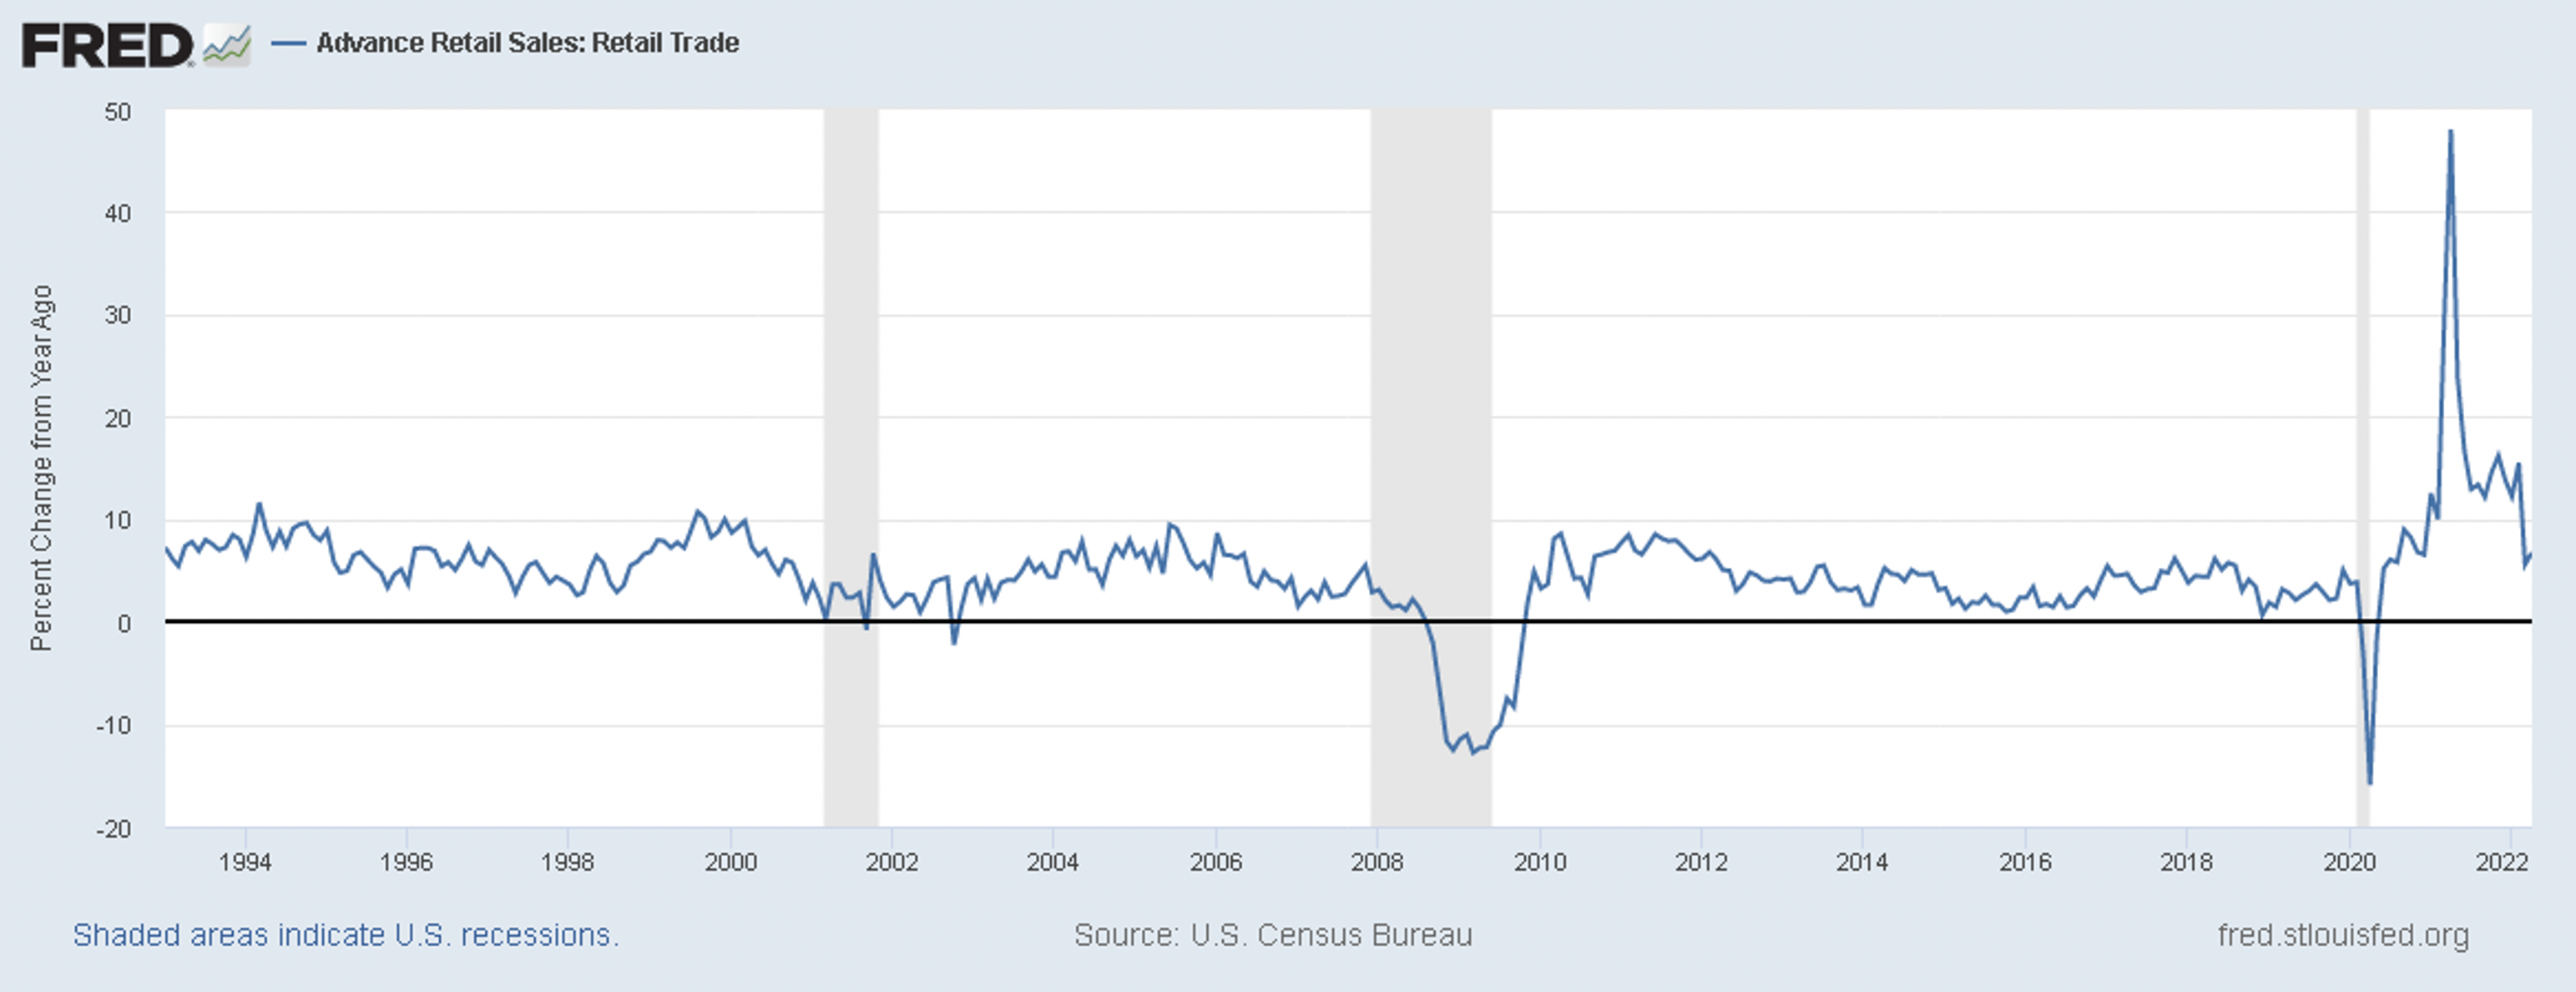
Has consumer demand stagnated? Not yet. April retail sales were up +6.7% year-over-year. Slowing from the large gains that were seen after lockdowns ended in 2021.[xii]
Retailers are starting to see a big shift in consumer spending away from non-discretionary (things you want) to discretionary (things you need). Walmart’s Chief Executive Officer Doug McMillon said the disappointing earnings were “unexpected” and reflect an “unusual” environment. Inflation squeezed consumer discretionary spending and staffing costs increased.[xiii] Walmart stock fell over -11%, its worst one-day performance since the crash of 1987.[xiv] Target fell -25%, also its worst performance since the 1987 crash, as it saw unusually high costs and consumers shift spending away from discretionary purchases.[xv]
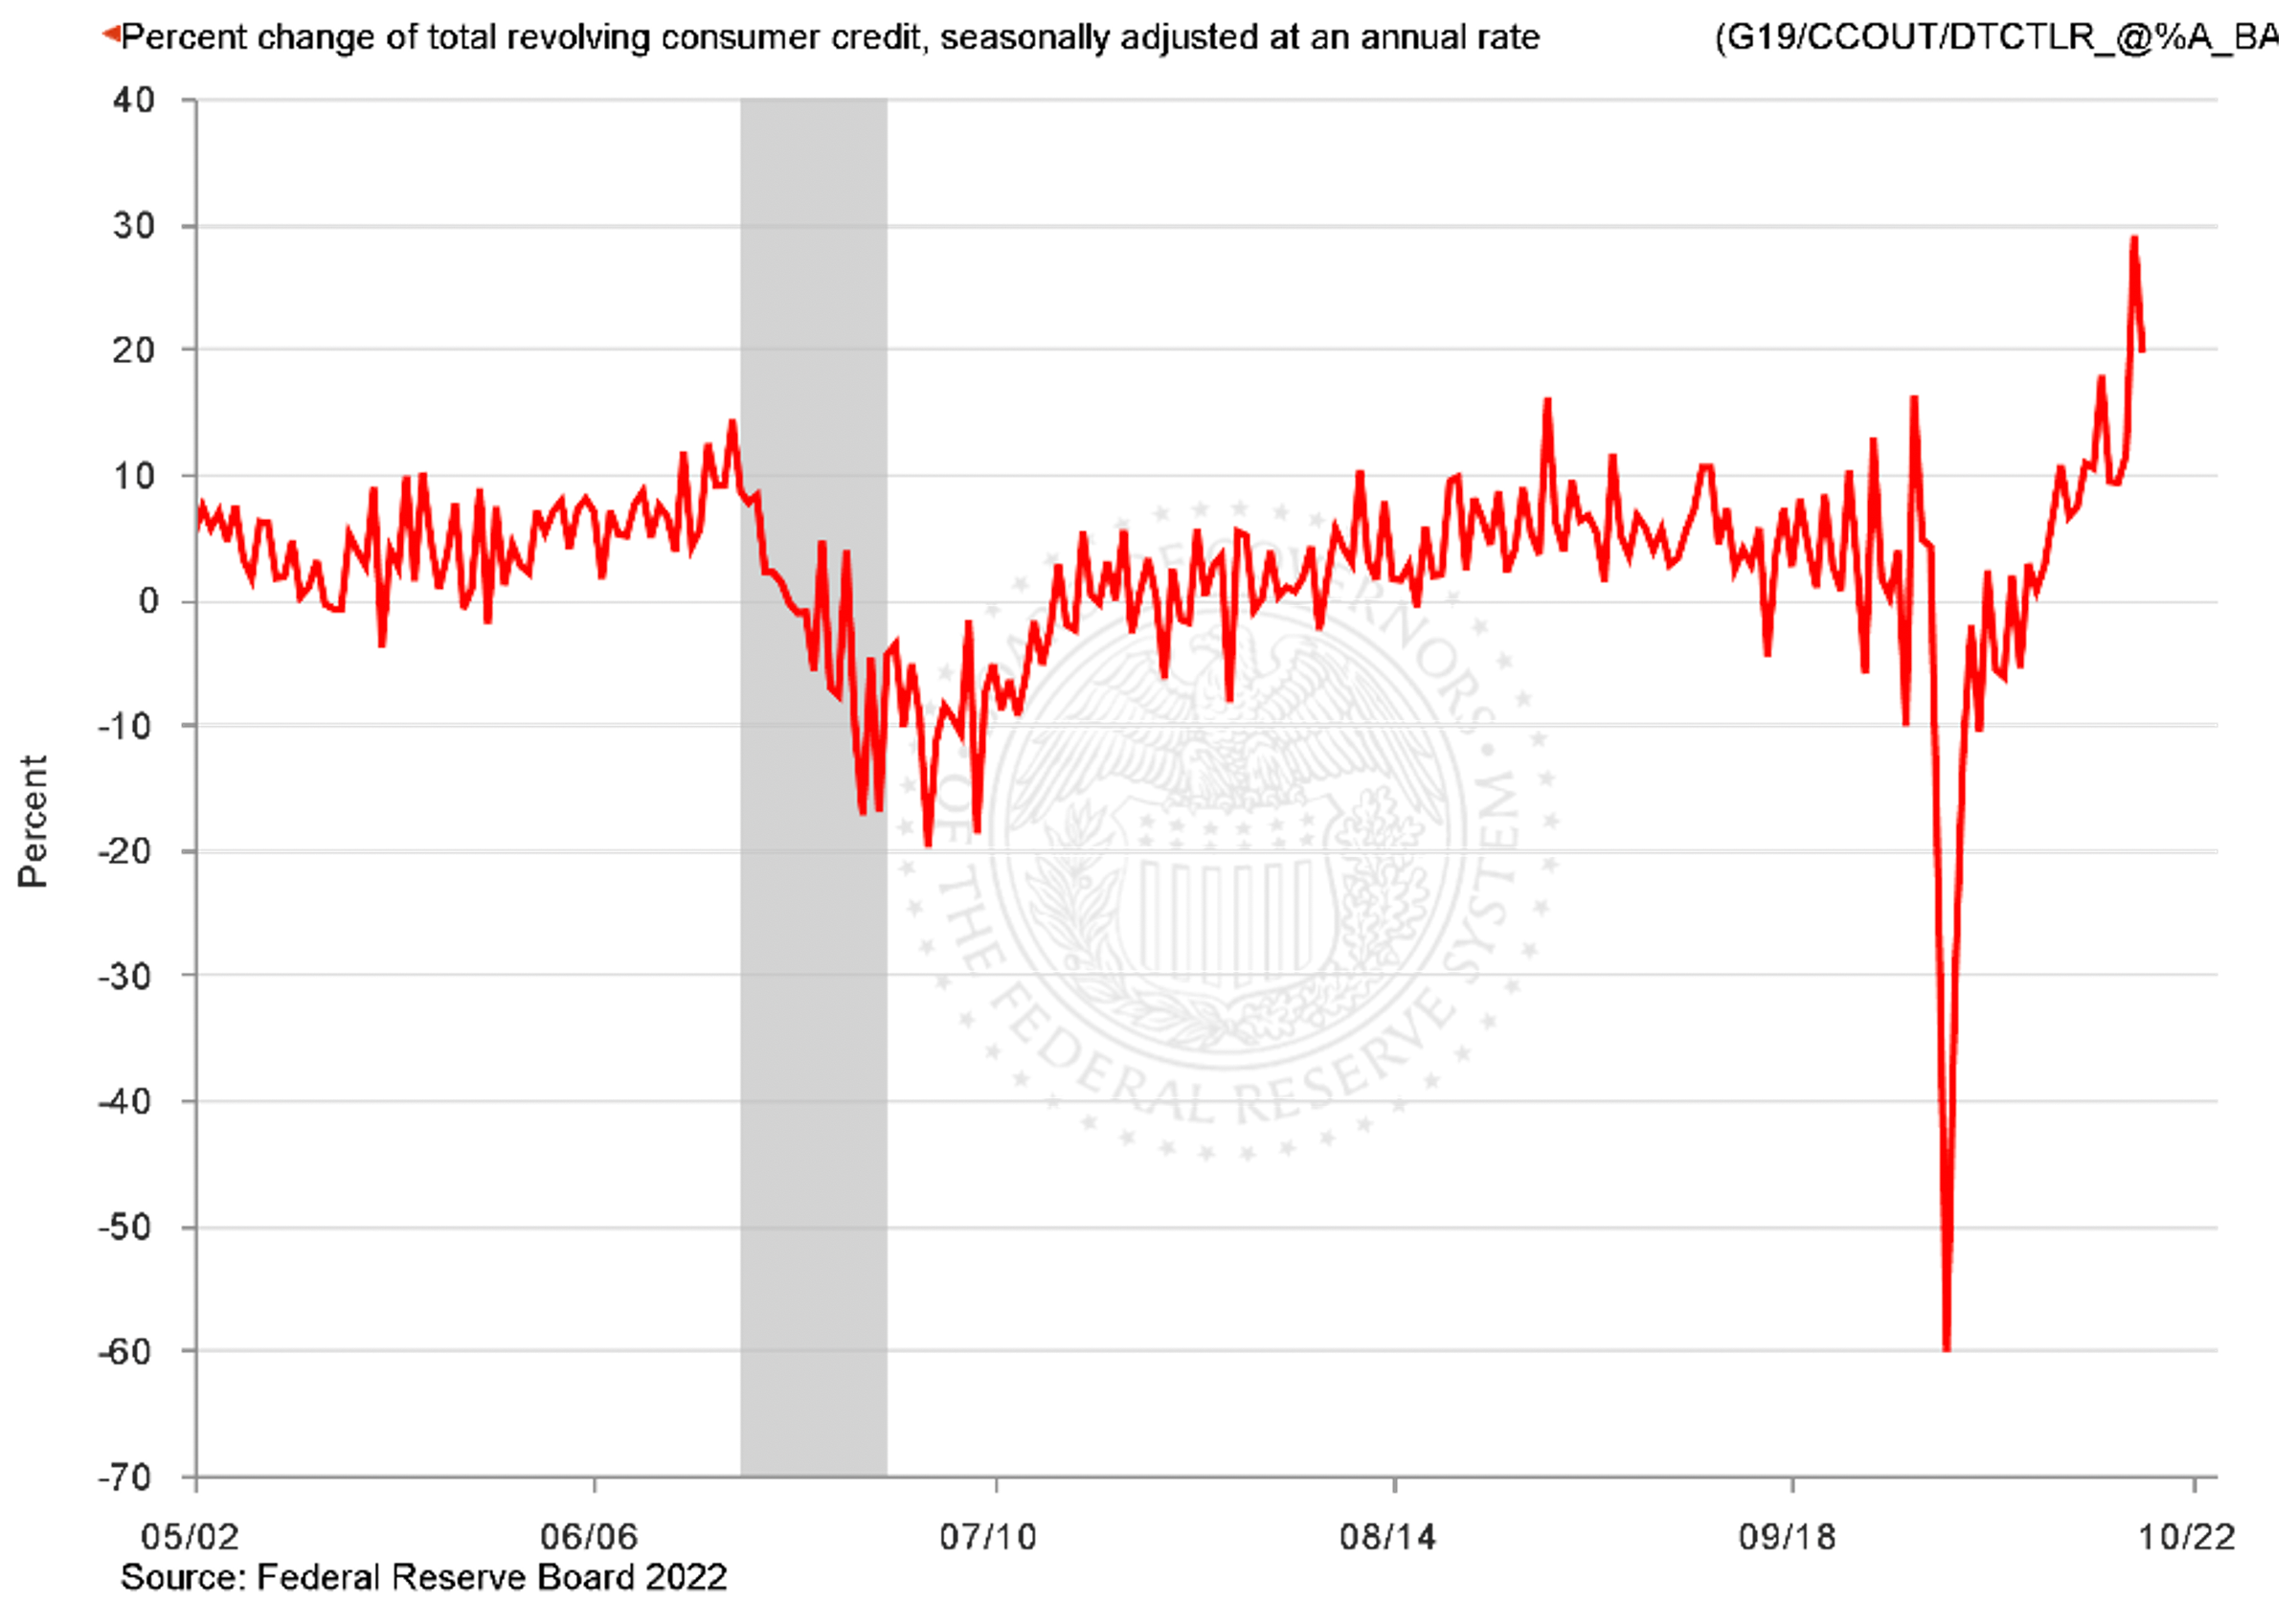
We believe that spending has been propped up by consumers buying what they need on credit. March saw a +29% increase year-over-year in revolving consumer credit, followed by a +19.6% year-over-year advance in April.[xvi] Revolving consumer credit consists mainly of credit card debt. We do not believe the trajectory of the chart below is sustainable.
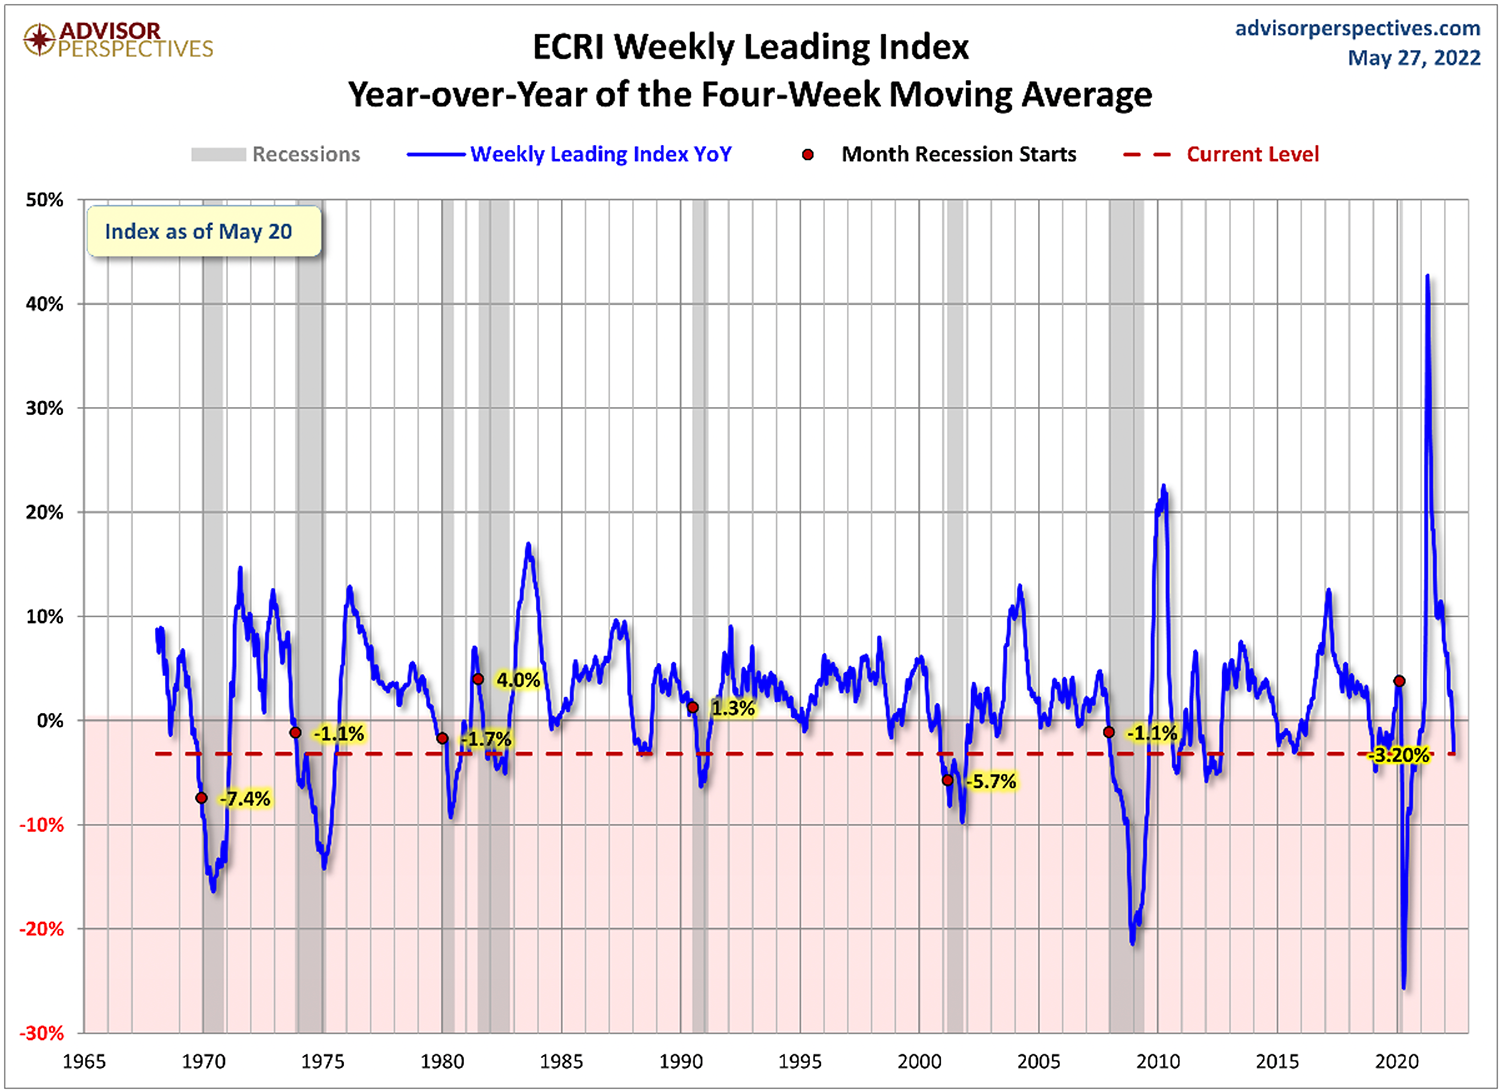
Personal consumption expenditures and retail sales are both lagging indicators. If we look at a leading indicator, the Economic Cycle Research Institute (ECRI) Weekly Leading Index, we see signs that the economy is rapidly slowing. The year-over-year change of the four-week moving average of the ECRI Weekly Leading Index was -3.2% as of May 20, 2022.[xvii]
Relatively high unemployment? No. May Nonfarm Payrolls showed +390,000 jobs added to the economy.[xviii] We are still seeing healthy gains in employment, but at a more muted level than mid-2020.
Already this year, we have seen a small wave of companies, including Wells Fargo, Robinhood, Netflix, Carvana, and Peloton, announce employee cuts.[xix] On June 2, 2022, Elon Musk emailed Tesla executives and told them the company needs to reduce its workforce by 10%, citing a “super bad feeling” about the economy.[xx] As the economy slows, we may see increased layoffs.
We may continue to see persistent inflation, slowing consumer spending and slower job growth and layoffs. The Federal Reserve may have to raise rates faster and higher than expected to combat inflation and in doing so could likely impact consumer demand and increase unemployment. Economist Mohamed El-Erian, in an interview with Fortune magazine, said stagflation is “unavoidable” and investors should prepare for a “significant slowdown in growth.”[xxi] On June 1, 2022, Jamie Dimon, CEO of JPMorgan – the largest bank in the U.S. – spoke to analysts and investors and said current conditions are “fine”, but then warned, “You’d better brace yourself. JPMorgan is bracing ourselves and we’re going to be very conservative with our balance sheet.” Dimon continued, “You know, I said there’s storm clouds but I’m going to change it … it’s a hurricane.” Dimon went on to say he doesn’t know if it’s going to be “a minor one or Superstorm Sandy.”[xxii]
It is possible inflation will subside, the consumer will remain strong and unemployment will remain near record low levels. However, if these three things don’t happen, how does one to prepare for the storm?
Many investment strategists believe owning Treasury Inflation-Protected Securities (TIPS) and real assets, such as real estate and commodities, can help reduce inflation risk. We have also observed that during past environments where growth is slowing, that consumer staples (the things you need) tend to outperform the rest of the market. We have already positioned a healthy weighting of TIPS, gold, and gold miners in our Dynamic and Strategic strategies.
We may or may not be interpreting these deteriorating graphs smartly while the business leaders discussed above are shouting danger “at the top of their lungs.” Regardless, the rational act for today is to continue these investments in CIG’s client portfolios to potentially protect against inflation or stagflation. But we also recognize that the markets are remarkably unstable right now. It’s hard to predict when Chairman Powell or some other market missionary will unleash a torrent of “inflation has peaked and that the Fed is overshooting.” What ultimately may offer a safe harbor for CIG’s clients is our focus and ability to quickly adjust to changing circumstances and to pursue new investment opportunities as they emerge.
We would welcome the opportunity to connect with you to address your questions and concerns and discuss the economy, as well as the value of careful active management in uncertain times.