
CIG Asset Management Update: A New Bull Market?
Summary:
* Are we in a new bull market?
* S&P 500 performance continues to be concentrated in only a few names.
June 2023 Returns:
| Benchmark / Index | Return | Benchmark / Index | Return |
|---|---|---|---|
| Growth Benchmark[i] |
4.7% |
Balanced Benchmark[ii] |
3.4% |
| S&P 500[iii] |
+6.6% |
Bloomberg US Agg Bond[iv] |
(0.4%) |
| MSCI EAFE[v] |
4.6% |
MSCI Emerging Markets[vi] |
3.8% |
| Gold[vii] |
(2.2%) |
Crude Oil[viii] |
+3.8% |
Commentary:
Domestic equities continued to rally in June after President Biden signed the Fiscal Responsibility Act of 2023, which raised the debt limit into law on June 3, 2023, ending the current debt limit crisis.[ix] On June 8, the S&P 500 rose, putting the index +20% above its October 12, 2022 low – possibly signaling the start of a new bull market.[x] A bull market is commonly defined as a +20% move in stock prices.[xi] The technology-heavy NASDAQ 100 index gained almost +40% for the first half of 2023 – its best first half ever.[xii] Crude oil regained some of May’s losses, advancing +3.8% for the month.[xiii]
Are we in a new bull market? Technically, when measured from the October 12, 2022 low, the answer is yes. However, the recent rally in stocks has not been broad based. A small number of mega-cap technology stocks have driven returns. Michael Hartnett, investment strategist at Bank of America, has referred to the biggest seven mega-cap monopolistic U.S. tech stocks – Apple, Amazon, Microsoft, Meta, Alphabet, Nvidia and Tesla – as the Magnificent Seven.[xiv] As seen in the following chart, year-to-date through June 30, 2023, the Magnificent Seven gained +61.2%.[xv] The S&P 500, a market cap weighted index, gained +16.8%[xvi] as the equal-weighted S&P 500 was only up +6.9% during this same period.[xvii]
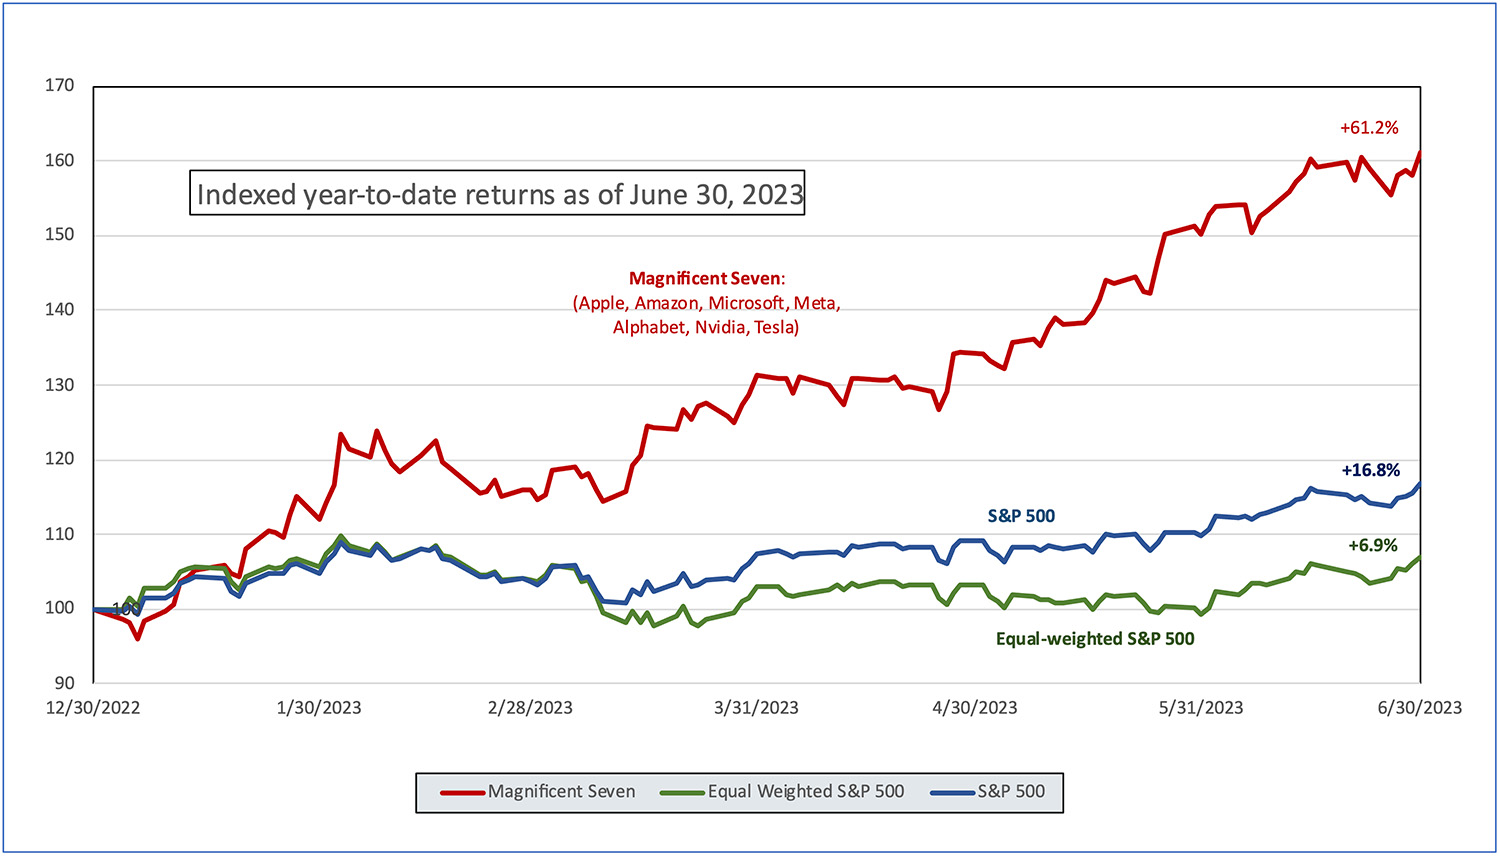
According to J.P. Morgan Asset Management, the top ten largest companies in the S&P 500 accounted for over 95% of the index’s year-to-date return for the first half of 2023.[xviii]
Historically, when a small number of stocks dominate overall market performance, it is not automatically a reason to sell equities. Sometimes the rally will broaden out to stocks that have lagged in performance and sometimes the outperforming stocks will give back some of their returns. While we are hopeful the current rally will broaden out to lagging stocks, we are cautious as many strategists expect a recession at some time in the next twelve months. As we wrote about last month in Technology Bubble 2.0?, it is our opinion that the current outperformance of the Magnificent Seven has been driven by artificial intelligence (A.I.) mania and we are skeptical that the gains can hold. Six of the seven Magnificent Seven stocks are experiencing sharply declining sales and earnings growth this year.[xix]
CNN’s Fear & Greed Index has reached the “Extreme Greed” level as seen in the graphic below.[xx]
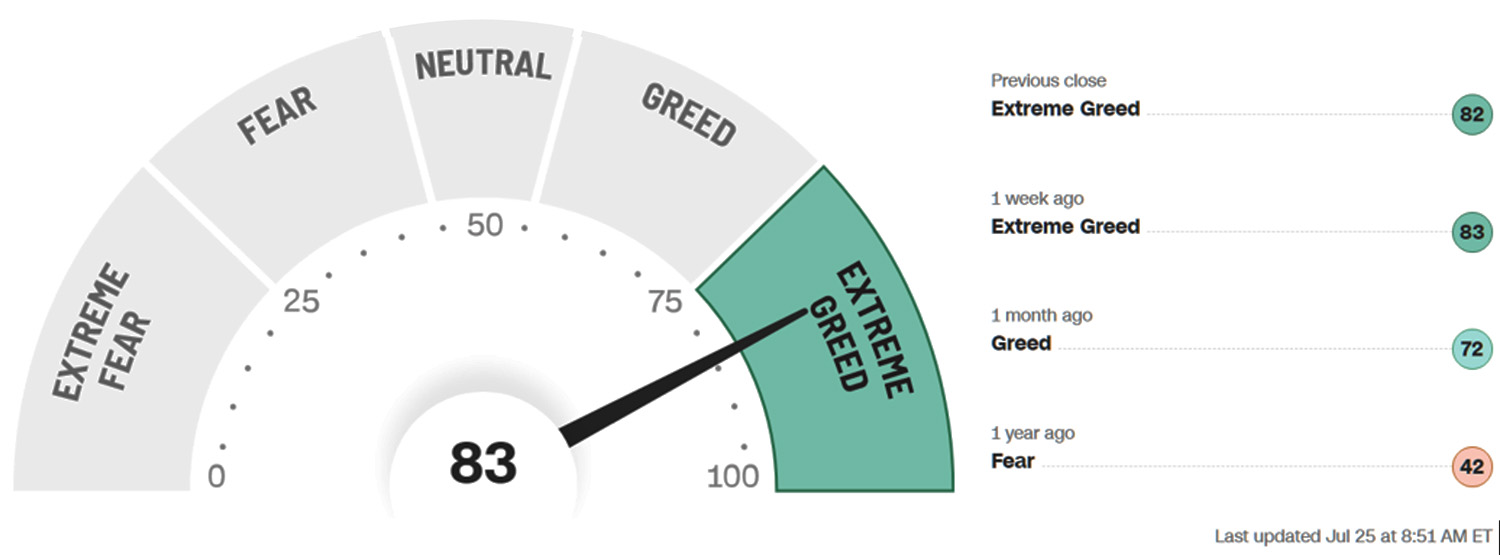
Source: https://www.cnn.com/markets/fear-and-greed as of 8:53am, 7/25/2023
We agree with legendary investor Warren Buffett’s thoughts on fear and greed. Buffett, in his 1986 Berkshire Hathaway letter to shareholders famously wrote, “What we do know, however, is that occasional outbreaks of those two super-contagious diseases, fear and greed, will forever occur in the investment community. The timing of these epidemics will be unpredictable. And the market aberrations produced by them will be equally unpredictable, both as to duration and degree. Therefore, we never try to anticipate the arrival or departure of either disease. Our goal is more modest: we simply attempt to be fearful when others are greedy and to be greedy only when others are fearful.”[xxi]
Many investors currently have FOMO – fear of missing out. We believe many investors are experiencing the disease of greed and it appears dangerous to chase the returns of the Magnificent Seven stocks. Some investors have suffered in the past when they chased returns for fear of missing out. Chuck Prince, CEO of Citigroup in July 2007 was interviewed by the Financial Times regarding his company’s investment exposure and said that global liquidity was enormous and, “As long as the music is playing, you’ve got to get up and dance. We’re still dancing.”[xxii] As Prince was saying “get up and dance” in July 2007, Bear Stearns was bailing out two hedge funds with $20 billion of exposure to subprime mortgages. Many historians cite Bear Stearns as the beginning of the 2007-2008 Great Financial Crisis (GFC). During the GFC, stock markets experienced large drawdowns and it took years for investors to recover. We wrote about just how long it took markets to recover in What If the Bubble Bursts?[xxiii] Some stocks never recovered – Citigroup’s stock currently trades -90% lower than where it was in July 2007.[xxiv] Citigroup’s CEO may have better served his shareholders if he sat the dance out. Have investors already forgotten that earlier this year we experienced three of the four largest bank failures ever – First Republic Bank, Silicon Valley Bank and Signature Bank?[xxv] The Federal Reserve has not forgotten. On July 10, Michael Barr, the Federal Reserve’s Vice Chair for Supervision announced that he is advocating tougher bank capital requirements and tougher annual stress tests for U.S. banks.[xxvi] Will tougher banking requirements affect liquidity?
At CIG, we are not entirely sitting the current dance out. We are limiting our equity exposure. At the end of June 2023, our CIG Dynamic Growth Strategy held -29% less U.S. equities than the growth benchmark.[xxvii] We have taken this difference and put it into liquid alternative investments which helped us outperform the markets last year and aim to offer some protection again should markets sour in the second half of this year.
To attempt to strike the right balance in client portfolios, we think that we should be striving to reach the return necessary to meet the various needs of our clients’ financial plans while taking as little risk as possible to meet that goal. For many clients, now at mid-year, we are halfway there.
We would like to hear from you. Please reach out to Brian Lasher (BLasher@cigcapitaladvisors.com), Eric T. Pratt (EPratt@cigcapitaladvisors.com) or the rest of the CIG team.
This report was prepared by CIG Asset Management and reflects the current opinion of the authors. It is based upon sources and data believed to be accurate and reliable. Opinions and forward-looking statements expressed are subject to change without notice. This information does not constitute a solicitation or an offer to buy or sell any security.
[i] The Growth Benchmark is a blend of 60% Russell 3000, 25% MSCI All-Country ex U.S. and 15% Bloomberg U.S. Aggregate Bond indices. Sources: CIG, Zephyr, and Morningstar.
[ii] The Balanced Benchmark is a blend of 45% Russell 3000, 10% MSCI All-Country ex U.S. and 45% Bloomberg U.S. Aggregate Bond indices. Sources: CIG, Zephyr, and Morningstar.
[iii] Zephyr: S&P 500
[iv] Zephyr: Bloomberg U.S. Aggregate Bond
[v] Zephyr: MSCI EAFE Net
[vi] Zephyr: MSCI Emerging Markets Net
[vii] CIG calculated using data from finance.yahoo.com
[viii] CIG calculated using data from finance.yahoo.com
[ix] https://www.nytimes.com/2023/06/03/us/politics/biden-debt-bill.html
[x] https://www.reuters.com/markets/us/behold-wall-streets-new-bull-market-maybe-2023-06-08/
[xi] https://www.investopedia.com/terms/b/bullmarket.asp
[xii] https://twitter.com/Schuldensuehner/status/1674873071058972672
[xiii] See table above
[xiv] https://money.com/faang-magnificent-seven-tech-stocks/
[xv] The Magnificent 7 index is a market cap weighted index comprised of seven stocks – Apple, Amazon, Microsoft, Meta, Alphabet, Nvidia and Tesla – and has been calculated by CIG Asset Management using data obtained from finance.yahoo.com
[xvi] The S&P 500 is represented by SPDR S&P 500 ETF Trust (SPY) and returns have been calculated by CIG using data from finance.yahoo.com
[xvii] The equal-weighted S&P 500 is represented by Invesco S&P 500 Equal Weight ETF (RSP) and returns have been calculated by CIG using data from finance.yahoo.com
[xviii] J.P. Morgan Asset Management Weekly Market Recap, dated 07/03/2023
[xix] The High Tech Strategist newsletter dated June 28, 2023
[xx] https://www.cnn.com/markets/fear-and-greed as of July 12, 2023
[xxi] https://www.berkshirehathaway.com/letters/1986.html
[xxii] https://archive.nytimes.com/dealbook.nytimes.com/2010/04/08/prince-finally-explains-his-dancing-comment/
[xxiii] https://cigcapitaladvisors.com/cig-asset-management-review-what-if-the-bubble-bursts/
[xxiv] Calculated by CIG Asset Management using data from finance.yahoo.com
[xxv] https://www.bankrate.com/banking/largest-bank-failures/
[xxvi] https://www.federalreserve.gov/newsevents/speech/barr20230710a.htm
[xxvii] Calculated by CIG Asset Management
Image: Kameleon007/iStock

CIG Asset Management Update: Technology Bubble 2.0?
Commentary:
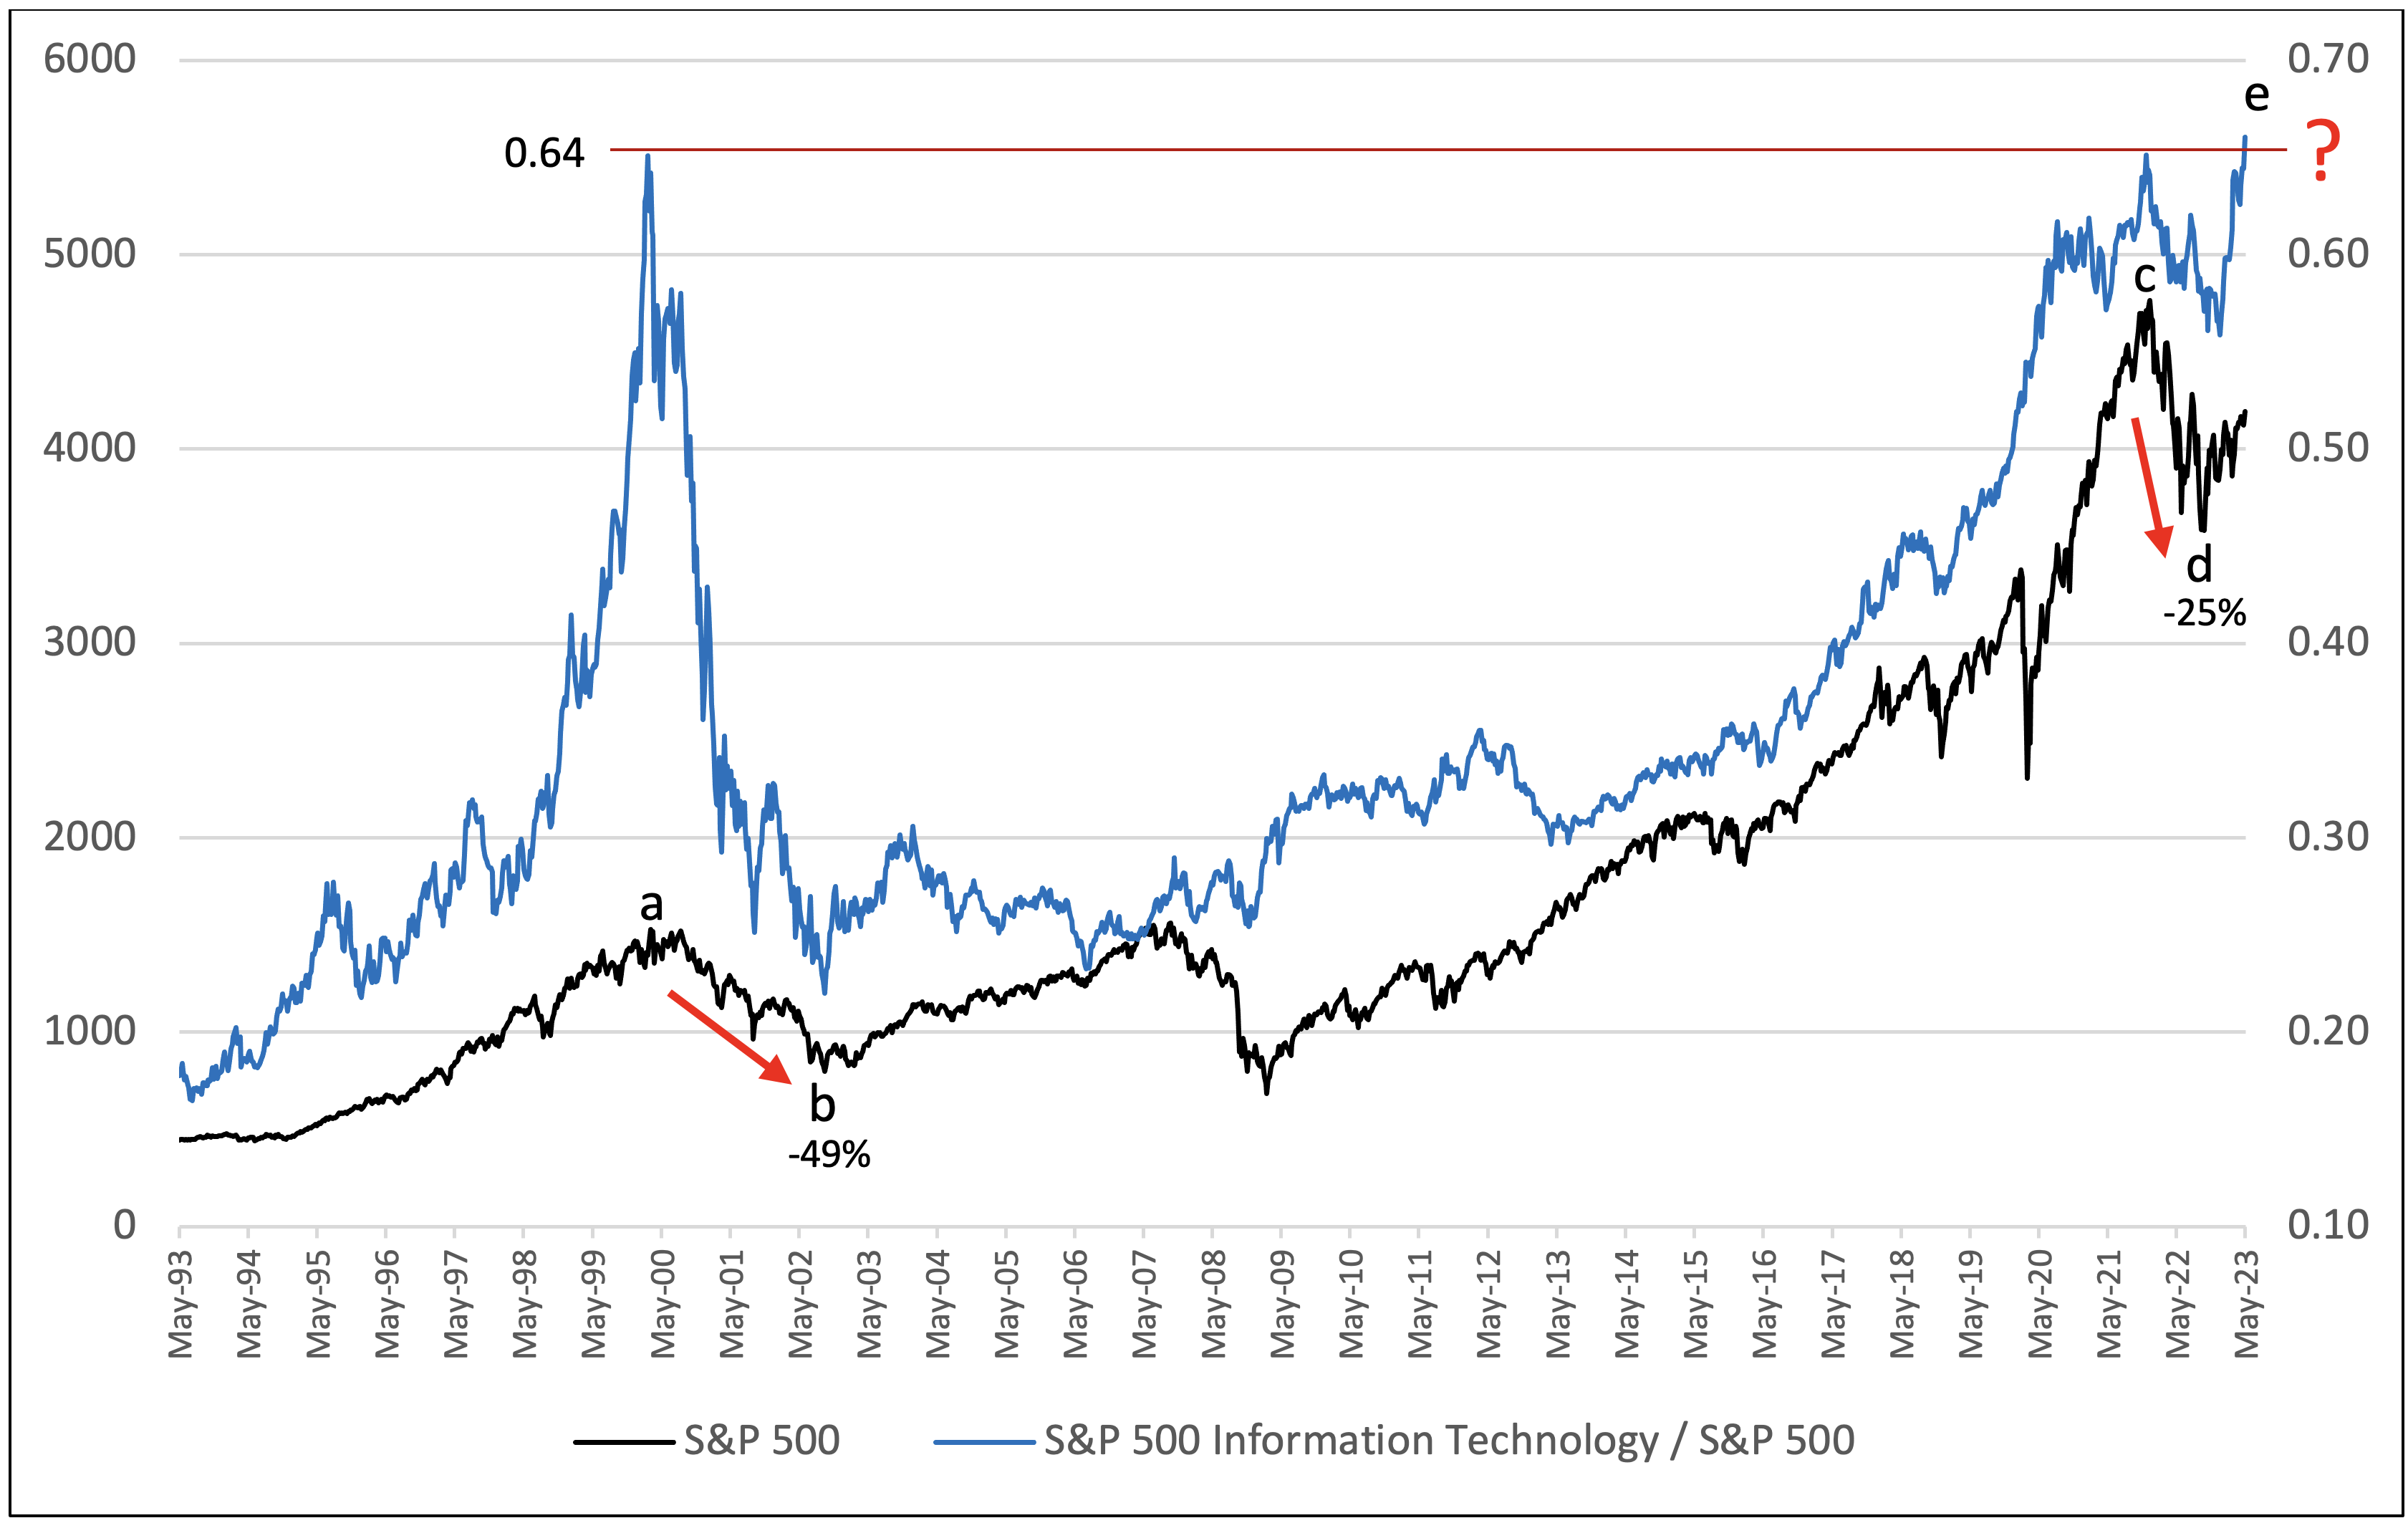
The performance ratio of the S&P 500 Information Technology Sector to the S&P 500[i] (the blue line on the above chart) has hit an all-time high of 0.66. The ratio’s previous all-time high was set in March 2000 at 0.64. As we previously discussed in What If the Bubble Bursts?, from March 27, 2000 (a) to October 9, 2002 (b) the S&P 500 (black line) fell -49% and then it took over 7 years to recover its losses after the peak. This same ratio hit 0.64 again on December 27, 2021 (c) and was followed by a -25% drawdown in the S&P 500 through October 10, 2022. (d) Now, as of May 15, 2023, this important ratio has hit a new all-time high of 0.66. (e)[ii] Will history repeat? Are we currently in a second massive technology bubble? No one knows for sure – but we are very cautious.
The rally thus far year-to-date has been narrow and concentrated in a few names. Six S&P 500 stocks – Apple, Microsoft, Nvidia, Alphabet, Amazon, and Meta – have contributed 90% of the gains of the overall index year-to-date through May 18, 2023.[iii] Five of these stocks are working on incorporating artificial intelligence (A.I.) into their business models and product offerings. While A.I. could be disruptive in the long run, the euphoria in anything A.I.-related reminds us of 1999, when many of the dot-com stocks soared in value with the internet as we know it now was still in its infancy.
Consequently, we continue to attempt to optimize our client’s exposure to the information technology sector in our pursuit of navigating our clients’ investments through these potentially turbulent market conditions. It is impossible to predict where these developments will lead, of course, but periods of upheaval can create opportunities for transformative change. We stand ready to possibly increase our allocation to domestic equities should the market rally broaden out to other sectors that have not kept up with the mega-cap growth stocks that have led year-to-date thus far. If we experience a significant market drawdown, then great opportunities could exist in the market which we would endeavor to evaluate and potentially participate in.
While volatility has moved lower over the course of 2023[iv], we do not expect that to persist for the remainder of the year. Therefore, we continue to stay the course of risk-balanced investing. We remain focused on striking the right aggressiveness versus defensiveness in client portfolios given the evolving uncertainty in the markets, the economy, and geopolitics.
Please reach out to Brian Lasher (BLasher@cigcapitaladvisors.com), Eric T. Pratt (EPratt@cigcapitaladvisors.com) or the rest of the CIG team if you have any questions.


CIG Asset Management Update: “Don’t Fight the Fed”
Commentary:
Domestic stocks continued October’s gains with the S&P 500 gaining +5.2% in November.[ix] Fixed income advanced +3.7% as measured by the Bloomberg U.S. Aggregate Index[x], as the yield on the 10-Year U.S. Treasury bonds fell -0.37% to 3.70% on November 30.[xi] Gold gained +6.7%[xii], International Equities in developed markets gained +11.3%[xiii], and Emerging Market Equities soared +14.8%[xiv], as the U.S. Dollar Index fell -4.9%.
Equities have benefited over the past two months from longer-term interest rates, as measured by the yield on the 10-Year U.S. Treasury bond, falling from their recent peak of 4.33% on October 20, to 3.41% on December 7.[xv] Investors appear to be encouraged by the September and October Consumer Price Index (CPI) reports that showed the rate of inflation has decelerated on a month-over-month basis (i.e., CPI was 8.2% in September and 7.7% in October).[xvi] Despite CPI remaining at 7.7% over the past year[xvii], some feel that the Federal Reserve has already raised rates too much and will need to cut rates as early as next year to keep the economy out of a recession.
“Don’t fight the Fed”, coined in 1970 by Martin Zweig, a finance professor and famed investor, is a mantra that suggests investors should align their investments with the current monetary policies of the Federal Reserve; that not doing so imperils investors’ portfolios. On November 30, Federal Reserve Chairman Jerome Powell spoke at the Hutchins Center on Fiscal and Monetary Policy, Brookings Institution, in Washington, D.C. In his speech, Powell noted, “It makes sense to moderate the pace of our rate increases as we approach the level of restraint that will be sufficient to bring inflation down. The time for moderating the pace of rate increases may come as soon as the December meeting.” Powell continued, “The timing of that moderation is far less significant than the questions of how much further we will need to raise rates to control inflation, and the length of time it will be necessary to hold policy at a restrictive level. It is likely that restoring price stability will require holding policy at a restrictive level for some time.”[xviii]
Investors appear to be “fighting the Fed” as long-term bond yields continue to fall even as short-term rates like the Federal Funds Effective Rate (Fed Funds), an overnight interest rate, are moving higher. In a normal (or less abnormal) world, short-term debt has a lower yield than longer-term debt of the same quality (i.e., it costs more — the interest rate — to borrow for a longer time). On rare occasion, short-term debt has traded at higher yields than long-term debt — this is called an inverted yield curve. Even rarer is when the Fed Funds is at a higher yield than the 10-Year U.S. Treasury bond, which is what just occurred in November 2022.
Let’s explore what has happened after the Fed Funds Rate (blue line) exceeds the yield on a 10-year U.S. Treasury bond (red line), as shown in the following chart:
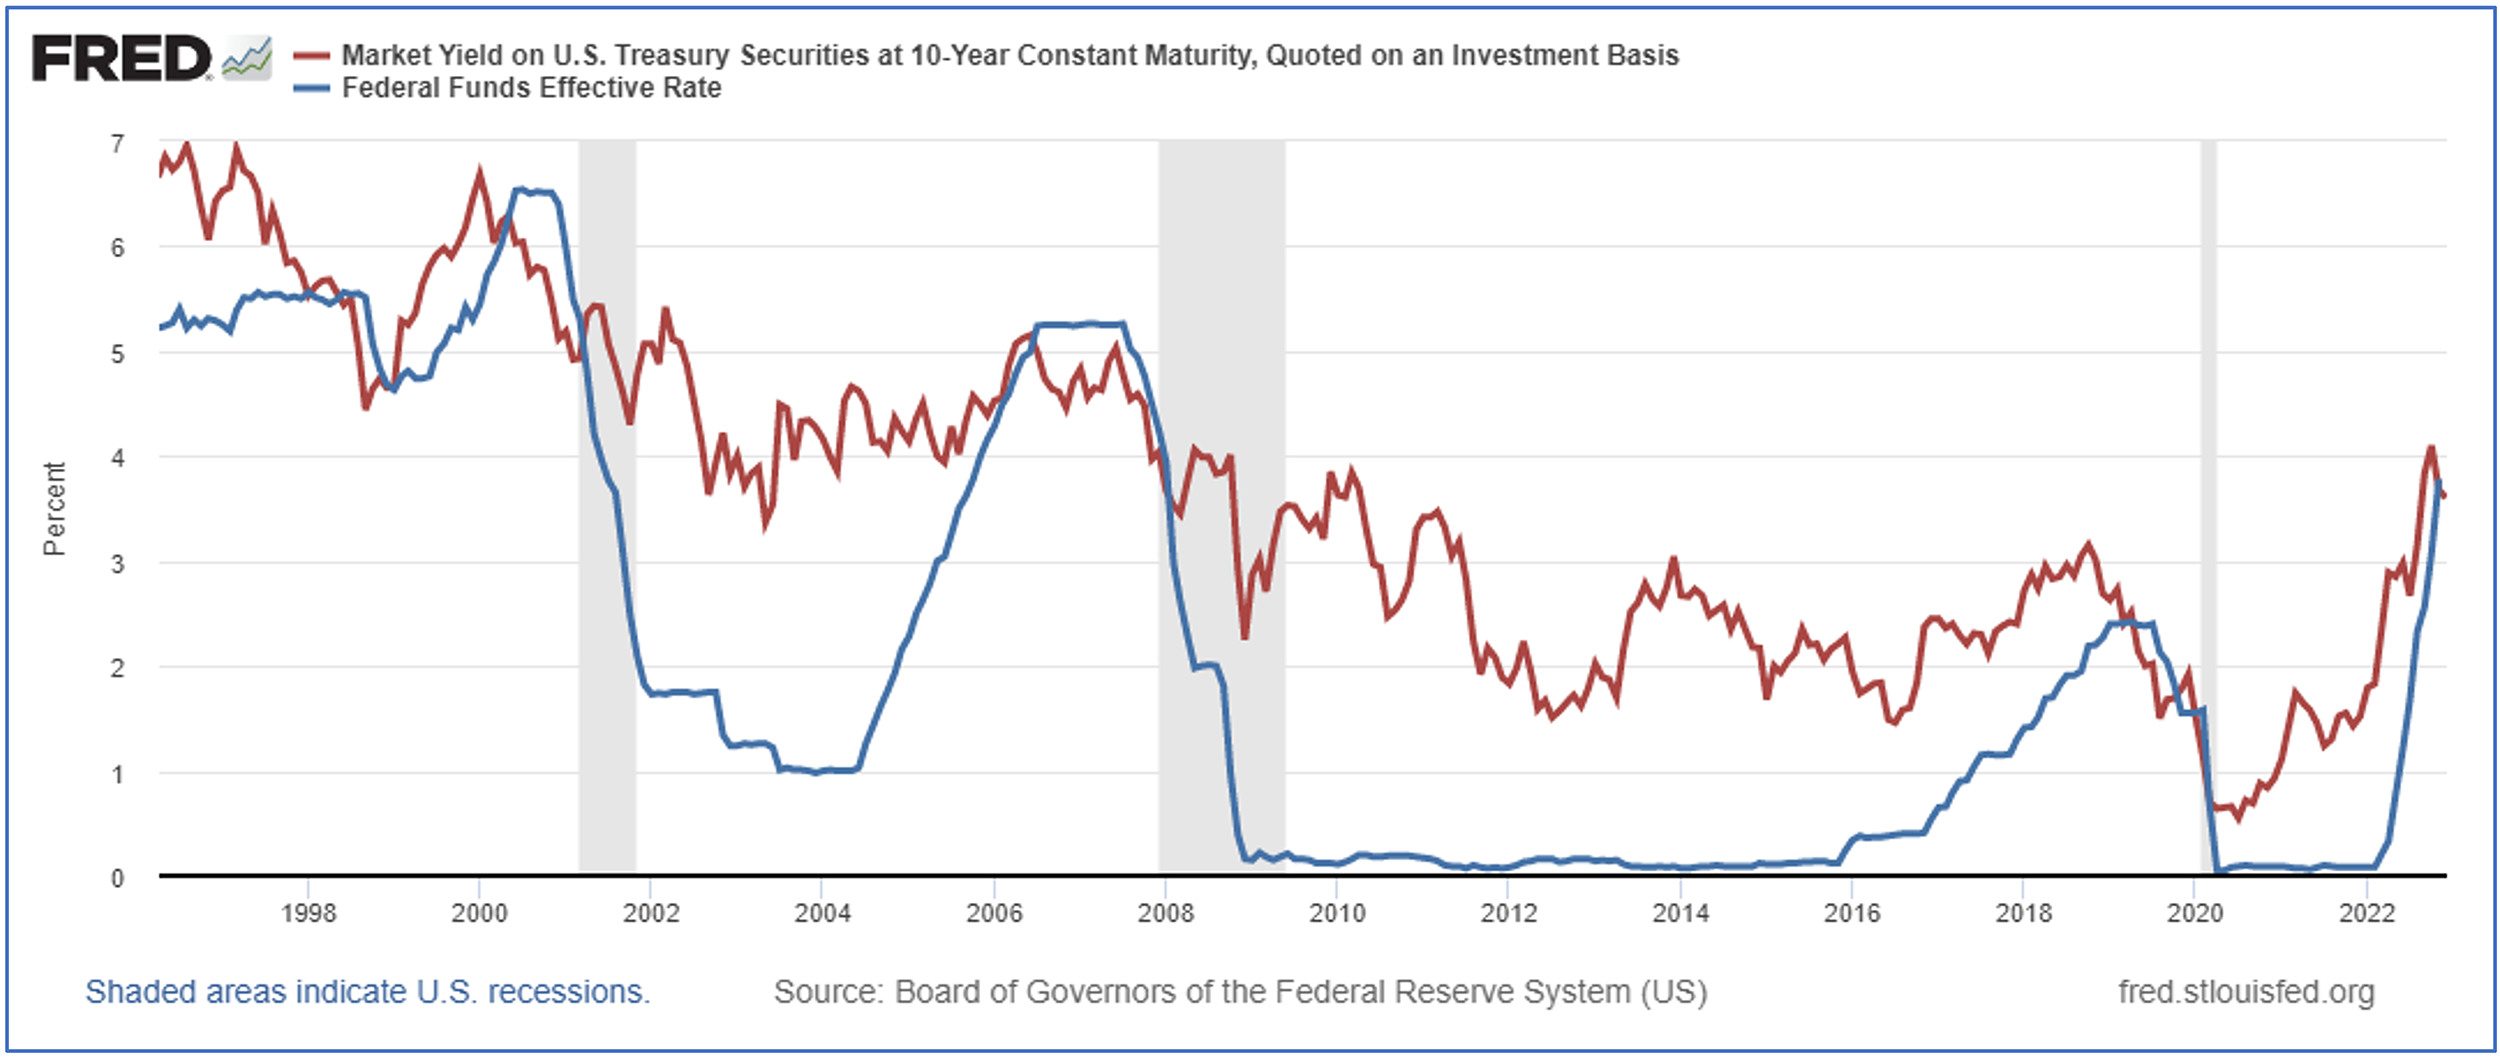 Source: fred.stlouisfed.org
- May 2000. Stocks traded lower for two years; the dot-com bubble burst; and the U.S. economy entered a recession.[xix]
- July 2006. A year later, Bear Stearns failed; the housing bubble began to burst; and the 2007-2008 Great Financial Crisis sent the U.S. economy into a deep recession.[xx]
- Spring 2019. A year later, COVID-19 shut down the word economy; stocks fell; and the U.S. economy entered a brief recession.[xxi]
Perhaps inflation will drop to the Federal Reserve’s 2% goal and they will be able to engineer a soft-landing for the economy. Perhaps not. Regardless, as illustrated in the above chart, be careful what you wish for: markets and the economy suffered initially each of the last three times the Fed started cutting rates.
As we maneuver through these difficult conditions, we continue to apply our disciplined approach to Asset Management. Our CIG Dynamic Growth Strategy composite was able to capture 85% of the upside of the growth benchmark during November 2022 while year-to-date through 11/30/2022, it has avoided approximately 57% of the losses of the growth benchmark. Our CIG Dynamic Balanced Strategy captured 79% of the upside of the balanced benchmark during November 2022 while year-to-date through 11/30/2022, it has avoided approximately 65% of the losses of the balanced benchmark.[xxii]
We would welcome the opportunity to connect with you via voice or email to discuss how active management could protect your portfolio and capture opportunities when other investors are “fighting the Fed”.


CIG Asset Management Update: Are We Experiencing Another “Bear Market Rally”?
Commentary:
Domestic stocks bounced in October, with the S&P 500 gaining +8.1% after September’s -9.2% drawdown.[ix] Fixed income lost -1.3% as measured by the Bloomberg U.S. Aggregate Index.[x] International Equities in developed markets gained +5.4%[xi], while Emerging Market Equities lost -3.1%.[xii]
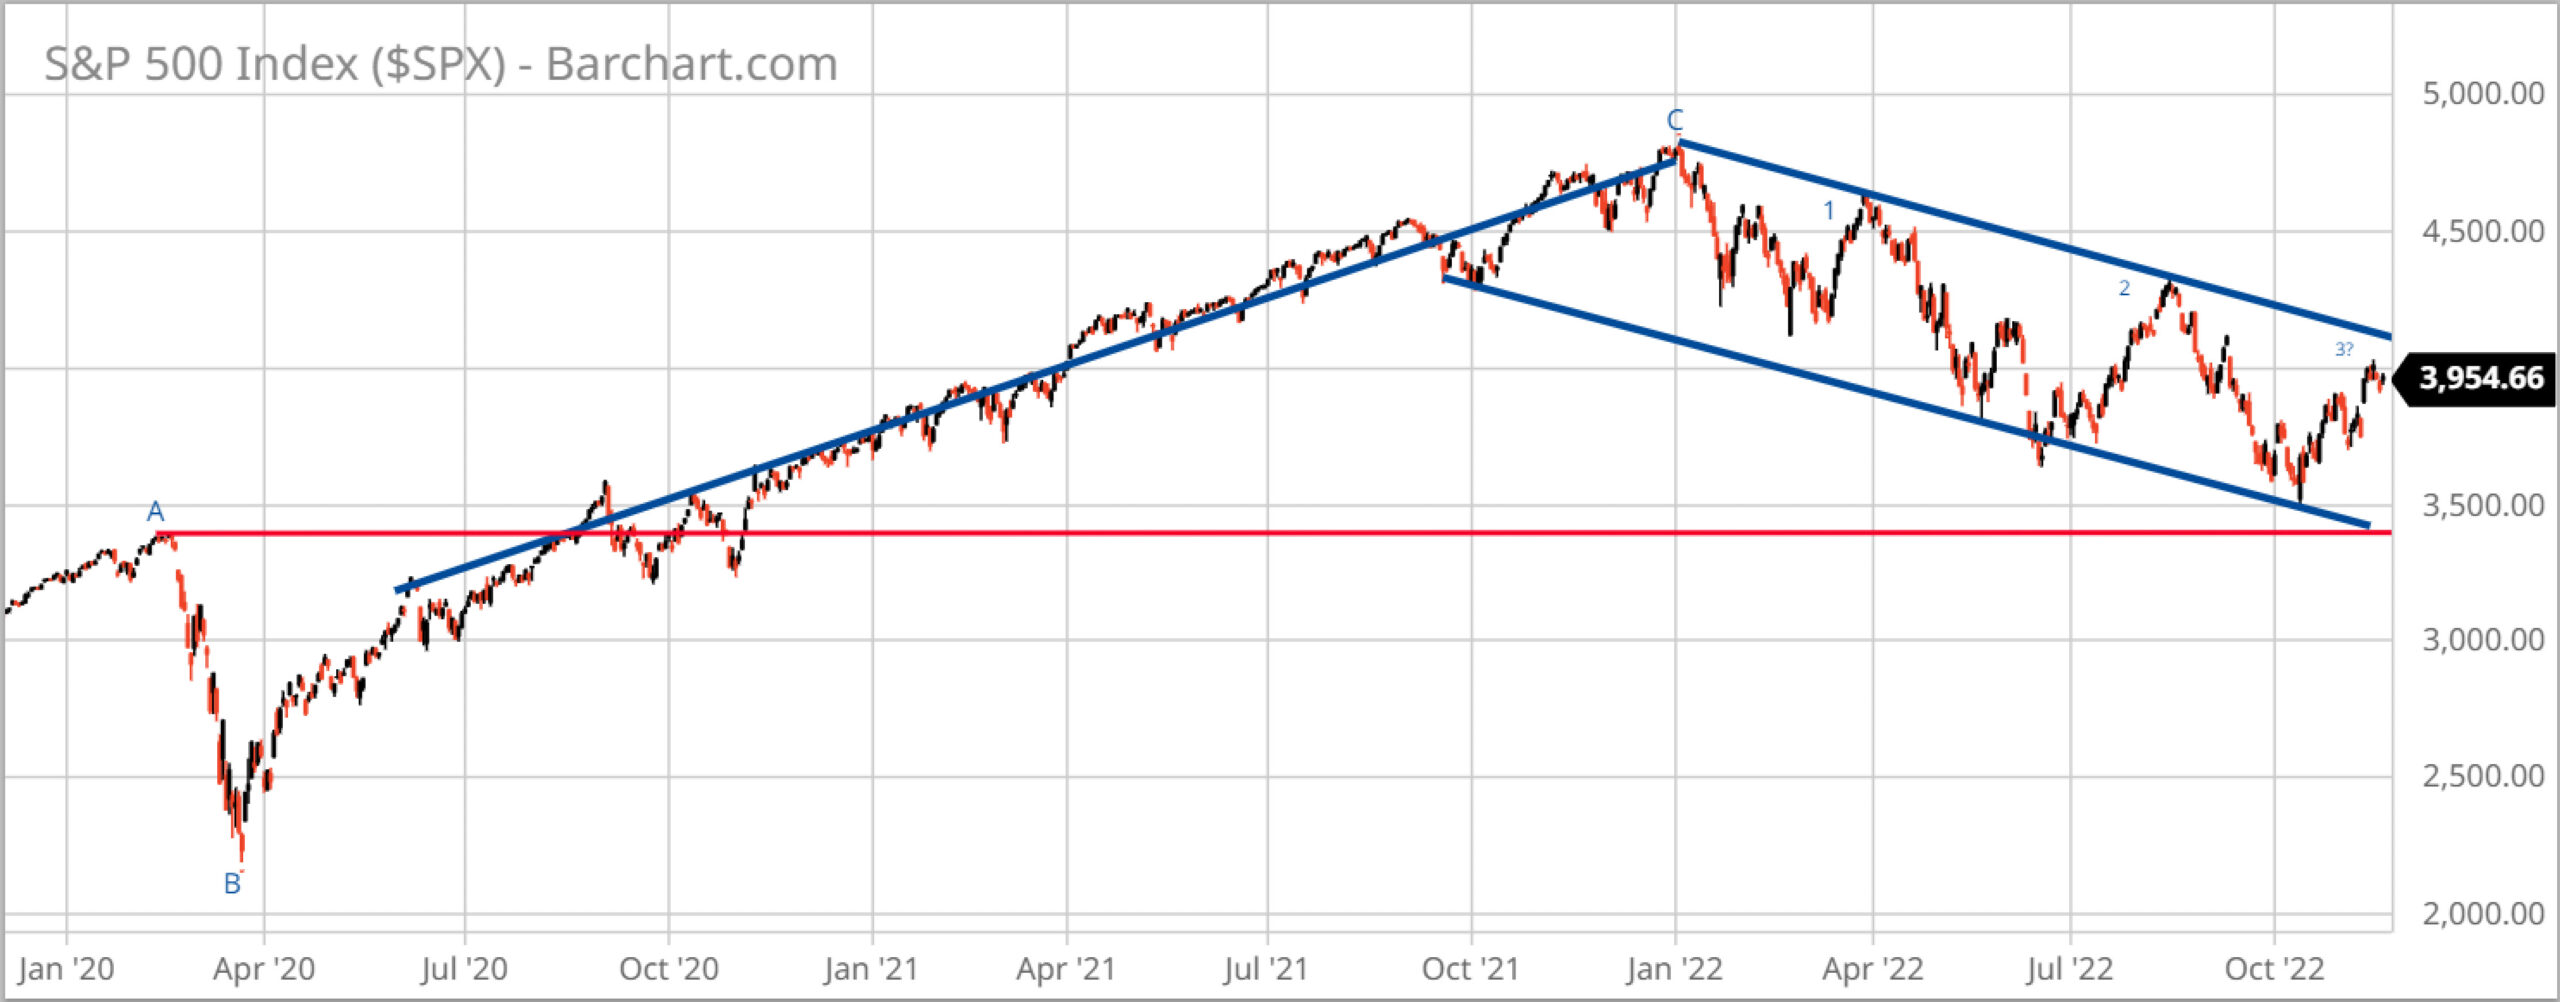
We believe it is important to zoom out to gain a greater perspective and look at the journey the stock market, as measured by the S&P 500, has taken since early-2020 through to early-November 2022, focusing on several timeframes in the chart below. The market was at an all-time high in February 2020, (A), just before Covid-19 lockdowns shook the global economy. The market then fell 33% until it bottomed out on March 23, 2020, (B). The market then steadily rallied to a new all-time high from the Covid-19 low to January 3, 2022, (C), as central banks worldwide intervened and provided massive liquidity through quantitative easing and low interest rates. Ever since the market hit its all-time high in early-January of this year, it has traded in a channel of successively lower highs and lower lows.[xiii]
Is it possible we are currently experiencing the third Bear Market rally since the all-time high in January 2022? Bear Market rallies have been defined as significant counter trend recoveries that can last as briefly as a few weeks to as long as several months before the market reverses course to a new low. The chart below serves to illustrate the concept of a Bear Market rally.
 Source: Barchart.com
While we are encouraged by the stock market’s resilience seen from October into early-November, equities are historically expensive. The total market capitalization of U.S. stocks currently is 153% of U.S. gross domestic product (GDP), almost the same level as the 157% dot-com peak in March 2000, which was right before that bubble burst.[xiv] One overvalued stock, for example, is Apple, Inc. (AAPL). Apple’s stock soared +8% after it reported its recent quarterly earnings results as being slightly better than expected. Apple beat Wall Street analysts’ earnings expectations because of its iMac sales while both its services and iPhone sales disappointed. Apple CEO Tim Cook explained that “silicon-related wafer supply constraints were not significant in the quarter” (microchip shortages ended), and it allowed the company to satisfy back orders and “fill the channel” at resellers and retailers. Between 2008 and 2016, Apple’s price-to-earnings ratio was in a range of 10 to 17 and its compounded annual earnings per share growth rate over that same period was 30%.[xv] Now, it trades at more than 24 times earnings, with analysts expecting only 3% growth in 2023![xvi] Many other technology stocks are similarly overvalued on a historic basis.
We reduced exposure to technology stocks in October in our actively managed strategies before earnings were announced and just recently added back technology exposure in three targeted areas that are all down significantly from their highs: cloud computing, semiconductors, and cyber security.
Year-to-date (through to 10/31/2022), our CIG Dynamic Growth Strategy composite has avoided approximately 44% of the losses of the growth benchmark, and the CIG Dynamic Balanced Strategy has avoided approximately 59% of the losses of the balanced benchmark.[xvii]
We would welcome the opportunity to engage with you — via voice or email — to discuss your questions, and market challenges and opportunities, as well as the benefits of active investment management.