Update from CIG Asset Management: Extremes May Create Opportunities
The stock market rally continues. Through June 13, 2024, the S&P 500 has gained +14.7% year-to-date and we still haven’t seen a single-day decline of over 2% in 479 days, the third longest stretch in the past 25 years. [i] We wrote about this extraordinary winning streak in last month’s update, Where are we now?
This year, some investors who have a diversified portfolio that owns many stocks across many sectors, may feel like they are missing out on the current rally. They may see on CNBC or read in the Wall Street Journal that the market is at its all-time high, yet their own portfolio is not.
Closely examining the following extreme market internals; narrow sector performance, large market cap outperformance and S&P 500 index concentration can help explain what is happening beneath the surface.
Sector performance is narrowing again. In our CIG Asset Management Update on April 1, 2024, we discussed encouraging signs that the stock market rally may be broadening. We may have been early on that call. As you can see in the chart below, month-to-date at June 14, 2024, the technology sector has gained +9.1%, communication services – which is mostly comprised of Meta and Google – advanced +1.7%, and the other nine of the eleven S&P 500 sectors were all down. [ii]
 Chart by CIG Asset Management using data from FinViz
Large market-cap out performance. The S&P 500 index is weighted by market capitalization– that is, the larger the total value of the company, the higher the weighting in the index. It’s currently experiencing historic outperformance versus the equal-weighted S&P 500. In fact, while the S&P 500 – represented by the SPDR S&P 500 ETF Trust (SPY) has advanced +14.6% year-to date through 06/14/2024, the equal-weighted S&P 500 500 – represented by the Invesco S&P 500 Equal Weight ETF (RSP) is only up +4.2%. [iii] .
The following chart shows the relative performance of the market-cap weighted S&P 500 (SPY) versus the equal-weighted S&P 500 (RSP) for the 5-year period ending June 14, 2024. When the blue line is below 1.0, RSP is outperforming SPY. As you can clearly see, this has been a rarity over the past five years.
 Chart by CIG Asset Management using data from Barchart.com.
The slope of the blue line has recently been increasing – this indicates that the outperformance is widening. This tells us that the larger companies are outperforming the smaller companies. What companies are outperforming? The answer is large-cap stocks in the technology sector, and we believe their returns are being driven by the hopes that Artificial Intelligence (AI) will contribute massive revenues and earnings to this sector.
S&P 500 index concentration. On June 9, 2024, Apollo Chief Economist Torsten Slok posted the following chart in The Daily Spark.
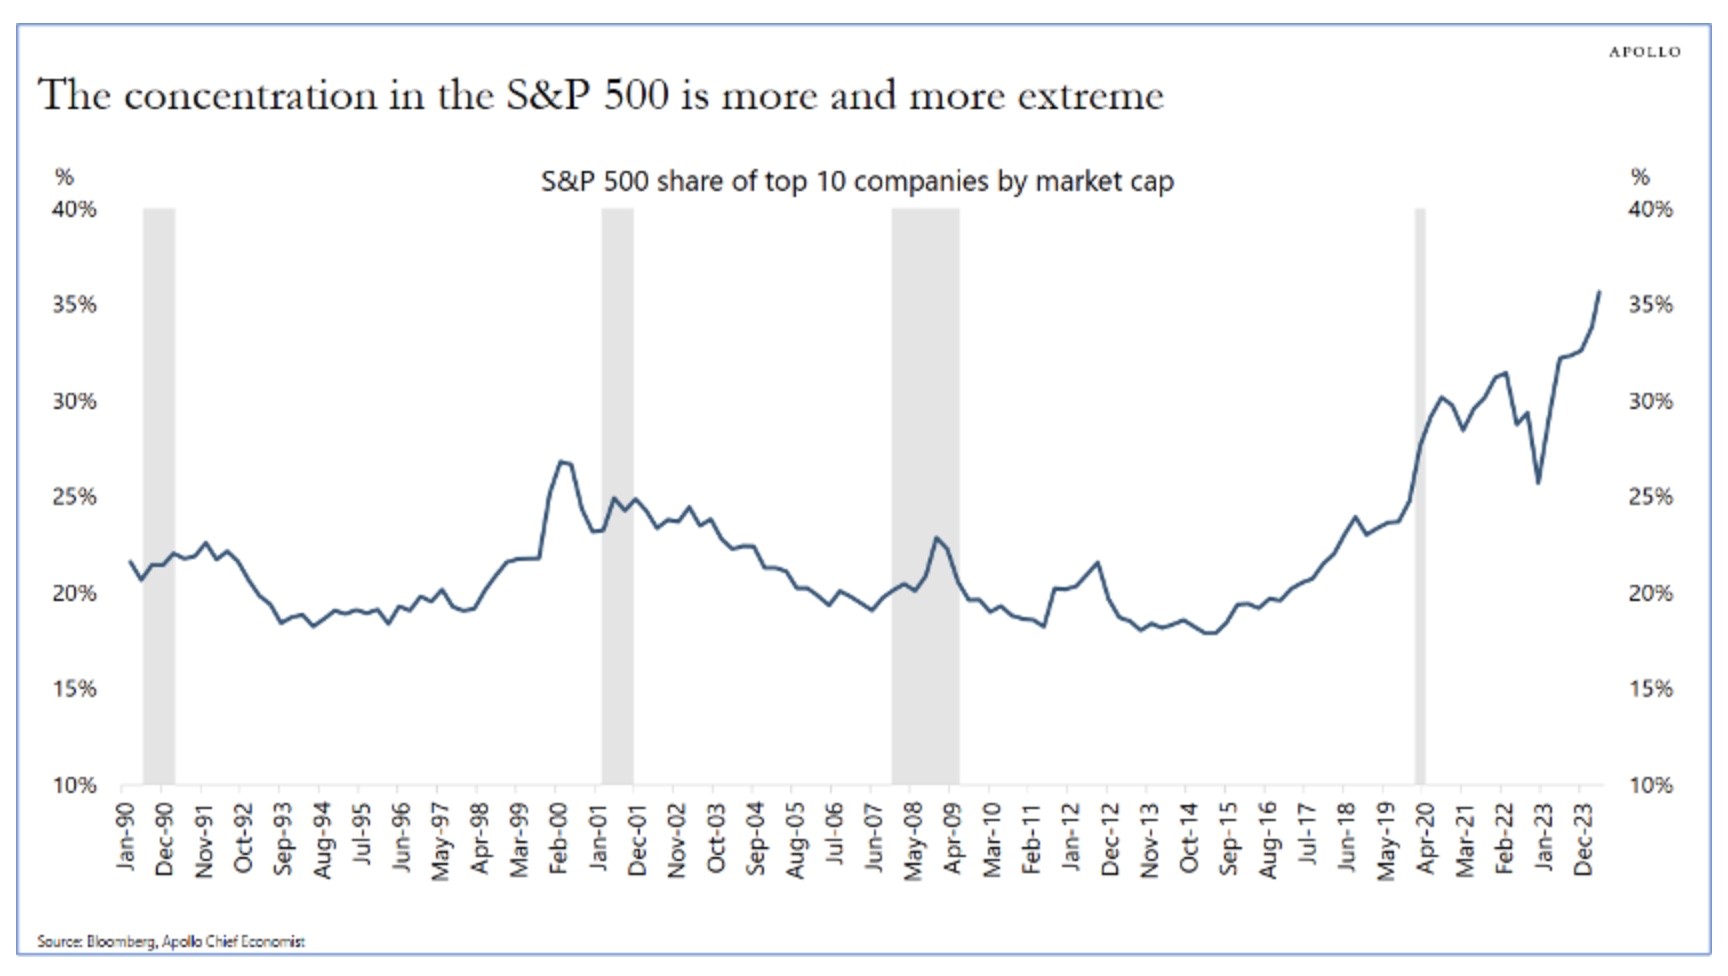 Source: Apollo The Daily Spark 06/09/2024
Currently, ten out of the 500 stocks in the S&P 500 account for over a third of its total value. These high-growth stocks have been major contributors to recent S&P 500 returns. Such extreme concentration is rare. Only three of those ten largest companies are outside of the Technology or Communications sectors: Berkshire Hathaway, Eli Lilly and JP Morgan. [iv] This is great when the top ten are moving higher and add excess returns to the market cap weighted S&P 500 index but can have the opposite effect if the hopes that AI will produce enormous profits for the companies involved does not prove to be true.
Growth versus Value. The following chart shows the ratio of the indexed returns of the Russell 1000 Growth Index and the Russell 1000 Value Index. The Russell 1000 Growth Index is currently outperforming the Russell 1000 Value Index by the biggest margin in decades! As of June 14, 2024, nine of the top ten stocks in the iShares Russell 1000 Growth ETF – which tracks the index – were technology related stocks and were a total of 53%, of the index. [v]
 Source: Bloomberg 06/06/2024
1. Value may once again outperform growth. The significant spike in the year 2000 during the dot-com bubble serves as a historical reference. Right now, we’re witnessing another surge in large-cap technology stocks, which we attribute to an AI bubble. In 2000, after the dot-com bubble burst, value stocks outperformed growth stocks. We’ve strategically positioned our clients’ portfolios to potentially benefit from this trend if the AI bubble deflates.
2 Profit-Taking and Rebalancing: When a sector or set of stocks significantly outperforms, we consider taking profits and rebalancing client portfolios. This can be an attractive exit point. We will look for tax harvesting opportunities as well as we rebalance.
3. Buying Opportunities: Conversely, when a sector or set of stocks underperforms, it may present an opportune entry point. To take advantage of this opportunity, we look to add positions before a sector recovers.
4. Contrarian Approach: Small-cap stocks and value stocks, often overlooked during market extremes, might be particularly appealing to contrarian investors right now. Year-to-date through [June 14, 2024], the Russell 2000 index of small-cap stocks is down -1.0%. [vi]
In navigating these market dynamics, we recognize that extremes can create opportunities. Whether it’s profit-taking, rebalancing, or adopting a contrarian approach, staying informed and maintaining an active management strategy will be crucial. In doing so, we continue to manage diversified strategies for the long run.
Please reach out to Brian Lasher (blasher@cigcapitaladvisors.com), Eric T. Pratt (epratt@cigcapitaladvisors.com) or the rest of the CIG team.
[i] Calculated by CIG Asset Management using data from finance.yahoo.com
[ii] Calculated by CIG Asset Management using data from finance.yahoo.com
[iii] Calculated by CIG Asset Management using data from finance.yahoo.com
[iv] Calculated by CIG Asset Management using data from finance.yahoo.com
[v] https://www.ishares.com/us/products/239706/ishares-russell-1000-growth-etf
[vi] Calculated by CIG Asset Management using data from finance.yahoo.com

CIG Asset Management Update: The Stock Market Rally May Be Broadening
In October 2023, we shared the CIG Asset Management Update: Year-to-Date U.S. Stock Performance in Pictures and we discussed how the Magnificent 7[i], seven mega-cap growth stocks, were driving the returns of the S&P 500.
This outperformance continued through year end as you can see in the December 31, 2023 FinViz heat map below.
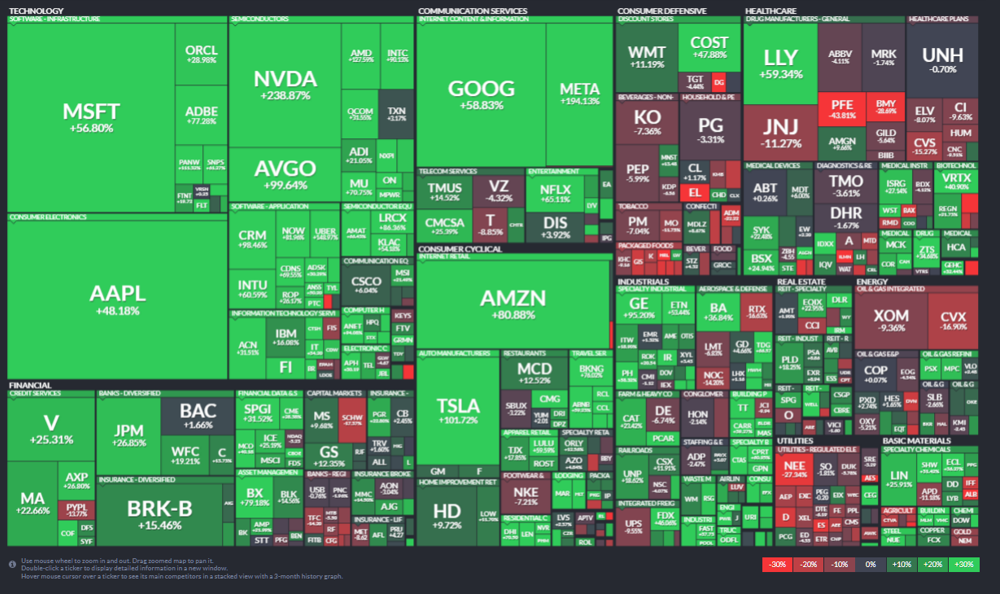
Source: FinViz as of 12/31/2023
In the year, 2023, the Magnificent 7 stocks experienced an average return of +111% while the S&P 500 Index only gained +26%. The Equal-Weighted S&P 500 Index only gained +12%. If you removed the Magnificent 7 stocks from the Equal-Weighted S&P 500 Index, you would have only gained +8%. [ii]
The strong performance of the Magnificent 7 stocks has extended into 2024. As of February 29, 2024, these seven stocks have gained +12.7%, outpacing the S&P 500’s increase of +7.1% and the Equal-Weighted S&P 500 Index’s gain of +3.2%.[iii]
We believe the Magnificent 7 stocks are currently trading at levels considered expensive compared to historical standards. Torsten Slok, Apollo’s Chief Economist, has recently showed that when you compare the median 12-month forward price-to-earnings (PE) ratio of the top ten companies in the S&P 500, which include all of the Magnificent 7 stocks, they are much more expensive now than they were during the tech bubble of the 1990s. [iv]
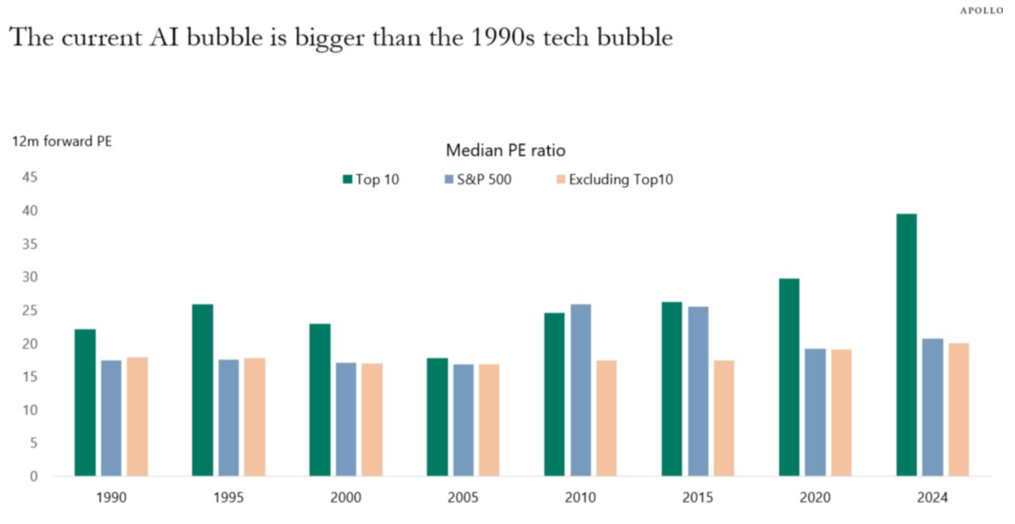
Source:Bloomberg, Apollo Chief Economist. Note: Data as of January 31, 2024.
With that being said, we are seeing some encouraging signs that the stock market rally may finally be starting to broaden out. For the week ended 3/6/2024, we saw four of the Magnificent 7 stocks; Microsoft (MSFT), Apple (AAPL), Alphabet (GOOG), and Tesla (TSLA) move lower as many other stocks outside of the technology sector rose. You can see this in the March 6, 2024 FinViz heat-map below.
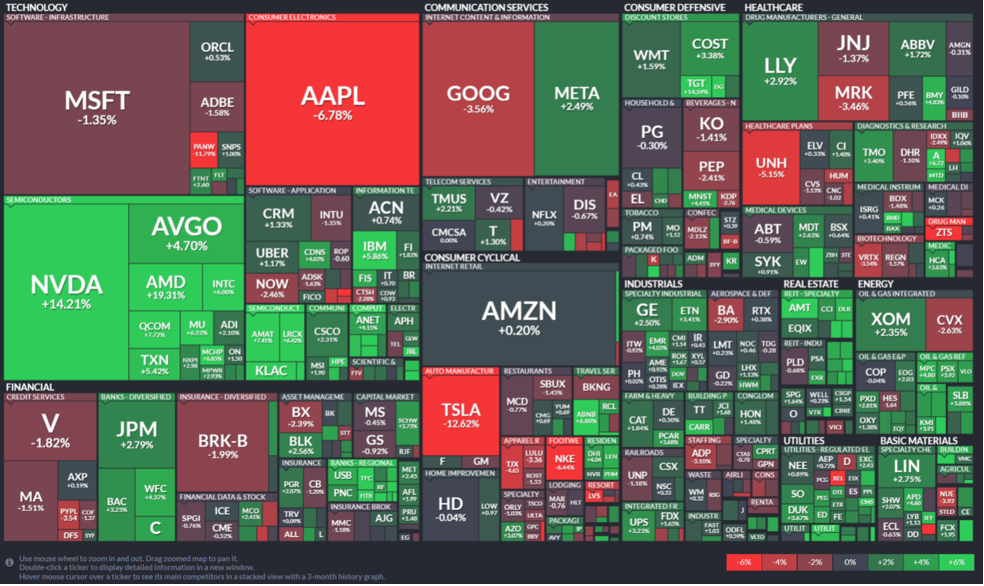
Source: FinViz as of 3/6/2024
While we find it encouraging to see a wider equity market participation, we still believe strongly in the value of diversification. Diversification is not supposed to maximize returns, it is designed to reduce investment risk. A diversified portfolio at times won’t keep up with the market when the bulk of returns are concentrated in a small group of stocks like the Magnificent 7. We strive to diversify our investments amongst industries and sectors, size (large-cap and small-cap), geography, growth versus value and alternative asset classes. Some of these investments are negatively correlated to the stock market – what that means is historically when the stock market traded lower – these investments gained in value. Past performance is not a guarantee of future results, but history helps guide us.
At CIG, we believe in risk-balanced investing. We believe investors should consider how much risk they are taking to achieve returns. We think that we should be striving to reach the return necessary to meet the various needs of our client’s financial plans while, at this point in the market cycle, taking as little risk as possible to meet that goal. We want you to sleep at night.
Please reach out to Brian Lasher (blasher@cigcapitaladvisors.com), Eric T. Pratt (epratt@cigcapitaladvisors.com) or the rest of the CIG team.
This report was prepared by CIG Asset Management and reflects the current opinion of the authors. It is based upon sources and data believed to be accurate and reliable. Opinions and forward-looking statements expressed are subject to change without notice. This information does not constitute a solicitation or an offer to buy or sell any security.
[i] The Magnificent 7 stocks are: Apple (AAPL), Microsoft (MSFT), Alphabet (GOOGL), Amazon.com (AMZN), Nvidia (NVDA), Tesla (TSLA), and Meta Platforms (META)
[ii] https://www.forbes.com/sites/greatspeculations/2024/01/22/2023-in-review/?sh=78aab8bd690b
[iii] Calculated by CIG Asset Management for the Roundhill Magnificent Seven ETF (MAGS) using data from finance.yahoo.com
[iv] The Daily Spark, February 25, 2024 – Apollo Academy

Update from CIG Asset Management Team – Asset Manager Annual Checkup
In an era of consolidation in the wealth management industry, an annual check-up of who is managing your assets is important. With firms like LPL, Wealth Enhancement Group, Stratos Wealth Partners, it raises the question: Who is actually managing your money? Do you know the individuals on the company’s website?
We suggest that you conduct an Asset Manager checkup.
Annual Asset Manager Check Up List
Basics
ü Have you ever talked to the people who directly manage your hard-earned life savings?
ü If so, how often could/do you meet with them?
ü If not, how do they determine my risk tolerance and investment objectives and get to know you?
ü Is your advisor really doing the trades and asset allocation for your portfolio?
Advanced – Is the asset management offering compelling in regard to the following?
ü Performance- How does the strategy perform during up and down periods?
ü Selection- Do they actively manage the portfolio or is it invested in big technology companies all the time?
ü Insight- Is there common sense anchored in factual data, without rosy forecasts like we may often hear on TV?
ü New Ideas- Is there delivery of unique value through compelling theses? For example, Gold or Energy Sector investments at the right time.
ü Diversification- Do they utilize a variety of investments which complement existing illiquid holdings?
ü Trust- Are you going to trust this group to help you through the inevitable difficulties in the market? When risk appetites are high, are they good at restraining your exuberant actions? When risk appetites are low, will you feel comfortable restraining fearful activities and buying low?
At the end of the day, what kind of “ride” or investment experience are they offering you? People don’t retire on %’s but on actual dollars. How did you do in 2022? If you were down, are you back to even with stocks soaring this year?
In our last letter, What’s Your Benchmark, we talked about comparing your investment portfolio to an appropriate benchmark and comparing your investment portfolio’s 3-year risk and return. As of November 30, 2023, our analysis revealed that the CIG Dynamic Balanced Composite achieved a trailing 3-Year annualized return of +2.30%, net of fees. This performance surpassed the Balanced Benchmark’s +1.95% return, all while assuming only half the risk of the benchmark, as indicated by the standard deviation of returns that 3-year timeframe. [i]
In 2023, U.S. stock performance has been largely dominated by the Technology sector and Communication Services sector. [ii]
We believe that many investors are currently experiencing recency bias – the tendency to place too much emphasis on experiences that are freshest in their memory – even if they are not the most relevant or reliable. How quickly investors have forgotten about the very negative returns in 2022!
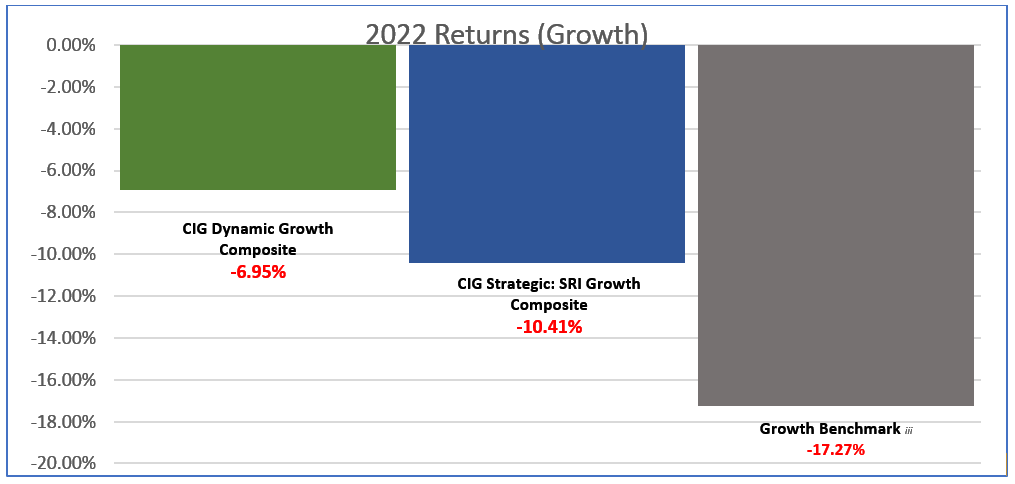
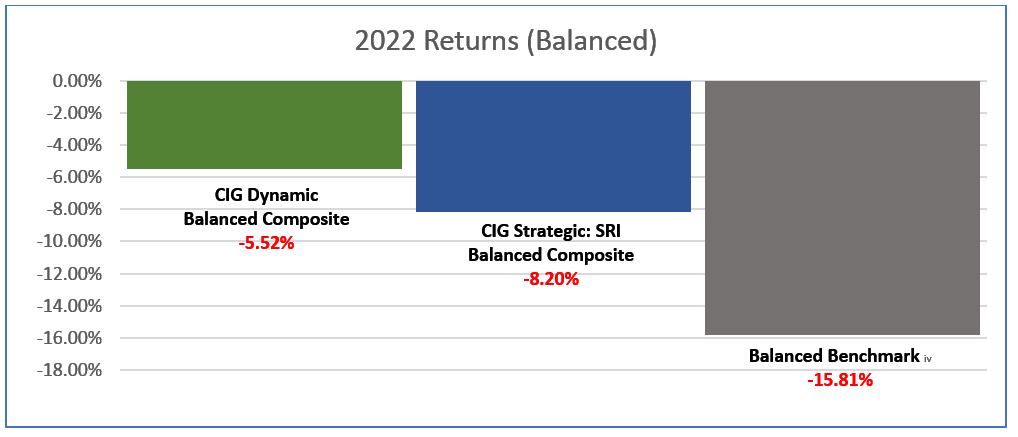
As seen in the two following bar charts, in 2022 at CIG, the CIG Dynamic Growth Composite avoided 60% and the CIG Strategic: SRI Growth Composite avoided 40% of the growth benchmark’s -17.27% loss. Net of fees.[iii] The CIG Dynamic Balanced Composite avoided 65% and the CIG Strategic: SRI Balanced Composite avoided 48% of the balanced benchmark’s -15.81% loss. Net of fees. [iv]
Calculated by CIG Asset Management using data from Tamarac. Represents performance from January 1, 2022, through December 31, 2022. Past performance is not indicative of future results. [v]
Calculated by CIG Asset Management using data from Tamarac. Represents performance from January 1, 2022, through December 31, 2022. Past performance is not indicative of future results.[vi]
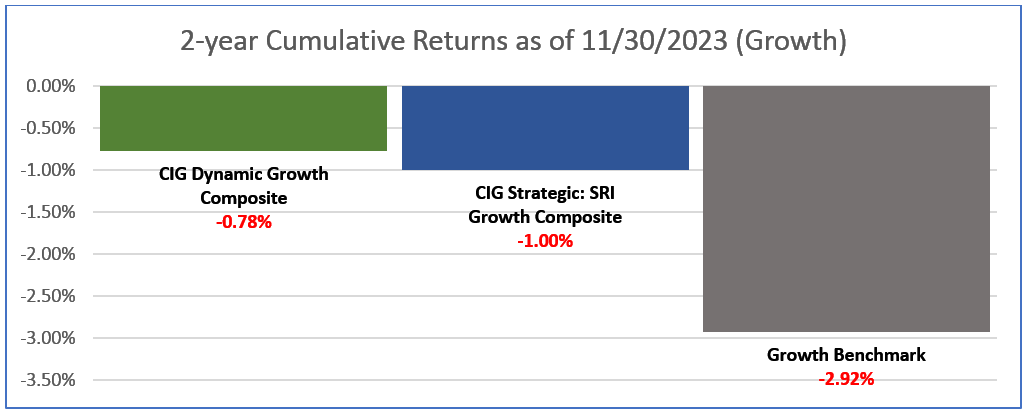
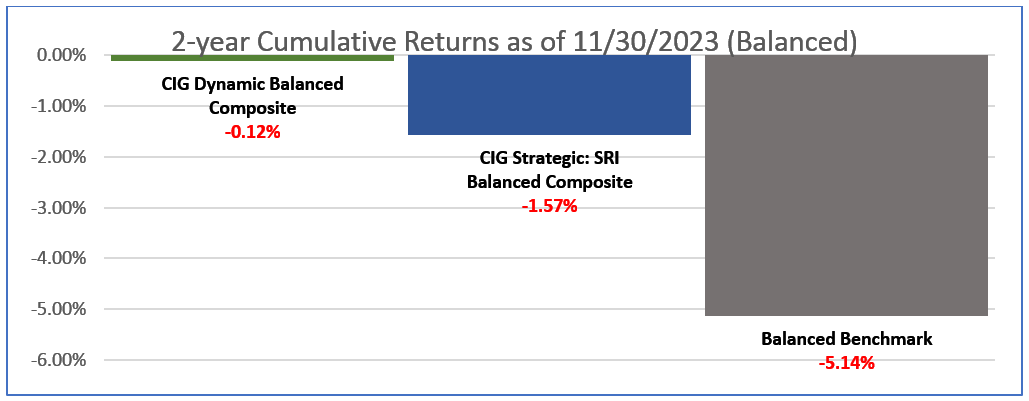
Year-to-date through November 30th, 2023, domestic and international equities along with fixed income have rallied with some significant returns in equities.[vii] As seen in the following two bar charts our CIG growth and balanced composites continue to outperform their respective benchmarks on a 2-year cumulative basis through November 30th, 2023. Net of fees. [viii]
Calculated by CIG Asset Management using data from Tamarac. Represents performance from January 1, 2022, through December 31, 2022. Past performance is not indicative of future results. [ix]
Calculated by CIG Asset Management using data from Tamarac. Represents performance from January 1, 2022, through December 31, 2022. Past performance is not indicative of future results. [x]
As illustrated above, the ride with the CIG composites is smoothed out during volatile conditions and over the two-year period, the CIG composites are much closer to break-even than the benchmarks. For example, the difference as shown above between the Balanced Benchmark and the CIG Dynamic Balanced Composite is +5.02%.
Of course, in addition to portfolio construction, risk and returns, you need to ask if the overall organization that includes asset management is helping you achieve your goals. Your success is about looking at the whole picture:
ü Have they created a plan to help you drive meaningful levels of savings toward your goals?
ü Together, are you executing effective estate, tax, and philanthropy management programs?
ü Do they provide business consulting if you are an entrepreneur and business owner?
You hopefully get a medical check-up each year. What about holistic check of your wealth manager?
At CIG, we believe in risk-balanced investing. We believe investors should consider how much risk they are taking to achieve returns. We think that we should be striving to reach the return necessary to meet the various needs of our client’s financial plans while, at this point in time as described in our two most recent letters, taking as little risk as possible to meet that goal. We want you to sleep at night.
We counsel investors to understand what they are invested in – usually a diversified portfolio – and measure their results with the appropriate diversified, blended benchmark. Life is too short to be frustrated.
If you would like to discuss the results of your annual check or review how much risk that you are taking to achieve your returns, please contact Eric Pratt or Brian Lasher who would be happy to speak with you.
This report was prepared by CIG Asset Management and reflects the current opinion of the authors. It is based upon sources and data that believed to be accurate and reliable. Opinions and forward-looking statements expressed are subject to change without notice. This information does not constitute a solicitation or an offer to buy or sell any security.
[i] Calculated by CIG Asset Management using data from Tamarac and Zephyr
[ii] FinViz.com/map as of 12/28/23
[iii] Calculated by CIG Asset Management using data from Tamarac. The Growth Benchmark is a blend of 60% Russell 3000, 25% MSCI All-Country World ex US and 15% Bloomberg US Aggregate Bond indices.
[iv] Calculated by CIG Asset Management using data from Tamarac. The Balanced Benchmark is a blend of 45% Russell 3000, 10% MSCI All-Country World ex US and 45% Bloomberg US Aggregate Bond indices.
[v] Performance has been attested to by ACA Group for the period August 1, 2018, through December 31, 2022.
Strategy returns are calculated independently on a daily basis and linked geometrically to produce a monthly return. Total investment performance includes realized and unrealized gains and losses, dividends, and interest. Accrual accounting is used to record interest income while dividends are recorded on a cash basis. Trade date accounting is used for calculation and valuation purposes.
Past performance is not indicative of future results.
[vi] Performance has been attested to by ACA Group for the period August 1, 2018, through December 31, 2022.
Strategy returns are calculated independently on a daily basis and linked geometrically to produce a monthly return. Total
investment performance includes realized and unrealized gains and losses, dividends, and interest. Accrual accounting is used to record interest income while dividends are recorded on a cash basis. Trade date accounting is used for calculation and valuation purposes.
Past performance is not indicative of future results.
[vii] Calculated by CIG Asset Management from finance.yahoo.com. YTD – 11/30/23 S&P 500 =20.8%
Bloomberg Agreeable Bond Index- AGG to 1.89%
[viii] Calculated by CIG Asset Management team using data from Tamarac.
Performance has been attested to by ACA Group for the period August 1, 2018, through December 31, 2022.
Strategy returns are calculated independently on a daily basis and linked geometrically to produce a monthly return. Total investment performance includes realized and unrealized gains and losses, dividends, and interest. Accrual accounting is used to record interest income while dividends are recorded on a cash basis. Trade date accounting is used for calculation and valuation purposes.
Past performance is not indicative of future results.
[ix]Performance has been attested to by ACA Group for the period August 1, 2018, through December 31, 2022.
Strategy returns are calculated independently on a daily basis and linked geometrically to produce a monthly return. Total investment performance includes realized and unrealized gains and losses, dividends, and interest. Accrual accounting is used to record interest income while dividends are recorded on a cash basis. Trade date accounting is used for calculation and valuation purposes.
Past performance is not indicative of future results.
[x] Performance has been attested to by ACA Group for the period August 1, 2018, through December 31, 2022.
Strategy returns are calculated independently on a daily basis and linked geometrically to produce a monthly return. Total investment performance includes realized and unrealized gains and losses, dividends, and interest. Accrual accounting is used to record interest income while dividends are recorded on a cash basis. Trade date accounting is used for calculation and valuation purposes.
Past performance is not indicative of future results.

CIG Asset Management Update: Think Different
Summary:
* Best month for the S&P 500 since November 2020[i]
* The Fed raises short-term interest rates +0.75%
* Contrarian thinking and active investing
July 2022 Returns:
Commentary:
U.S. equities, as measured by the S&P 500, were up +9.2%, the best month since November 2020. International Equities were up +5.0%[x]. Fixed income gained +2.4% as measured by the Bloomberg U.S. Aggregate Index.[xi] Gold fell -2.3%[xii] and crude oil lost -6.8%[xiii] as the U.S. Dollar Index gained +1.3%.[xiv]
On Wednesday, July 27, the Federal Open Market Committee raised the Federal Funds Rate (the interest rate at which depository institutions trade federal funds [balances held at Federal Reserve Banks] with each other overnight) by +0.75% to a range of 2.25% to 2.50%.[xv] During the press conference that followed the rate announcement, Federal Reserve Chair Jerome Powell said the Fed had already reached a “neutral” level of interest rates—one that neither boosts nor restricts economic activity. The S&P 500 gained +3.8% from the start of Powell’s press conference at 2:30p.m. July 27 through the close on July 29.[xvi] Many market observers attribute the post-FOMC meeting rally to Powell’s “neutral” comment. Has the Fed already done the heavy lifting? We think not and believe we are not alone in this thinking. Former Treasury Secretary Lawrence Summers said on Wall Street Week, “Jay Powell said things that, to be blunt, were analytically indefensible,” and “There is no conceivable way that a 2.5% interest rate, in an economy inflating like this, is anywhere near neutral.” Mohamed El-Erian, Chief Economic Adviser to Allianz SE and President of Queen’s College, said that “the zip code for neutral is above where we are now.”[xvii]
We have illustrated below just how far behind the curve the Fed currently is in its fight against inflation. In the previous seven tightening cycles, the Federal Reserve raised the Fed Funds Rate to a level higher than the inflation rate, as measured by CPI at that time, to bring prices down. As recently as April 2019, the effective Fed Funds Rate, the volume-weighted median rate, was 2.4% while CPI was up +2.0% year-over-year.[xviii]
July 2022 CPI was up +8.5% year-over-year, while the effective Fed Funds Rate is only 1.68%.[xix] We find it incredulous that with over four times the amount of inflation now versus in 2019 and with the effective Fed Funds Rate lower than it was, that the Fed is at “neutral”. The Fed may very well need to raise short-term interest rates a lot more to combat inflation. If it does, we believe stocks will have a sell off.
Having stock, interest rate, and other views that diverge from the collective wisdom of the market can be quite rewarding. In 1997, Apple Inc. launched the “Think Different” advertising campaign. The slogan was launched shortly after Steve Jobs returned to Apple to counter IBM’s slogan at the time, “Think”, a campaign for their ThinkPad.[xx] Apple’s market capitalization in 1997 was around $2.3 billion[xxi] and grew to $2.6 trillion at the end of July 2022.[xxii] IBM’s market cap in 1997 was around $86 billion[xxiii] and only grew to about $119 billion at the end of July 2022.[xxiv] “Think Different” has been very rewarding for Apple—not because of the slogan, but their strategies. Over that 25-year period, excluding dividends, an investment in Apple grew over +100,000% versus IBM’s +38% growth. Howard Marks, legendary investor and co-founder of Oaktree Capital Management, recently wrote a memo to investors titled, I Beg to Differ.[xxv] Marks’ memo highlighted, among many other things, how active investing and contrarian investing are some of the few ways that investors can achieve better returns than the market. In other words, think different.
Marks’ memo has fortified our investment committee’s approach to the entire investment decision-making process. Here we list nine items that we live by each day.
1. Most investors will have average returns. They may be good or bad, but they will be average.
2. If you are happy with average returns, buy index funds and allocate the same as the respective benchmark.
3. To be above average, one must stray from consensus behavior and do something different. One must over/underweight sectors, asset classes and markets. This is “active investing”.
4. Active investing carries both the risk of below average returns and the potential reward of above average returns.
5. When one departs from the herd of passive index investing, they need to use “second-level thinking” to dig deep to develop their investment strategy.
6. Second-level thinking, as Marks describes it is different, deep, convoluted and complex. It takes into account questions, such as:
a. What is the range of future outcomes?
b. What outcome do I think will occur?
c. What is the probability I’m right?
d. What does the consensus think?
e. How does my expectation differ from consensus?
7. Contrarian thinking can be beneficial at market extremes. To effectively act contrary to the masses one must know what the herd is doing, why it is doing it, why they are wrong and what your solution is.
8. Active investing and contrary thinking carry with it the risk of being wrong in hopes of reaping the reward of being right. An active investor seeks better returns than the herd at risk of falling ehind.
9. Howard Marks says it best, “Unconventional behavior is the only road to superior investment results, but it isn’t for everyone. In addition to superior skill, successful investing requires the ability to look wrong for a while and survive some mistakes.”
The CIG investment committee takes great pride in “Think Different”. We are currently over or underweight sectors, asset classes and markets in an attempt to limit risk while seeking to provide a return to meet our clients’ goals in their financial plans. The following are just a few items that we have a different opinion on than the conventional wisdom of many investors, a group that we call “the herd”.
1. The U.S. equity markets are still historically very overvalued—the herd is “buying the dip”.[xxvi]
2. Markets likely have not priced in an extended Russia/Ukraine conflict or the possibility of a China/Taiwan conflict, even though Blackrock rates the likelihood of both “high”.[xxvii]
3. The Fed raising rates at the fastest pace since 1981 and possible quantitative tightening as we head into a recession will be quite damaging to the economy and stock markets—the herd is already placing bets on the timing of the first interest rate cut.[xxviii]
4. Inflation will remain elevated for longer than most economists forecast—The herd believes inflation has peaked and will rapidly come down and the Fed will stop raising interest rates in the near term.[xxix]
Thinking differently is what allowed us to position our portfolios defensively in 2021 and as a result, year-to-date through July 31, our CIG Dynamic Growth Strategy composite has avoided approximately 54% of the growth benchmark’s losses and our CIG Dynamic Balanced Strategy composite has avoided approximately 61% of the balanced benchmark’s losses.[xxx]
Thinking differently does not mean being universally bearish or bullish about the future. Our thinking differently at CIG is about embedding imagination, like Steve Jobs did at Apple, in repeatable processes. In our case, we assess a wide range of scenarios and possible outcomes which are dependent on the path of critical, potentially life-transformative events to help clients succeed, regardless of how interesting the times are—now or at any point in the future.
We would welcome the opportunity to connect with you via voice or email to discuss how you think (differently) about life… about the markets and the value of active investment management.
This report was prepared by CIG Asset Management and reflects the current opinion of the authors. It is based upon sources and data believed to be accurate and reliable. Opinions and forward-looking statements expressed are subject to change without notice. This information does not constitute a solicitation or an offer to buy or sell any security.
[i] Zephyr: S&P 500
[ii] The Growth Benchmark is a blend of 60% Russell 3000, 25% MSCI All-Country ex U.S. and 15% Bloomberg U.S. Aggregate Bond indices. Sources: CIG, Zephyr, and Morningstar.
[iii] The Balanced Benchmark is a blend of 45% Russell 3000, 10% MSCI All-Country ex U.S. and 45% Bloomberg U.S. Aggregate Bond indices. Sources: CIG, Zephyr, and Morningstar.
[iv] Zephyr: S&P 500
[v] Zephyr: Bloomberg U.S. Aggregate Bond
[vi] Zephyr: MSCI EAFE Net
[vii] Zephyr: MSCI Emerging Markets Net
[viii] Calculated using data from finance.yahoo.com
[ix] Calculated using data from finance.yahoo.com
[x] Zephyr: MSCI EAFE net
[xi] Zephyr: Bloomberg U.S. Aggregate
[xii] Calculated using data from finance.yahoo.com
[xiii] Calculated using data from finance.yahoo.com
[xiv] Calculated using data from finance.yahoo.com
[xv] https://www.cnbc.com/2022/07/27/fed-decision-july-2022-.html
[xvi] Calculated by CIG using data from finance.yahoo.com
[xvii] Bloomberg News 07/29/2022
[xviii] Data from https://fred.stlouisfed.org/
[xix] https://fred.stlouisfed.org/
[xx] https://www.forbes.com/sites/onmarketing/2011/12/14/the-real-story-behind-apples-think-different-campaign/?sh=5f33405062ab
[xxi] https://www.thestreet.com/apple/stock/1980-to-now-the-journey-of-apples-market-cap#:~:text=Apple’s%20market%20cap%20in%201997,been%20on%20the%20IPO%20day.
[xxii] https://finance.yahoo.com/quote/AAPL?p=AAPL&.tsrc=fin-srch
[xxiii] https://www.nytimes.com/1997/05/14/business/10-years-later-ibm-sets-a-new-high-in-a-changed-market.html
[xxiv] https://finance.yahoo.com/quote/IBM/?p=IBM
[xxv] https://www.oaktreecapital.com/insights/memo/i-beg-to-differ
[xxvi] https://finance.yahoo.com/news/stocks-down-not-jim-cramer-153941061.html
[xxvii] https://www.blackrock.com/corporate/literature/whitepaper/geopolitical-risk-dashboard-july-2022.pdf
[xxviii] https://www.marketwatch.com/story/nouriel-roubini-says-investors-are-delusional-if-they-expect-the-fed-to-cut-rates-next-year-11660665215?mod=markets
[xxix] https://www.wsj.com/articles/the-markets-peak-inflation-story-fights-the-fed-11660225446
[xxx] Calculated by CIG
Image: CreativaImages/iStock

Making Use of Cash Flow Projections
When you manage your medical practice’s cash flow effectively, you can better prepare your practice for both strong and weak economic times. The key to managing cash flow is the cash flow projection — a forecast of your practice’s cash receipts and expenditures. A cash flow forecast shows the anticipated flow of money entering and […]
Marketing Your Medical Practice
Your patients are becoming more responsible for paying for their healthcare costs due to High Deductible Health Plans. As a result, they are researching their options in terms of treatment and providers. Therefore, it is imperative for practices to pay attention to how they are perceived by these potential “customers”. When marketing your medical practice. […]
Importance of Budgeting for Private Medical Practices
Budgeting for Private Medical Practices As in any other business, a budget can be an important management tool for a private medical practice. A budget is a way for you to measure and keep track of both revenues and expenses. Budgeting for private medical practices helps you identify and fix any inefficiencies in your […]
Finding your medical practice’s optimal staffing level
If your practice has too few staff members, patient care may suffer and collections may slow down. If you have too many, you’ll face rising operational costs. Is there an optimal level that will allow you to operate your practice efficiently without letting your costs get out of control and creating dissatisfaction among patients? Start […]
The role of technology in value-based care
In recent years, the healthcare industry has trended to value-based care, an approach that aims to deliver higher quality care more efficiently and with better patient outcomes. This has a meaningful impact on the way patients receive care as well as how providers are paid, leading many providers to evaluate how they operate. Technology, in […]
Expanding by buying another practice: What you should know
For some time, you have thought about expanding your private medical practice. However, you haven’t taken things much further because the right opportunity hasn’t appeared. Now, a nearby practice has been put on the market and it looks like it would fit in perfectly with your plans for expansion. Before you make an offer, though, […]

