
CIG Asset Management Review: What If the Bubble Bursts?
Summary:
* US Equities surge while international equities lag
* Tesla and the growing stock market bubble
* What happens when a bubble eventually bursts?
Commentary:
The S&P 500 index gained +7.01% in October, bouncing back from its September decline and closing at an all-time high.[i] Overseas markets were up, but much less so versus the U.S., with the MSCI EAFE net index up +2.38% and the MSCI Emerging markets up +0.93%.[ii] Fixed income did not offer much in the way of returns for the month with the Bloomberg US Agg Bond Index falling -0.03%.[iii] Crude oil added to September’s gains, increasing +11.38% and closing at $83.57/barrel, a 7-year high[iv], despite global growth forecasts being revised lower.[v]
We continue to be concerned that U.S. equity markets may be in a bubble. Tesla, for example, gained +44% in October.[vi] In just 2 weeks, the company gained $310 billion in market capitalization. That gain is more than the market cap of 482 companies in the S&P 500 Index.[vii] Tesla’s current market cap is over $1.2 trillion, greater than the market capitalization of Toyota, VW, Daimler, GM, Ford, BMW, Honda and Hyundai combined![viii] Tesla isn’t the only stock that may currently be overvalued.
When we look at the market using several different measuring sticks, we find more extreme valuations. The Buffet Ratio, which we have talked about before and measures total market capitalization to U.S. GDP, is at 215.5%, double the 107.5% seen in May 2007, right before the Great Financial Crisis and 50% higher than the March 2000 dot com boom high of 142.9%.[ix] The current Shiller PE ratio for the S&P 500 is 40.09. The only other time that we saw the market trade at such a high price to earnings ratio was during the dot com bubble, when the S&P 500 traded above 40x from January 1999 through September 2000.[x] No one can predict with any degree of certainty just how much larger the current bubble can get or how long it may last, but we must take note of what has happened when previous bubbles finally burst.
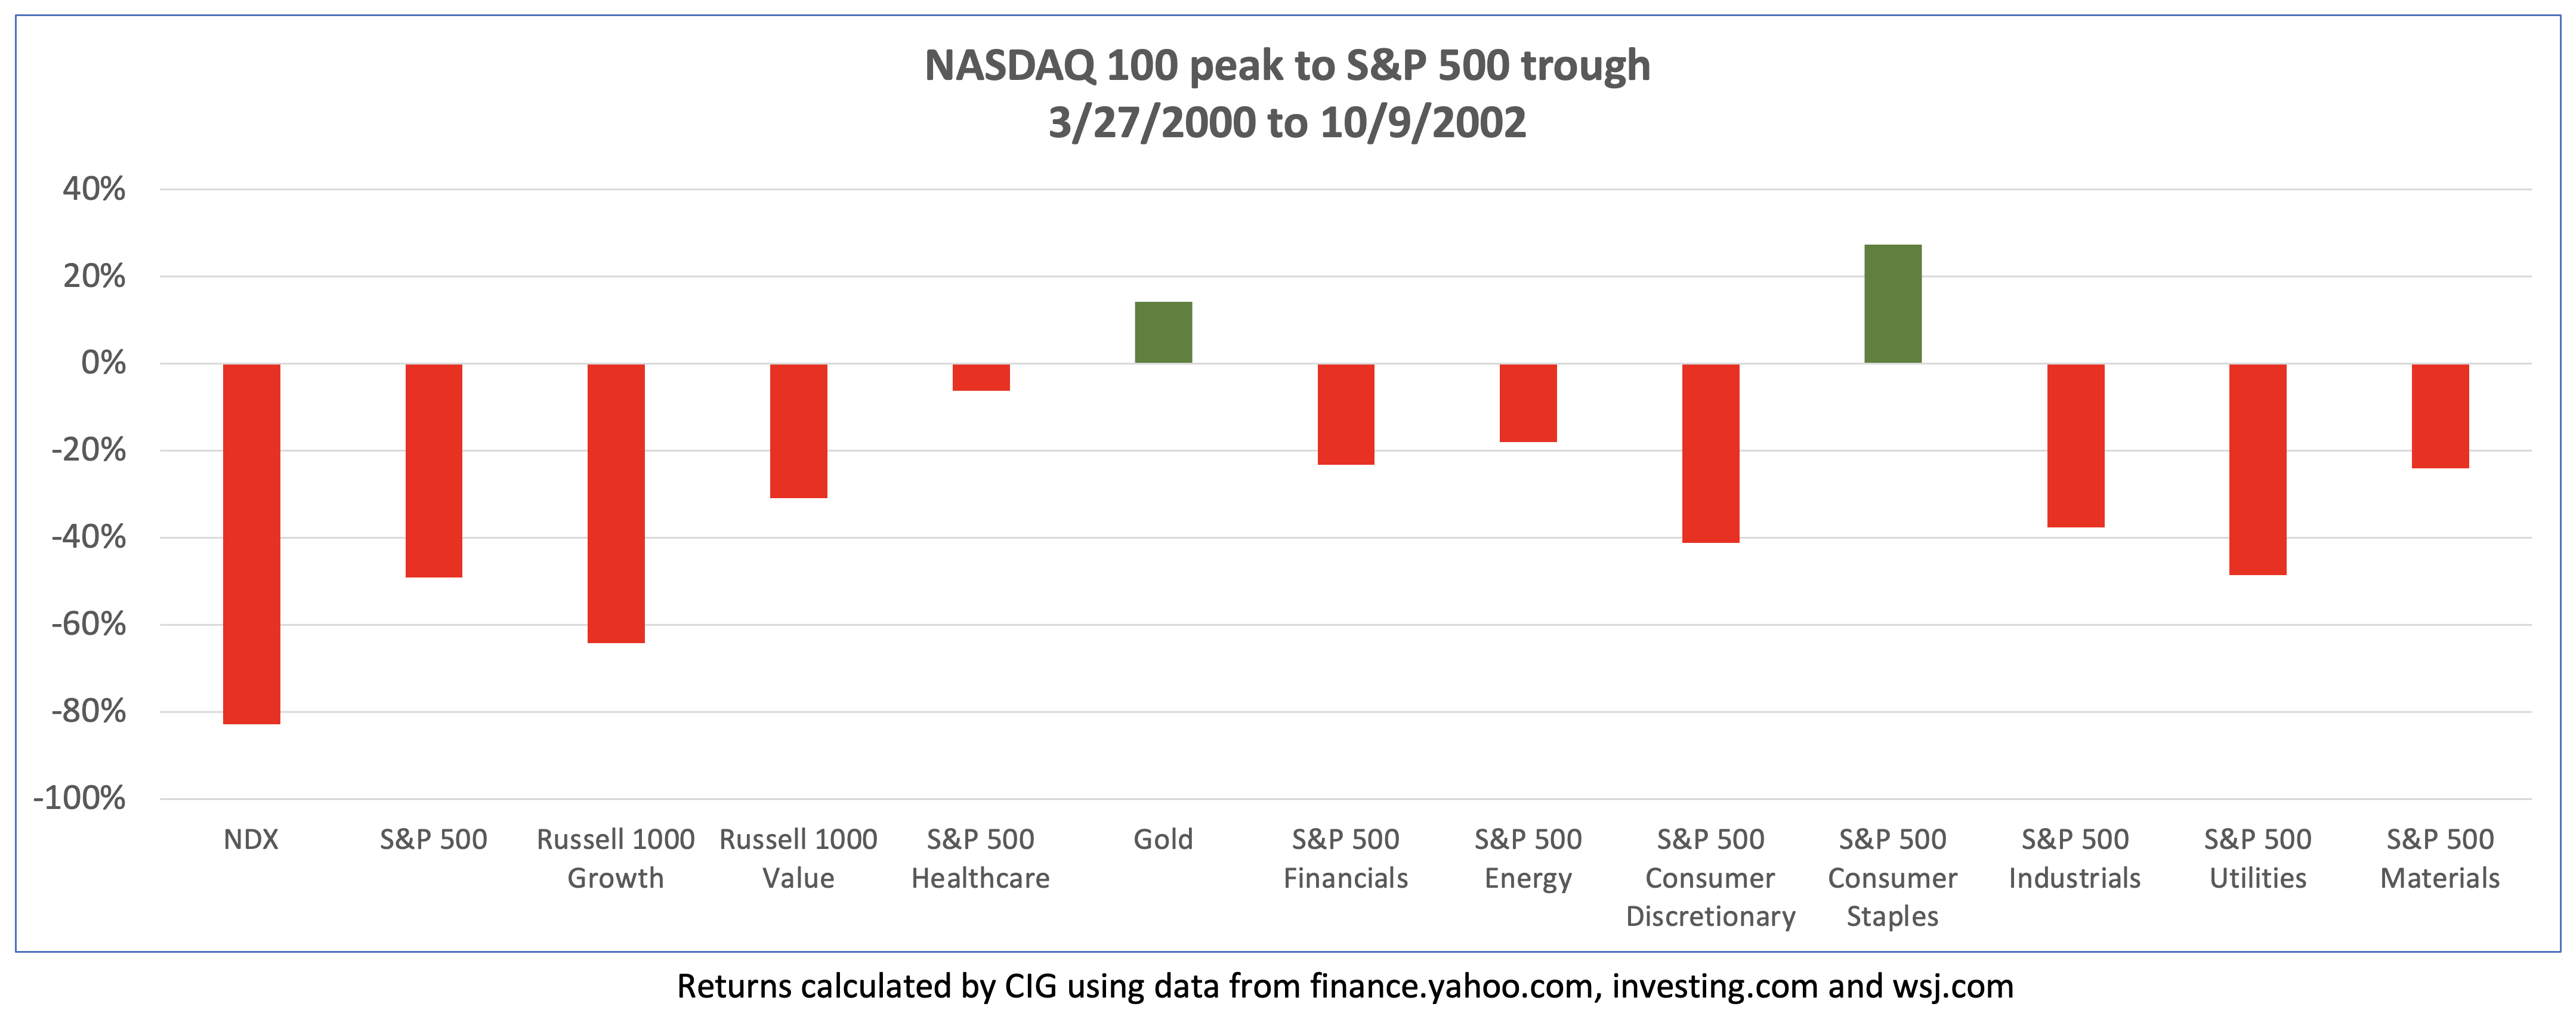
How bad can things get when a stock market bubble bursts? During what was, prior to now, the largest stock market bubble, the dot com boom, the NASDAQ 100 hit its then all-time closing high on March 27, 2000. The broader market, as measured by the S&P 500, did not reach the bottom until October 9, 2002 with a peak to trough loss of -49%.[xi] As illustrated in the chart below, a lot of money was lost in different sectors and factors during this period while gold and consumer staples, which clients currently have exposure to, gained.
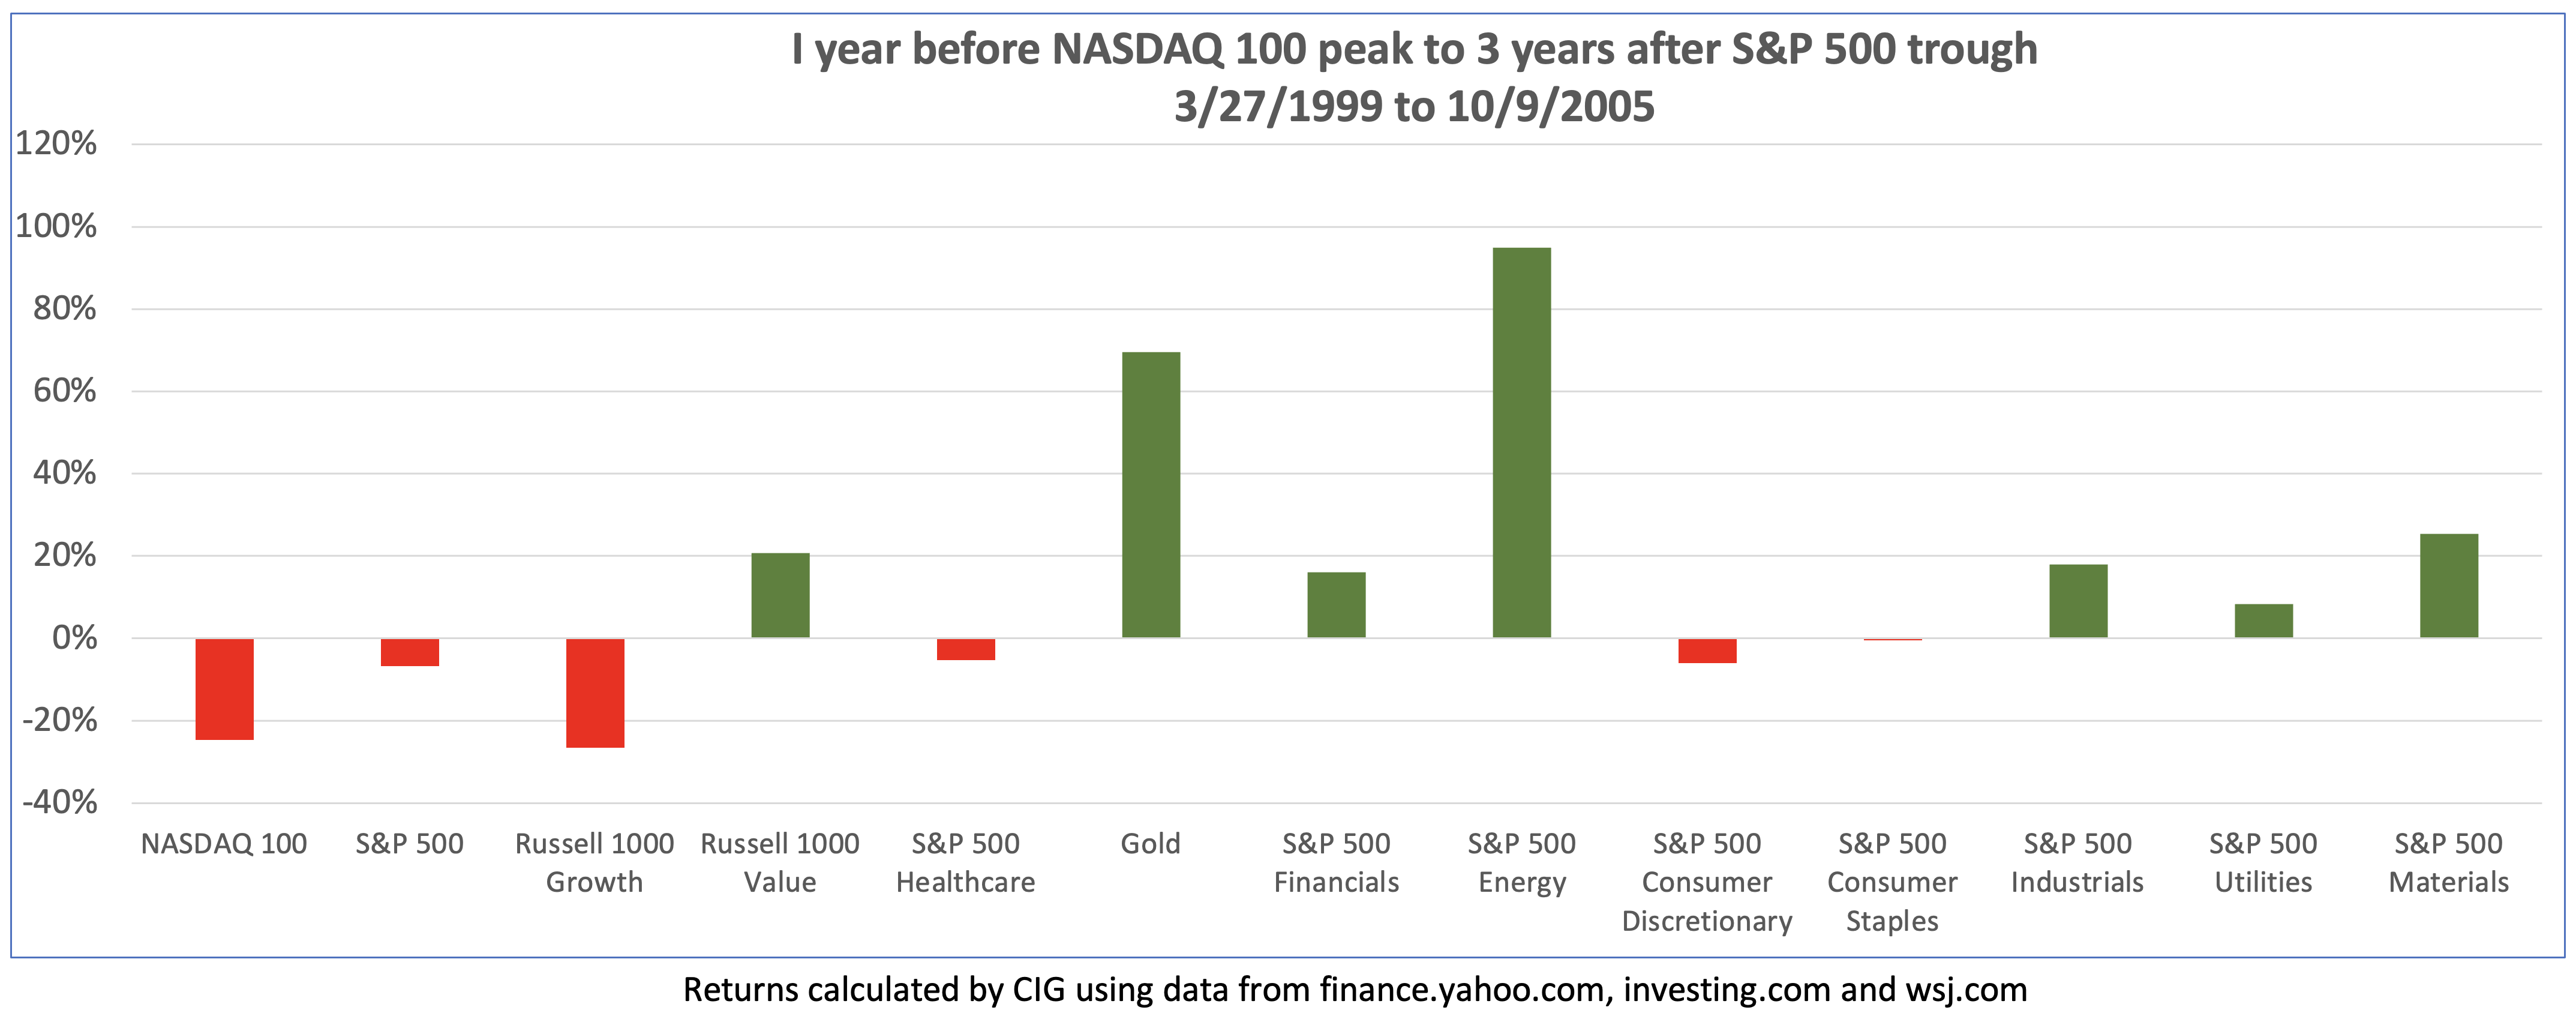
An investor would have to be extremely unlucky to buy at the top and sell at the bottom. What do returns look like if you bought one year before the top, on March 27, 1999 and held on for three years after the bottom, October 9, 2005? The S&P 500 was down -6.8%, and the NASDAQ 100 lost -24.7%. Notably, gold, energy, financials, industrials, utilities, materials, and value stocks were up.
As seen in the chart below, it took just over 7 years for the S&P 500 to get back to its March 27, 2000 high (from point (1) to point (2)). Just months after the market had recovered, the Great Financial Crisis began, and the market did not bottom out again until March of 2009. The S&P 500 did not fully recover until March 4, 2013 (point (3)). If you bought the S&P 500 on March 27, 2000, you had a very brief amount of time in 2007 to get out even, or you had to wait until March 2013 to recoup your losses, just under 13 years after the dot com peak![xii] “Do you have enough time?” was the title of a recent Asset Management Insight.
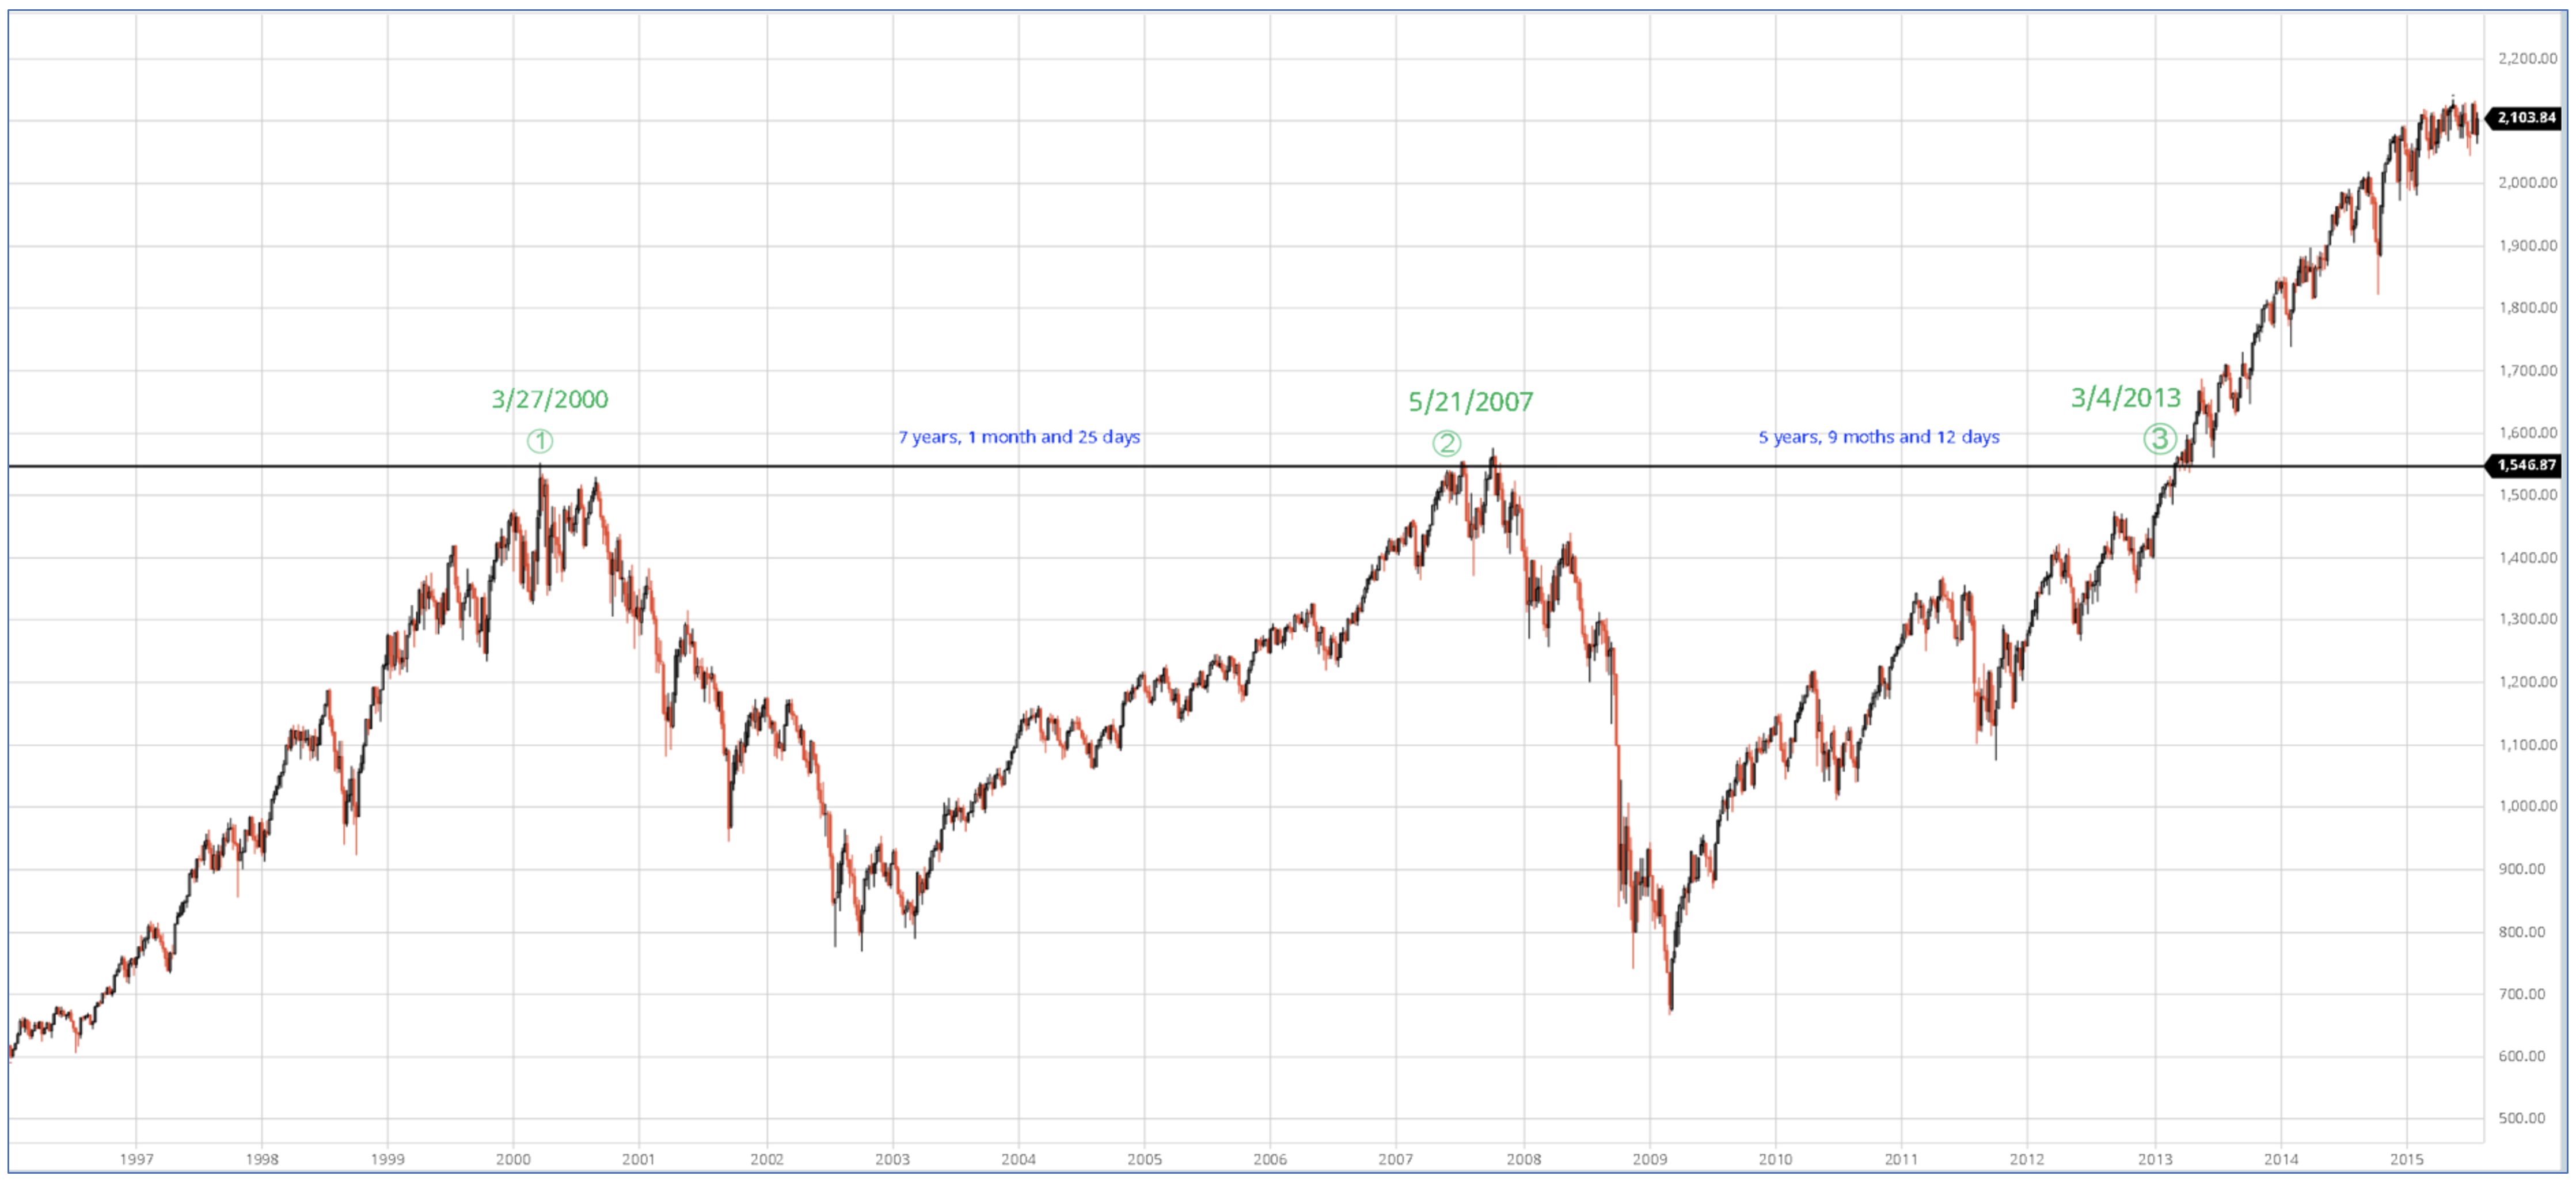
Source: barchart.com
During the dot com bubble in 1999 to 2000, many investors believed that traditional valuation metrics such as price to earnings and price to sales no longer mattered. “This time is different” was a phrase often used. During the pre-Great Financial Crisis housing bubble many believed again, “this time is different”, no money down mortgages and other financial innovations would forever change the way assets were valued, and residential real estate has never gone down on a country-wide basis. Ultimately, traditional valuation methods won out and both bubbles burst.
History has taught us to be very careful. We continue to stay the course of risk balanced investing – take enough risk to reach your goals but not much more. We remain focused on striking the right aggressiveness versus defensiveness in client portfolios given the evolving uncertainty in the markets and the economy.


CIG Asset Management Review: Market Unknowns
Summary:
* S&P 500 declined for the first month since January 2021
* Increasing economic and geopolitical uncertainty
* Market volatility rising
* Do we know?
Commentary:
The S&P 500 index fell -4.65% in September, its first monthly decline since January 2021 and the worst monthly decline since March 2020.[i] In overseas markets, the MSCI EAFE net index declined -3.19% and the MSCI Emerging markets fell -4.25%.[ii] Chinese stocks, represented by the SSE Composite Index, gained +0.68%[iii] and was one of the very few equity markets with positive performance for the month. Fixed income did not offer much protection against the decline in stocks as the Bloomberg US Agg Bond Index fell -0.87%.[iv]
What changed in the month of September? Economic and geopolitical uncertainty appears to have increased.
On September 3rd, the Federal Reserve Bank of New York issued a suspension notification for Nowcast, its official forecast for growth in the U.S. Gross Domestic Product (the total value of goods produced and services provided during one year) stating the following, “The uncertainty around the pandemic and the consequent volatility in the data have posed a number of challenges to the Nowcast model. Therefore, we have decided to suspend the publication of the Nowcast while we continue to work on methodological improvements to better address these challenges.”[v] Upon hearing this announcement, we were reminded of Yogi Berra, the great baseball player and sometimes philosopher who once said “It’s tough to make predictions, especially about the future.”[vi]
Later in the month, Federal Reserve Chairman Powell held a very unconvincing press conference after the FOMC meeting on September 22. Regarding inflation, Powell said the current inflation is “a very modest overshoot. You’re looking at 2.2[%] and 2.1[%], you know, two years and three years out. These are very, very – I don’t think that households are going to, you know, notice a couple of tenths of an overshoot.”[vii] Did investors notice on September 23 that the National Association of Realtors’ August existing homes sales report showed that the median sales price of existing single-family homes in the U.S. rose +14.9% year over year to $356,700?[viii] Did investors notice that the price of U.S. natural gas hit a 12-year high of 6.325 as of October 5, 2021?[ix]
Chairman Powell also said the current inflation is a “reflection of bottlenecks and shortages that…seem to be going to be with us at least for a few more months and perhaps into next year.” As of September 24, there were 600 large container ships waiting to dock at ports in Asia, Europe, and North America. In June there was an average 14-hour delay of ships arriving to Canadian and U.S. ports. Now the delay is almost 10 days![x] There is not much in the way of historical data regarding the current world-wide supply chain issues. But, as the Drewry World Container Index chart below shows, shipping prices have more than doubled year to date.
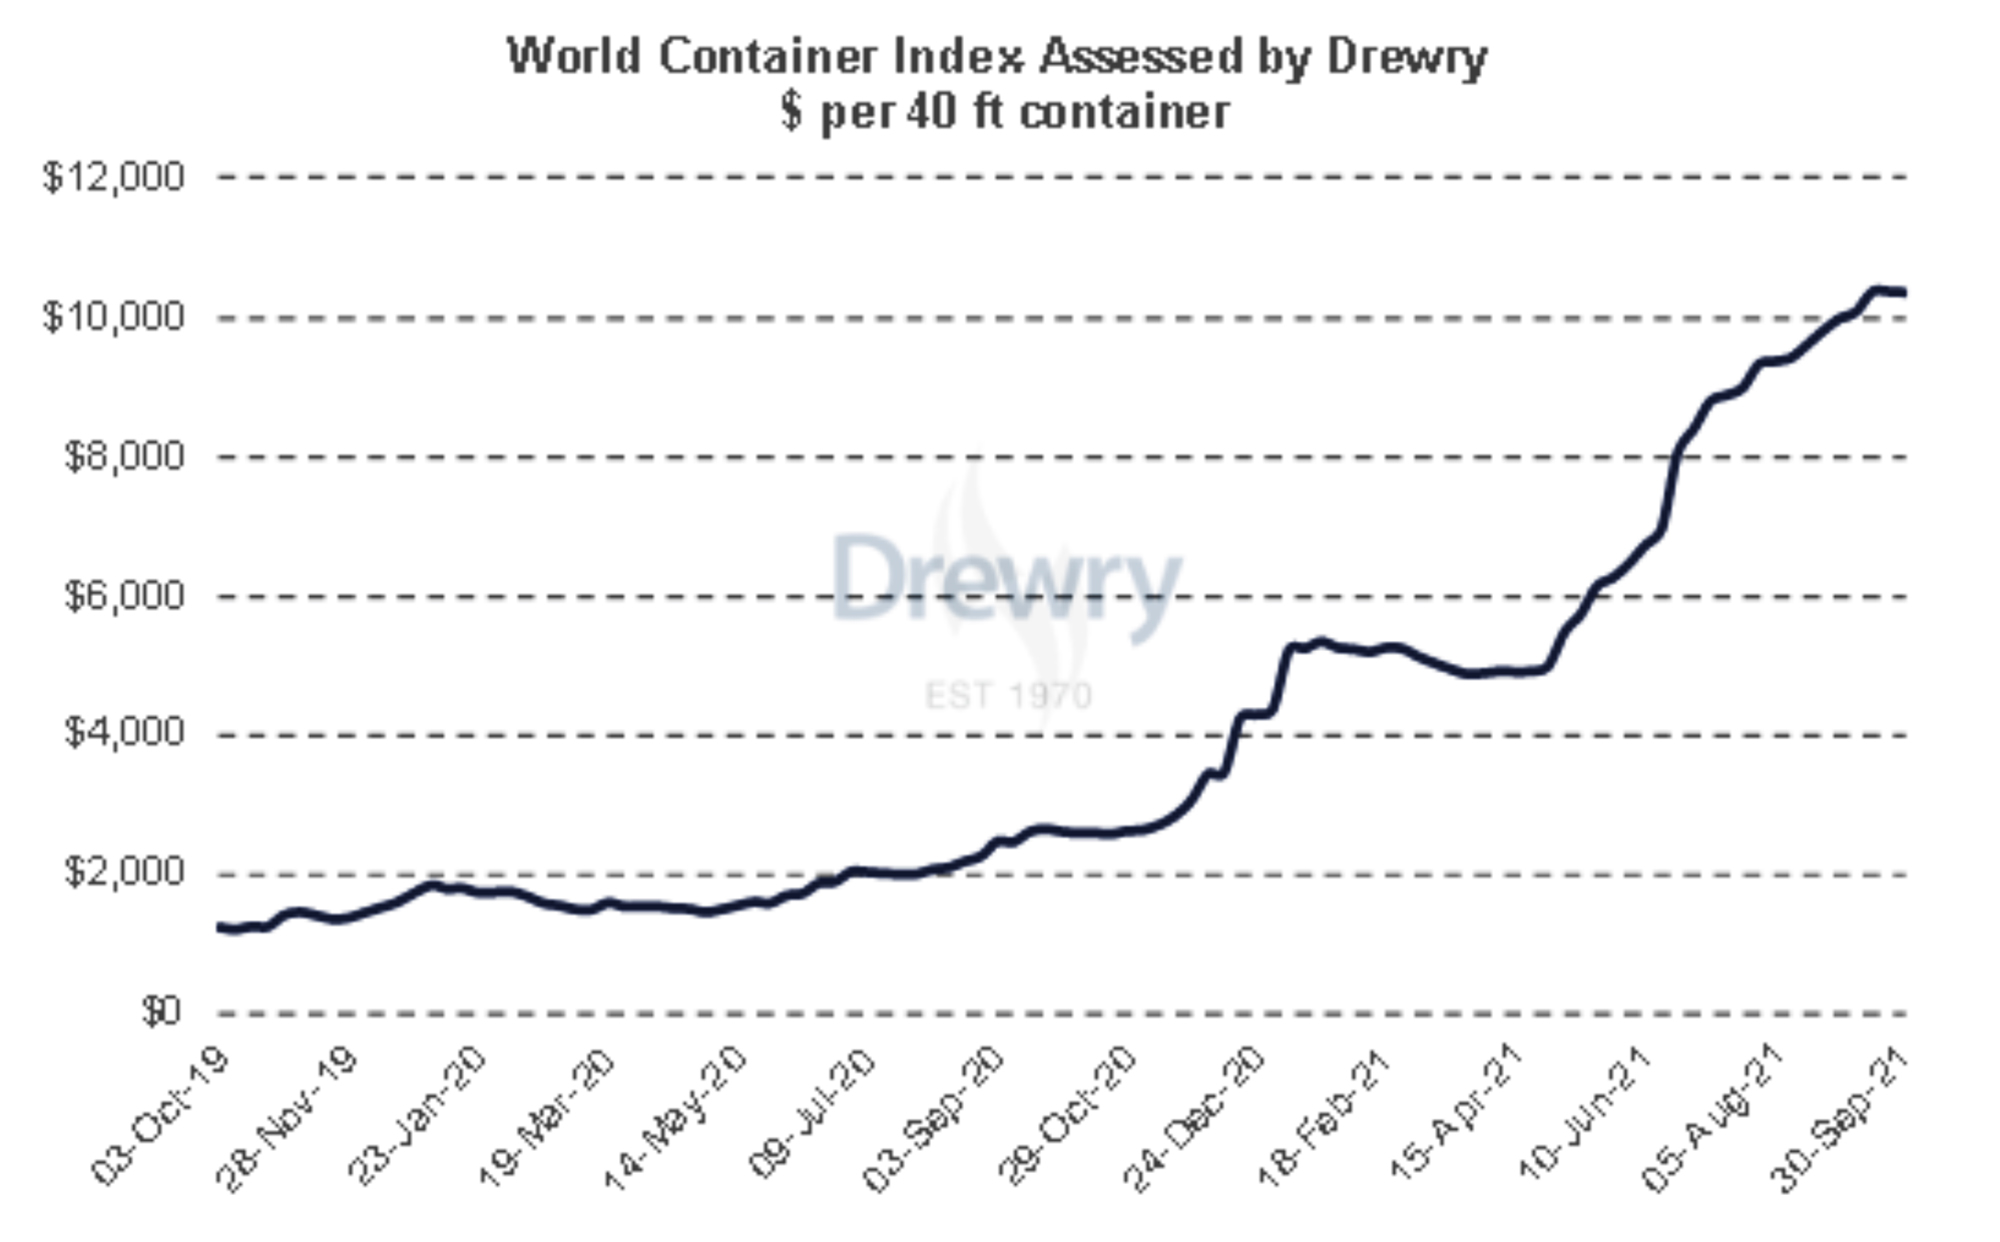
Source: Drewry.co.uk
Actionable idea: buy your year-end holiday gifts early and locally.
To make things worse, tensions with China are growing and Taiwan is extremely important to the world economy. Semiconductor companies in Taiwan generated almost 65% of global revenues from outsourced chip manufacturing in the first quarter of 2021. Taiwan Semiconductor (TSMC) alone accounted for 56% of global revenues. Most of the 1.4 billion smartphone processors are made by TSMC.[xi] On Friday, October 1, as China celebrated the National Day of the People’s Republic of China, the People’s Liberation Army (PLA) flew 38 warplanes into Taiwan’s air defense identification zone (ADIZ). October 2 saw 39 planes and on October 3, 16 more planes entered the ADIZ. On October 3 the United States State Department issued a statement urging Beijing to “cease its military, diplomatic, and economic pressure and coercion against Taiwan.” China responded on Monday, October 4, by sending a record 56 Chinese warplanes into the ADIZ.
We do not know i) how much GDP will grow next year, ii) whether supply chain issues will abate soon, or iii) if China and the U.S. will lower tensions. This economic and geopolitical uncertainty appears to be contributing to stock market volatility. Historically we have observed that usually when volatility increases by a large margin, stock markets head lower. In market terms, it has been a long while since we had such volatility.
Meanwhile equity markets are near record highs and record valuations. So, we continue to stay the course of risk balanced investing – take enough risk to reach your goals but not much more. We remain focused on striking the right aggressiveness versus defensiveness in client portfolios given the evolving uncertainty in the markets and the economy.


CIG Asset Management Review: Risk Happens Fast
Summary:
* S&P 500 advances for seventh month in a row
* Strong corporate profits and the Fed’s not tapering yet
* A long time without a 5% pullback
Commentary:
The S&P 500 index rose for the seventh month in a row, gaining +3.0% in August[i]. Growth stocks continued July’s outperformance over value stocks with the Russell 1000 Growth Index up +3.7%[ii] while the Russell 1000 Value Index advanced +2.0%[iii] last month. Small-capitalization stocks as measured by the Russell 2000 Index gained +2.2%[iv]. Overseas, MSCI Emerging Markets led, rising +2.4% while developed stock markets, measured by MSCI EAFE net, gained +1.5%[v]. Chinese stocks, as represented by the SSE Composite Index, recovered a portion of July’s -5.4% drop, gaining +4.3% in August[vi].
On August 26, the U.S. Bureau of Economic Analysis (BEA) released its updated estimate for second quarter 2021 gross domestic product. The data in the report was encouraging, showing the economy grew at a +6.6% annual growth rate. Delving deeper into the report, second quarter growth in corporate profits was +9.2% which is even better than the +5.1% growth seen in the first quarter. Domestic corporate profits are now above their 2019 pre-pandemic peak.[vii] Historically, strong growth in profits leads to increased capital spending, wage increases and job creation.
Federal Reserve Chairman Jerome Powell spoke at the virtual Jackson Hole symposium on August 27. Investors were looking for a signal for when the Federal Reserve would begin tapering the purchase of at least $120 billion per month of bonds and they appeared to be encouraged by his comments, inferring that a taper was not imminent. Powell said, “We have much ground to cover to reach maximum employment,” and “The timing and pace of the coming reduction in asset purchases will not be intended to carry a direct signal regarding the timing of interest rate liftoff, for which we have articulated a different and substantially more stringent test.” Chairman Powell also added, “Today, with substantial slack remaining in the labor market and the pandemic continuing, such a mistake could be particularly harmful,” and “We know that extended periods of unemployment can mean lasting harm to workers and to the productive capacity of the economy.” [viii]
Despite the encouraging growth and a dovish Federal Reserve, we started to suspect that it has been quite a while since we have seen even a minor pullback which is usually necessary for market “health.” Exploring the data, we found that such suspicions were correct as seen in the chart below.
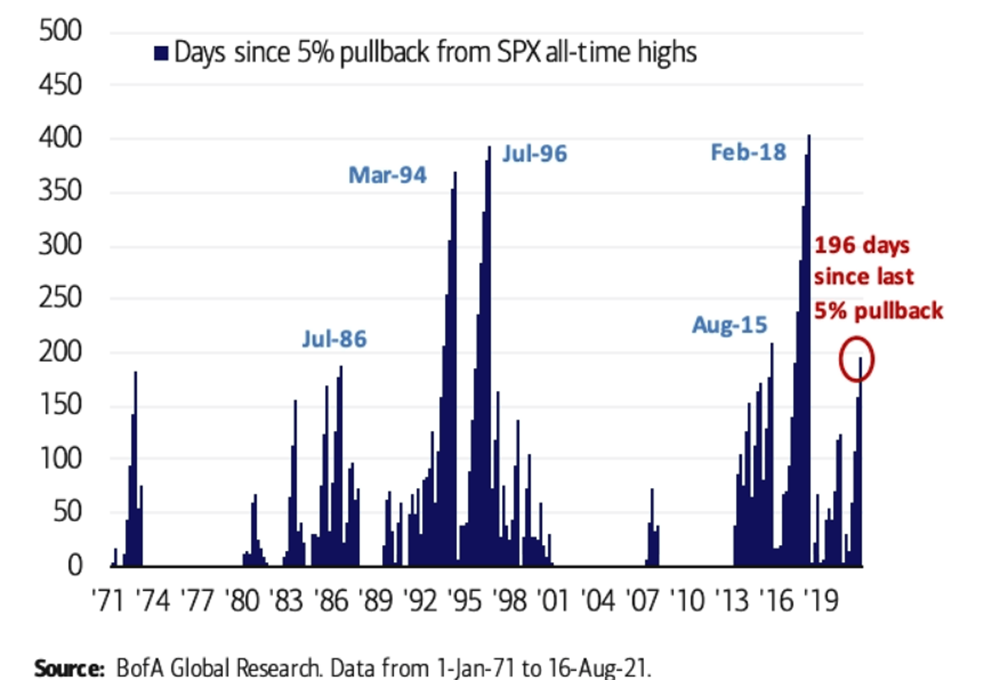
We haven’t had a 5% drop in the S&P 500 since the above chart was published on August 16, 2021. The S&P 500 has now gone 210 trading days without a 5% pull-back.[ix] During the past 50 years, there have only been five longer streaks than the one we currently enjoy. During such streaks, investors can become complacent, but risk happens fast.
As seen in the table below, those five streaks all ended swiftly and out of the blue, with drawdowns, or losses, in the S&P 500 ranging from -7.0% to -9.2% and the NASDAQ -7.9% to -12.0%. Volmaggedon in early 2018 saw a spike in volatility that caused ETFs holding leveraged bets on calm markets to lose most of their value.[x] In 2015 China suddenly devalued its currency, the yuan.[xi] The Great Bond Massacre in 1994 was set into motion when Federal Reserve Chairman Alan Greenspan suddenly started to raise short term interest rates for the first time in five years.[xii] July 1996 marked the end of a 5½ year long bull market[xiii], and on July 7, 1986, after an extended Fourth of July weekend, Robert R. Prechter Jr. told his investment newsletter subscribers to “sell everything right away.”[xiv] Interestingly enough, even though Prechter’s 1986 call was short-lived, he nailed it on October 5,1987 when he told subscribers to get out just days before the October 19, 1987 crash.[xv]
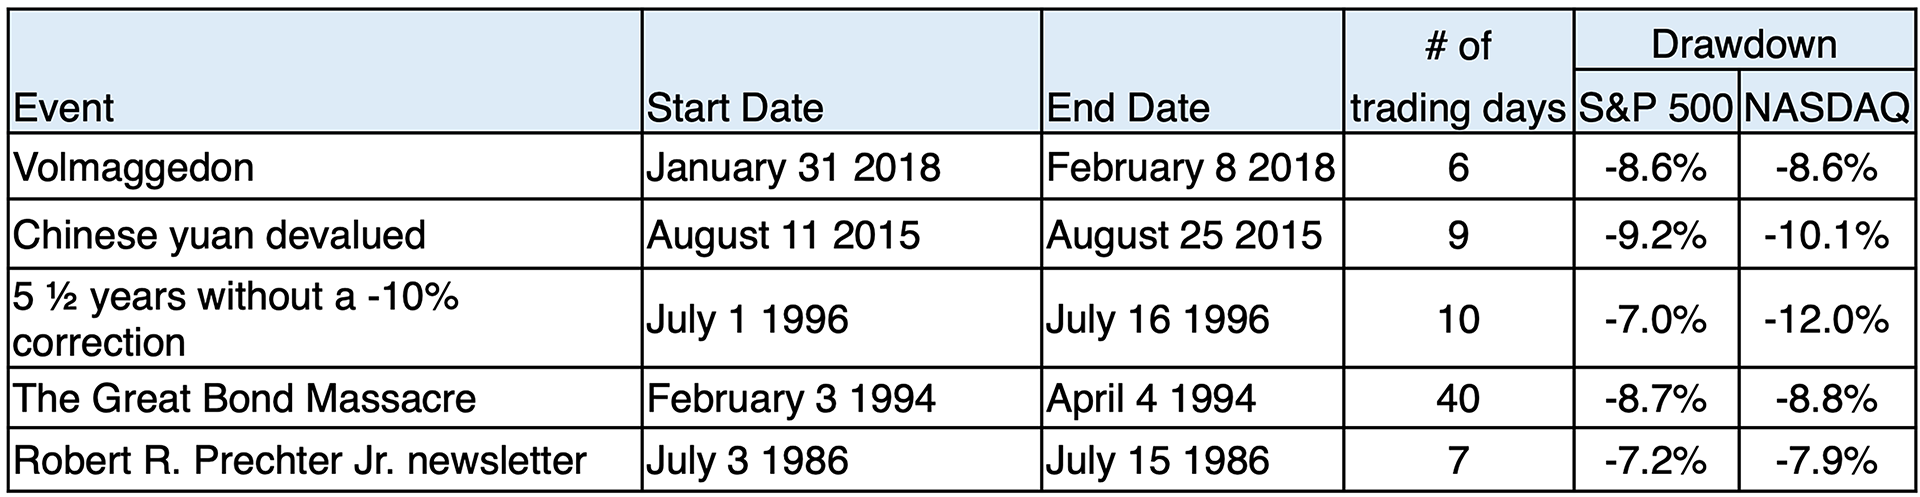
Drawdown calculated using data from finance.yahoo.com
Another interesting statistic came to our attention for last month’s S&P 500 performance. The S&P 500 made 11 new intraday all-time highs in August 2021, tying the record set in 1929 – a year that did not turn out well. The next best August on record? August 1987 saw 10 intraday all-time highs.[xvi] As we recall, the October 1987 market crash was brutal.
The current bull market may continue, with the Federal Reserve delaying a taper in bond purchases but given its historic run we may be overdue for at least a small drawdown. Equity valuations are in the stratosphere. Current price to earnings ratio on the S&P 500 is 35.36, more than double the historical average of 15.95.[xvii] Current total U.S. market cap is 207.5% of U.S. GDP. At the peak of the dot com boom, this ratio was 142%.[xviii] How extreme are some valuations? On August 27, electric truck company Rivian filed for an IPO, seeking an $80 billion valuation. Elon Musk, whose investment in Tesla has made him the world’s second richest man with a net worth around $190 billion as of this writing[xix], commented on this news, tweeting on August 28, “I thought 1999 was peak insanity, but 2021 is 1000% more insane!” [xx]
During this period of record equity markets and record valuations we continue to stay the course of risk balanced investing – take enough risk to reach your goals but not much more. We continue to focus on striking the right aggressiveness versus defensiveness in client portfolios given the evolving positives and negatives in the markets and the economy.

CIG Asset Management Review: Above Trend but for How Long?
Summary:
* Diverse stock market returns in July
* Watch FRONTLINE’s “The Power of the Fed”
* Is the market in a bubble?
Commentary:
Returns within stock markets varied during the month of July. The S&P 500 index rose +2.4%.[i] The Russell 1000 Growth Index was up +3.3%[ii] while the Russell 1000 Value Index only gained +0.8%.[iii] Small-capitalization stocks as measured by the Russell 2000 Index lost -7.0%.[iv] Overseas, developed stock markets as measured by MSCI EAFE net, gained a modest +0.7%.[v] Chinese stocks, as represented by the SSE Composite Index, fell -5.4%[vi] as China tightened regulatory policies over technology companies. MSCI Emerging Markets, which has a third of its weighting in China and exposure to under-vaccinated emerging countries, lost -7.0%.[vii]
As a follow-up to last month’s Asset Management Review, we encourage you to watch the recent FRONTLINE investigative episode called “The Power of the Fed.”[viii] While we do not agree with everything that the journalist and the interviewees say, this award-winning, long-form investigative journalism show does highlight how the Federal Reserve’s excessive money printing may lead to asset bubbles and exacerbate wealth inequality, which we believe could be damaging to the long-term health of the economy and the capital markets.
Given our belief that the market has become increasingly more fragile, which we talked about last month, we believe that investors may see single digit returns on a year-to-date basis in the short term before they see a return to the current mid-teens year-to-date return in the S&P 500 Index. The VIX, the measure of equity market volatility, in our opinion seems to be a coiled spring that continues to be tightened further and further. Right now, it seems like nothing bothers this market for long, e.g., Dr. Fauci worried about more deadly variants than Delta; computer chip shortages; or housing/ auto/ gas inflation. We expect more volatility later in the year.
The chart below does concern us. As you can see, there is significant cyclicality to the S&P Composite when it is adjusted for inflation. “Over earning” in the stock market for many years often leads to underperformance and losses over long periods. We have written in the past about how anecdotally and qualitatively 2021 reminds us of 2000. Quantitatively, the market’s 175% above trendline performance dramatically tops the 122% in 2000 and the 79% in 1929.[ix] Historically, markets have reverted to the red long-term trend line. Will this time be different than the large market drawdowns subsequent to the 1901, 1929, 1966 or 2000 peaks?
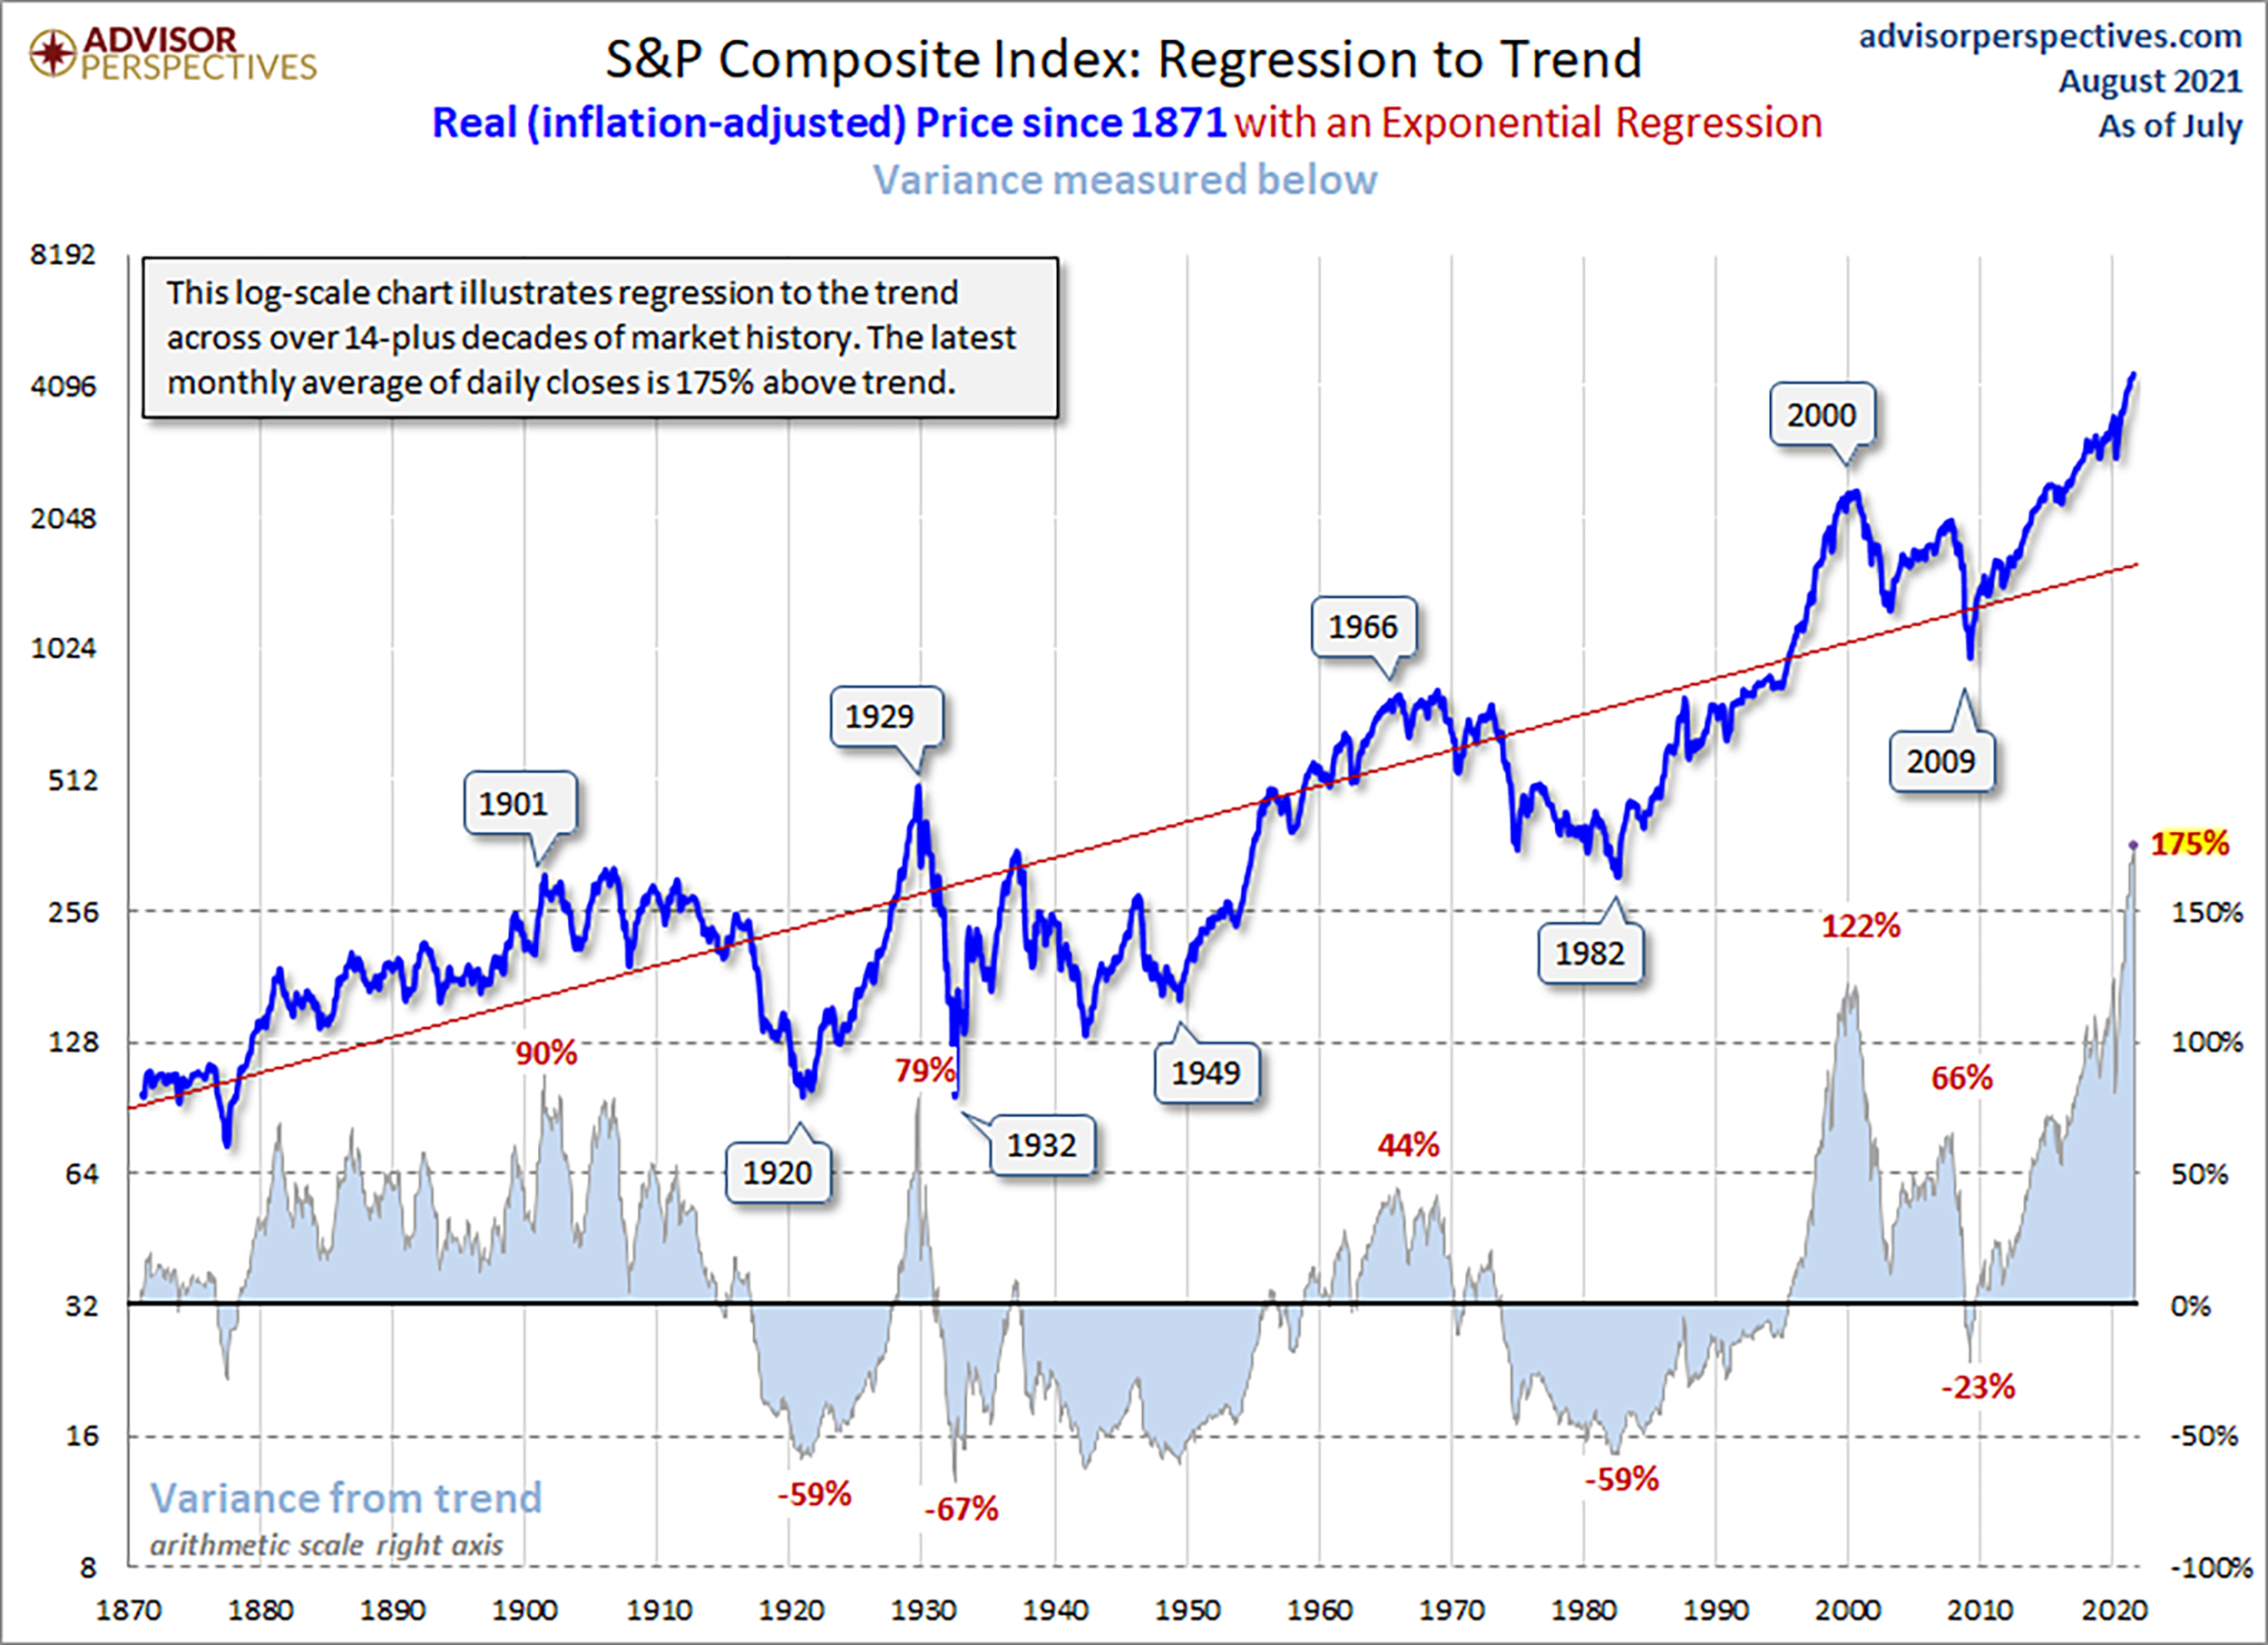
Source: Advisor Perspectives
It is quite possible that we are in an asset bubble right now. It is hard to know for sure when you are in it. The only sure-fire way to know if there is a market bubble is after it pops. We agree with John Hussman, who recently wrote in The Folly of Ruling Out a Collapse, “The problem with a speculative bubble is that you can’t make the short-term outcomes better without making the long-term outcomes worse, and you can’t make the long-term outcomes better without making the short-term outcomes worse. Now it’s just an unfortunate situation.”[x]
Our approach to this possible market bubble? Stay the course of risk balanced investing – take enough risk to reach your goals but not much more. We continue to focus on striking the right aggressiveness versus defensiveness in client portfolios given the positives and negatives in the markets and the economy.


CIG Asset Management Review: Inflation and Fragility
Summary:
* The Federal Reserve struck a more hawkish tone mid-month
* U.S. stocks rebound after a dip
* Markets appear increasingly fragile
Commentary:
Markets were stunned on June 16th as the Federal Reserve struck a more hawkish tone. Federal Reserve committee member’s projections now pointed to two interest-rate hikes in 2023 versus none before. The U.S. dollar jumped higher on the news, while many commodities reversed course from the prior month as inflation-focused investments suffered. Although the S&P 500 Index initially fell -1.6%, it fully recovered within days to end the month of June up +2.3%.[i] Overseas stock markets lost money during the same period with the MSCI EAFE net down -1.3% and the MSCI Emerging Markets losing -0.1% given U.S. dollar strength.[ii]
During the month, we reflected on the increasing criticism of the Federal Reserve by market commentators like Mohamed El-Erian, president of Queens’ College, Cambridge University, and adviser to Allianz. He believes the Federal Reserve is ignoring so-called transitory inflation at its own peril. In a June 30 Financial Times op-ed[iii], he referenced a Bank of America survey that suggests the markets are currently driven by a consensus around “durable high global growth, transitory inflation, and ever-friendly central banks.”[iv] El-Erian argues that possibility of unanticipated non-transitory inflation could upset this happy market consensus leading to significant economic and financial damage.
El-Erian has been very right in the past in our opinion. In a CNBC interview on February 3, 2020, he warned about the risks of the newly discovered COVID-19 virus. “It is big. It’s going to paralyze China. It’s going to cascade throughout the global economy. We should pay more attention to this. And we should try and resist our inclination to buy the dip”, said El-Erian.[v] The S&P 500 reached its then all-time high two weeks after that interview and then fell -35% until it reached the March 23, 2020 low.[vi]
More recently, on February 16, 2021, El-Erian warned in a CNN interview, “Investors are chasing what someone labeled the ‘rational bubble’. While they are fully aware asset prices are high, they expect prices could go even higher thanks to massive central bank liquidity and prospects of fiscal injections. Basically, investors feel confident riding what is a massive historical liquidity wave.”[vii] So far, investors have not heeded El-Erian’s warning. Indeed, as of July 9, 2021, the S&P 500 has rallied +11% from the CNN interview.[viii] The massive historical liquidity wave that El-Erian warned about in February 2021 continues to grow. Federal Reserve asset purchases shown in the green shaded area in the chart below has dramatically increased the discomfort of holding cash with 0% yield and amplified the desirability of buying risky stocks which investors expect offer higher returns.

data from https://fred.stlouisfed.org and finance.yahoo.com
Constant intervention by the Federal Reserve and other central banks since 2009 have led to an environment of self-reinforcing speculation and a rising S&P 500 index shown in the black line. Reckless fiscal policy since 2017 has only augmented the atmosphere. In our opinion, entire investment strategies have now been built around the perceived certainty of Federal Reserve and central bank support. Retail traders’ share of stock market volume has surged since the lockdowns, and the number of individuals opening brokerage accounts is at a record pace in 2021[ix]. We believe that most bubbles end when the last marginal investor is fully invested.
The belief that central bank liquidity has the capacity to support elevated markets indefinitely creates a reflexive response by the market as more and more investors jump on the bandwagon. Thus, the market becomes increasingly fragile. Consequently, a more aggressive Federal Reserve intervention is required with each market downturn which one can see in the chart above. El-Erian’s op-ed hints at the dynamics of certainty and fragility. Now markets move downward based on the Fed pretending to inch a teensy bit toward maybe raising rates over 18 to 30 months from now[x].
No matter what real world inflation we might be experiencing currently, debating the transitory nature of inflation is likely to continue to produce periodic setbacks for inflation-focused investments. Inflation expectations are changing, and it will take time for the debate to be settled in some fashion. Until these expectations are cemented in an alternative vision of the world by investors, market commentators and powerful institutions, we might expect the market to move in short order from calm to quite volatile.
For CIG’s clients, we will continue to take a risk balanced approach to this historically expensive market in these uncertain and fragile times. Risk balancing means moderating portfolios’ exposure to the consensus views of other investors as well as using hedging strategies like owning publicly traded hedge funds, gold, and volatility strategies.
Understanding and paying attention to this environment is important to achieving your financial planning goals.