The stock market rally continues. Through June 13, 2024, the S&P 500 has gained +14.7% year-to-date and we still haven’t seen a single-day decline of over 2% in 479 days, the third longest stretch in the past 25 years. [i] We wrote about this extraordinary winning streak in last month’s update, Where are we now?
This year, some investors who have a diversified portfolio that owns many stocks across many sectors, may feel like they are missing out on the current rally. They may see on CNBC or read in the Wall Street Journal that the market is at its all-time high, yet their own portfolio is not.
Closely examining the following extreme market internals; narrow sector performance, large market cap outperformance and S&P 500 index concentration can help explain what is happening beneath the surface.
Sector performance is narrowing again. In our CIG Asset Management Update on April 1, 2024, we discussed encouraging signs that the stock market rally may be broadening. We may have been early on that call. As you can see in the chart below, month-to-date at June 14, 2024, the technology sector has gained +9.1%, communication services – which is mostly comprised of Meta and Google – advanced +1.7%, and the other nine of the eleven S&P 500 sectors were all down. [ii]
 Chart by CIG Asset Management using data from FinViz
Large market-cap out performance. The S&P 500 index is weighted by market capitalization– that is, the larger the total value of the company, the higher the weighting in the index. It’s currently experiencing historic outperformance versus the equal-weighted S&P 500. In fact, while the S&P 500 – represented by the SPDR S&P 500 ETF Trust (SPY) has advanced +14.6% year-to date through 06/14/2024, the equal-weighted S&P 500 500 – represented by the Invesco S&P 500 Equal Weight ETF (RSP) is only up +4.2%. [iii] .
The following chart shows the relative performance of the market-cap weighted S&P 500 (SPY) versus the equal-weighted S&P 500 (RSP) for the 5-year period ending June 14, 2024. When the blue line is below 1.0, RSP is outperforming SPY. As you can clearly see, this has been a rarity over the past five years.
 Chart by CIG Asset Management using data from Barchart.com.
The slope of the blue line has recently been increasing – this indicates that the outperformance is widening. This tells us that the larger companies are outperforming the smaller companies. What companies are outperforming? The answer is large-cap stocks in the technology sector, and we believe their returns are being driven by the hopes that Artificial Intelligence (AI) will contribute massive revenues and earnings to this sector.
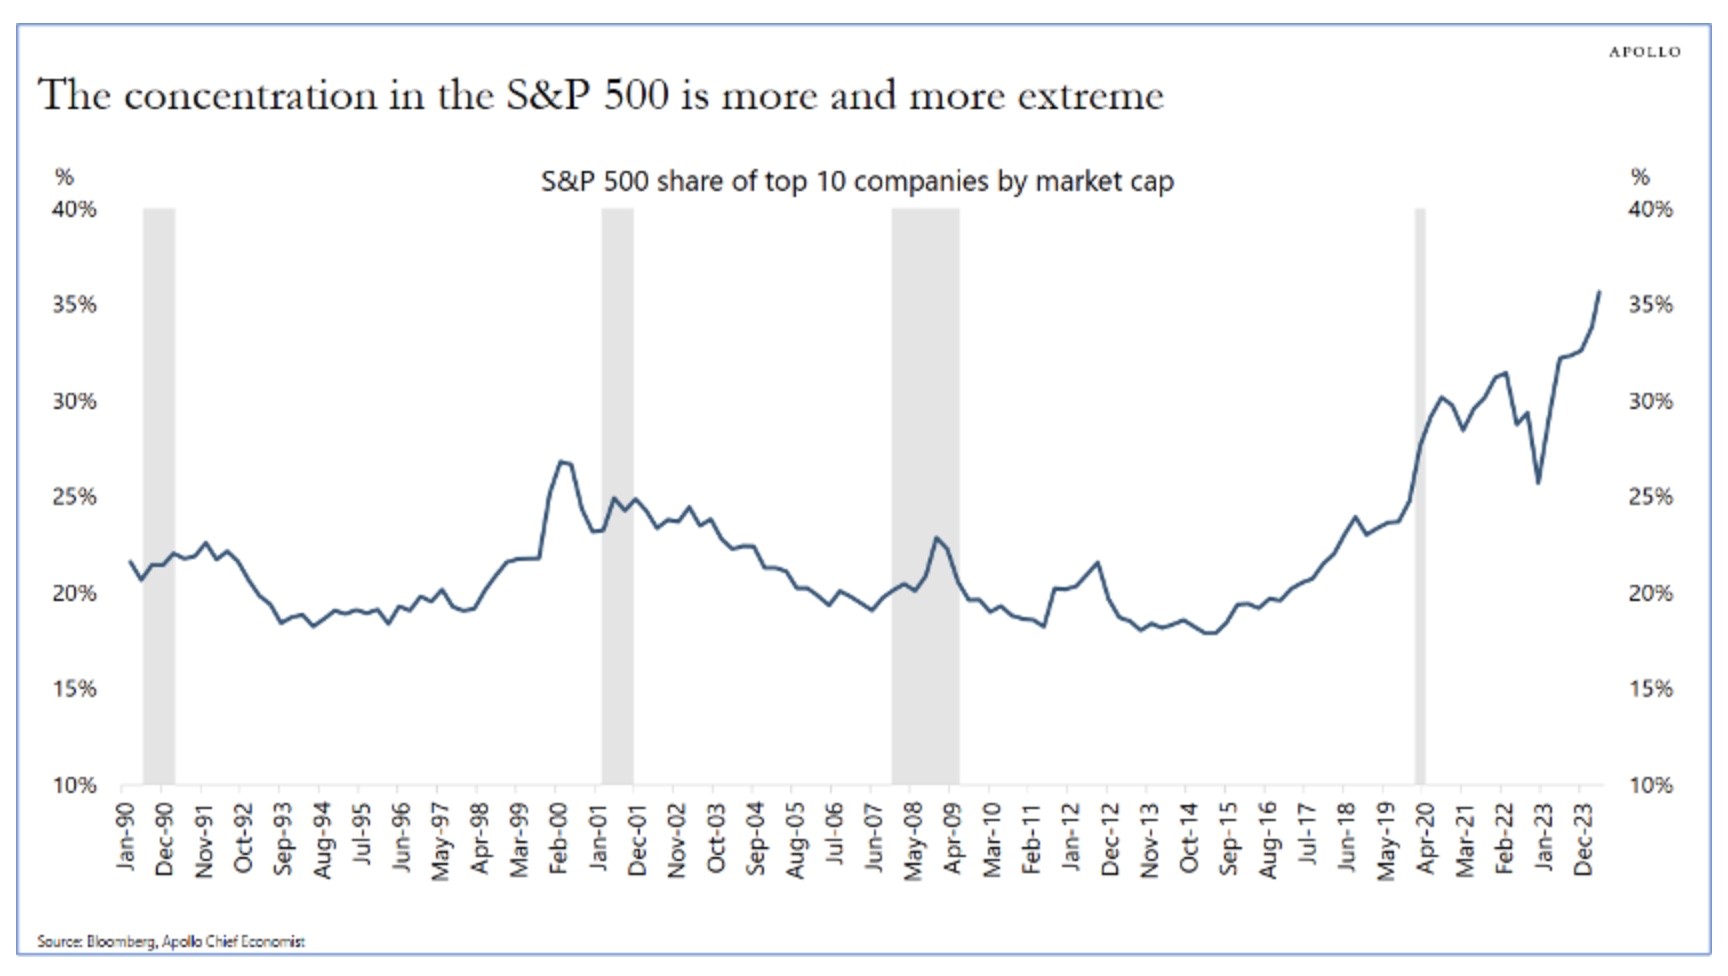
S&P 500 index concentration. On June 9, 2024, Apollo Chief Economist Torsten Slok posted the following chart in The Daily Spark.
 Source: Apollo The Daily Spark 06/09/2024
Currently, ten out of the 500 stocks in the S&P 500 account for over a third of its total value. These high-growth stocks have been major contributors to recent S&P 500 returns. Such extreme concentration is rare. Only three of those ten largest companies are outside of the Technology or Communications sectors: Berkshire Hathaway, Eli Lilly and JP Morgan. [iv] This is great when the top ten are moving higher and add excess returns to the market cap weighted S&P 500 index but can have the opposite effect if the hopes that AI will produce enormous profits for the companies involved does not prove to be true.
Growth versus Value. The following chart shows the ratio of the indexed returns of the Russell 1000 Growth Index and the Russell 1000 Value Index. The Russell 1000 Growth Index is currently outperforming the Russell 1000 Value Index by the biggest margin in decades! As of June 14, 2024, nine of the top ten stocks in the iShares Russell 1000 Growth ETF – which tracks the index – were technology related stocks and were a total of 53%, of the index. [v]
 Source: Bloomberg 06/06/2024
1. Value may once again outperform growth. The significant spike in the year 2000 during the dot-com bubble serves as a historical reference. Right now, we’re witnessing another surge in large-cap technology stocks, which we attribute to an AI bubble. In 2000, after the dot-com bubble burst, value stocks outperformed growth stocks. We’ve strategically positioned our clients’ portfolios to potentially benefit from this trend if the AI bubble deflates.
2 Profit-Taking and Rebalancing: When a sector or set of stocks significantly outperforms, we consider taking profits and rebalancing client portfolios. This can be an attractive exit point. We will look for tax harvesting opportunities as well as we rebalance.
3. Buying Opportunities: Conversely, when a sector or set of stocks underperforms, it may present an opportune entry point. To take advantage of this opportunity, we look to add positions before a sector recovers.
4. Contrarian Approach: Small-cap stocks and value stocks, often overlooked during market extremes, might be particularly appealing to contrarian investors right now. Year-to-date through [June 14, 2024], the Russell 2000 index of small-cap stocks is down -1.0%. [vi]
In navigating these market dynamics, we recognize that extremes can create opportunities. Whether it’s profit-taking, rebalancing, or adopting a contrarian approach, staying informed and maintaining an active management strategy will be crucial. In doing so, we continue to manage diversified strategies for the long run.
Please reach out to Brian Lasher (blasher@cigcapitaladvisors.com), Eric T. Pratt (epratt@cigcapitaladvisors.com) or the rest of the CIG team.


