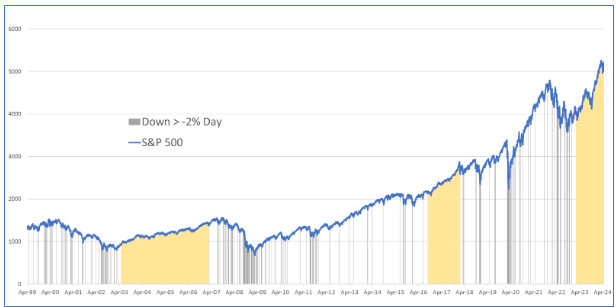
The S&P 500 currently is experiencing its third longest period in the past 25 years without a single-day decline of over 2%. Yes, including last month. The graph below depicts the past 25 years, highlighting every day when the S&P 500 fell over 2% (indicated by black vertical lines). These occurrences aren’t rare.

Chart by CIG Asset Management using data from barchart.com
The mustard-colored shaded areas represent extended periods without a 2% down day. The first yellow shaded area, 1,380 days, (from May 20, 2003, to February 27, 2007) coincided with Freddie Mac’s announcement that they would no longer buy sub-prime mortgages. [i] This marked the beginning of the great financial crisis, leading to a significant stock market drawdown over the next two years. The second longest period was 511 days, (September 12, 2016, to February 1, ) This calm period in the market ended with what became known as Volmaggedon – an event where many structured products that bet against stock market volatility lost over 90% of their value. [ii] The most recent shaded area began on February 21, 2023, and continues beyond May 9, . (443 days as of this writing) [iii] Notably, despite the S&P 500 falling -4.1% in April 2024, we still didn’t experience a single -2% down day.[iv] History teaches us that long quiet periods can often precede sudden volatility and drawdowns.
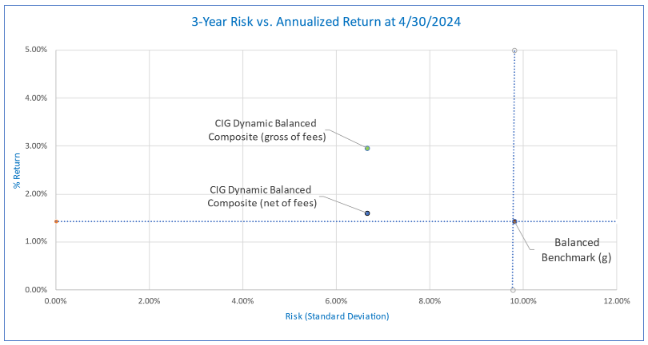
While no one can predict the future, we are currently taking less risk than the benchmarks in our managed strategies. The following chart shows the risk/return of the CIG Dynamic Balanced Composite versus the balanced benchmark for the three-year period ending April 30, 2024. Gross of fees, the balanced composite captured 207% of the benchmark’s return while only taking 68% of the Balanced Benchmark’s risk, as measured by standard deviation of returns over that 3-year period. Net of fees, the balanced composite captured 113% of the benchmark’s return. [v]

CIG Asset Management, Tamarac
The graph above illustrates the performance of the CIG Dynamic Balanced Composite over the past three years. Specifically, the annualized return of this strategy is above the horizontal dotted blue line which represents the annualized return of the balanced benchmark. Additionally, the strategy’s risk level is to the left of the vertical dotted blue line, which corresponds to the balanced benchmark’s risk. This positioning indicates good diversification: achieving higher returns than the benchmark while assuming less risk. However, achieving this balance isn’t easy, especially in a potentially euphoric market, and requires careful decision-making and strategic asset allocation.
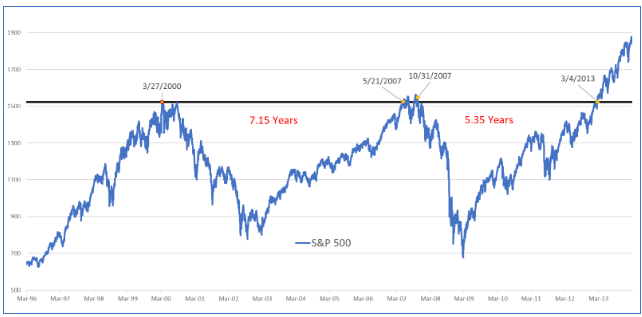
Why are we focused on risk and what are we trying to avoid? Prolonged Downturns. Consider this graph, which first appeared in our update titled ‘What if the Bubble Bursts?’ on November 8, 2021.

CIG Asset Management, barchart.com
Imagine an investor who put their money in the S&P 500 on March 27, 2000—the peak of the dot-com boom. They would have waited 7 years to break even by May 21, 2007. Briefly, there was a window to exit and remain whole until October 31, 2007. Then came the Great Financial Crisis, requiring another 5 plus years to recover by March 4, 2013. [vi]Our Question for Investors – Are you comfortable waiting 5, 7, or even close to 13 years to break even? For those nearing retirement or relying on investments for living expenses, the answer is likely no. While this period was extraordinary, it wasn’t that long ago. And now, the AI bubble appears to have striking similarities to the dot-com era. As of April 22,2024, the information technology sector was 30.3% of the S&P 500, nearing the dot-com record of 34.8% in March 2000. [vii]
At CIG, we take a thoughtful and balanced approach to investment management. As we navigate the ever-changing economic and geopolitical landscape, our outlook remains cautiously optimistic. In this phase of the market cycle, our primary goal is to achieve returns that align with our clients’ diverse financial plans while minimizing risk. We draw inspiration from Benjamin Graham’s wisdom in his book, The Intelligent Investor. “The best way to measure your investing success is not by whether you’re beating the market but by whether you’ve put in place a financial plan and a behavioral discipline that are likely to get you where you want to go. In the end, what matters isn’t crossing the finish line before anybody else but just making sure that you do cross.”
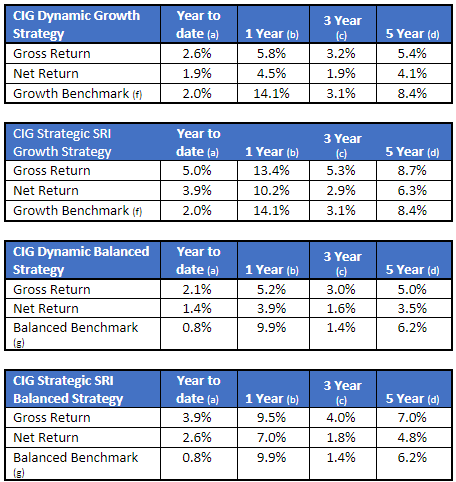
Strategy Returns as of 4/30/2024:

Performance has been attested to by ACA Group for the period August 1, 2018, through December 31, 2022.
Strategy returns are calculated independently on a daily basis and linked geometrically to produce a monthly return. Total investment performance includes realized and unrealized gains and losses, dividends, and interest. Accrual accounting is used to record interest income while dividends are recorded on a cash basis. Trade date accounting is used for calculation and valuation purposes.
Past performance is not indicative of future results.
(a) Represents performance from January 1, 2024, through April 30, 2024.
(b) Represents performance from May 1, 2023, through April 30, 2024.
(c) Represents annualized performance from May 1, 2021, through April 31, 2024.
(d) Represents annualized performance from May 1, 2019, through April 31, 2024.
(f) The Growth Benchmark is a blend of 60% Russell 3000, 25% MSCI All-Country World ex US and 15% Bloomberg US Aggregate Bond indices.
(g) The Balanced Benchmark is a blend of 45% Russell 3000, 10% MSCI All-Country World ex US and 45% Bloomberg US Aggregate Bond indices.
[i] https://fraser.stlouisfed.org/title/freddie-mac-5132/freddie-mac-announces-tougher-subprime-lending-standards-help-reduce-risk-future-borrower-default-518857
[ii] https://rpc.cfainstitute.org/en/research/financial-analysts-journal/2021/volmageddon-failure-short-volatility-products
[iii] Calculated by CIG Asset Management using data from barchart.com
[iv] Calculated by CIG Asset Management using data from finance.yahoo.com
[v] Calculated by CIG Asset Management using data from Tamarac
[vi] Calculated by CIG Asset Management using data from barchart.com
[vii] https://www.investopedia.com/best-25-sp500-stocks-8550793, https://www.bespokepremium.com/interactive/posts/think-big-blog/historical-sp-500-sector-weightings


