Summary:
* A challenging first half of 2022.
* Will the Fed do what they say they would and reduce their balance sheet?
June 2022 Returns:
Commentary:
June 2022 brought to a close the first half of the year and proved to be a difficult month for investors. The U.S. equities, as measured by the S&P 500, were down -8.25%.[ix] International Equities were down -9.28%[x] in spite of Chinese stocks gaining +6.66% [xi] as their economy reopened from COVID lockdowns. Fixed income offered no relief and lost -3.79% as measured by the Bloomberg U.S. Aggregate Index.[xii] Gold fell -2.09%[xiii] and crude oil lost -7.77%[xiv] as the U.S. Dollar Index gained +2.66%.[xv] The S&P 500 wrapped up the first half of 2022, down -20% year-to-date, marking its worst first half performance in 50 years. 10-year U.S. Treasury bonds had their worst first half performance since 1788, just before George Washington became our first president.[xvi]
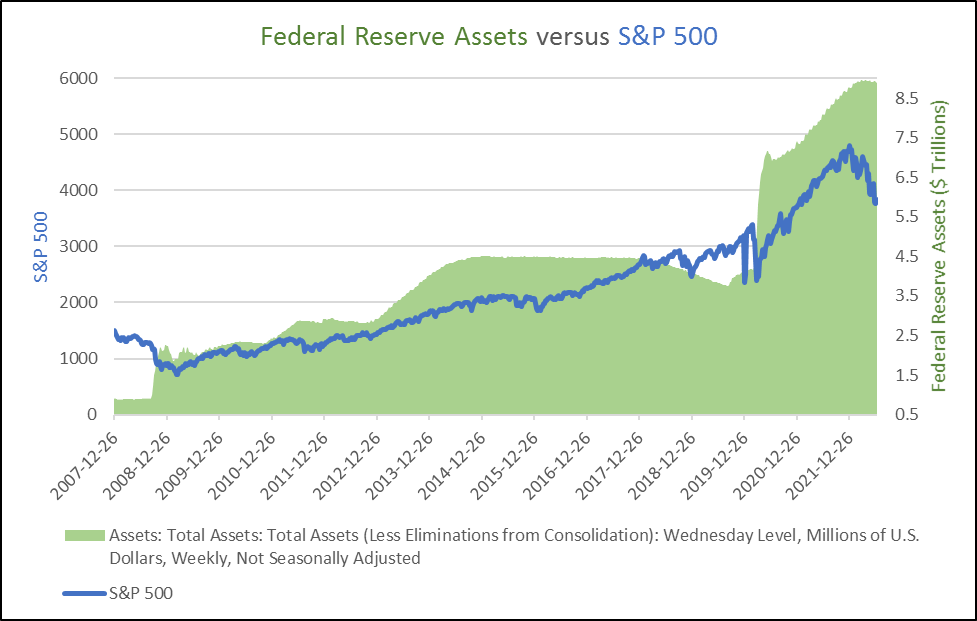
Why has the first half of 2022 delivered such unfavorable returns across so many different asset classes? We believe the end of Quantitative Easing, “QE”, may be the root cause. During QE, the Federal Reserve (Fed) bought bonds in the open market in an attempt to increase the money supply and liquidity and lower borrowing costs. QE was first used in the U.S. in reaction to the Great Financial Crisis in 2007-2008. The first three rounds of QE ballooned the Fed’s balance sheet from $900 billion to $4.5 Trillion and ended in 2014.[xvii] During the fourth round of QE, the Fed, in response to the COVID-19 pandemic, almost doubled the balance sheet from 2014 levels to nearly $9 trillion.[xviii]
We discussed the Fed balance sheet a year ago in our June 2021 CIG Asset Management Review: Inflation and Fragility. In that review, we talked about how Federal Reserve asset purchases created a massive liquidity wave which dramatically increased the discomfort of holding cash with 0% yield and amplified the desirability of buying risky stocks that investors expect will offer higher returns. We cautioned that without continued Fed intervention, volatility would likely increase. Volatility has indeed increased—significantly. For the entirety of 2021, our proprietary CIG Volatility Signal was on for only 6 out of 252 trading days (2% of the days). Year-to-date through June 30, our Signal has been on for 76 out of 124 trading days (approximately 61% of the days). We have updated the chart from our June 2021 discussion below. The strong correlation between what appears to be an ever-increasing balance sheet and a stronger stock market, the S&P 500, continued until January 2022, when the Federal Reserve suddenly pivoted from a position of “inflation is transitory” to being more hawkish.

Data from: https://fred.stlouisfed.org and investing.com
On May 4, 2022, the Fed announced it would start reducing its nearly $9 trillion balance sheet on June 1 at the rate of $30 billion of treasury securities and $17.5 billion of mortgage-backed securities. This is so-called “quantitative tightening,” “QT”. Additionally, The Fed said it would increase the monthly reduction to $95 billion three months later.[xix] What progress has the U.S. Fed made in balance sheet reduction so far? The Fed only reduced its assets by $1 billion in June, which is nowhere close to the $47.5 billion that they originally talked about.[xx]

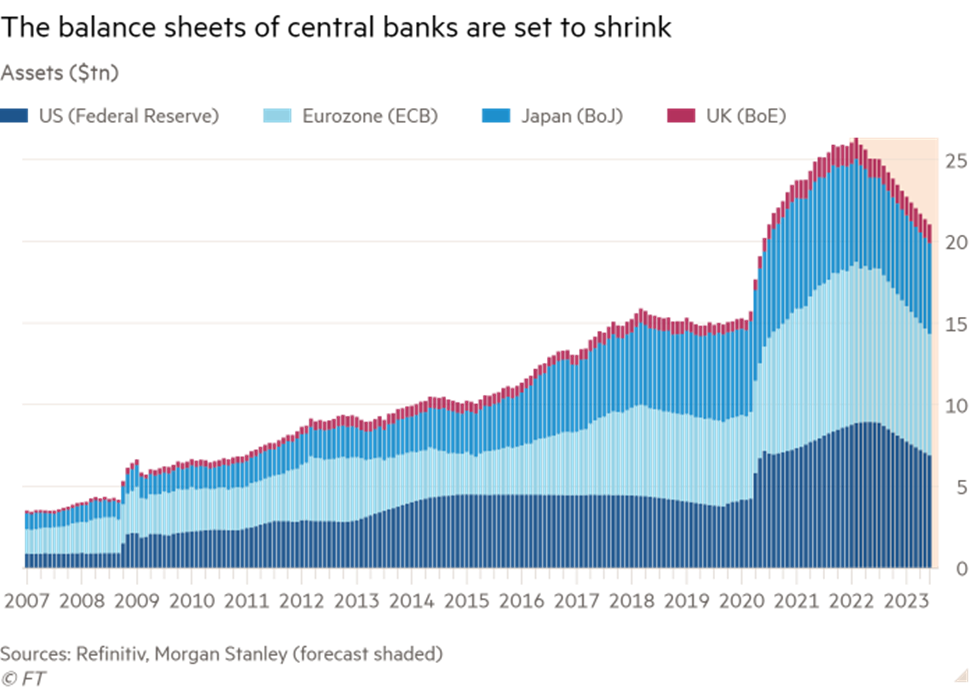
The U.S. Fed is not the only central bank considering shrinking their balance sheet and it’s no wonder, with central bank balance sheets being 5 times greater than they were before the 2008 Great Financial Crisis.[xxi] The Fed has just raised short-term interest rates from 0.25% to 1.75%.[xxii] Many economists expect the Fed to raise short-term rates an additional +0.75% at the July FOMC meeting. Suddenly, money markets and certificates of deposits offer a nominal yield. Morgan Stanley has estimated that in total, the world’s central banks may reduce their balance sheets by about $5 trillion by the end of 2023.
Could a 20% reduction in central banks’ balance sheets have a negative effect on the world’s stock markets? It is entirely possible. The Buffet Ratio, named after Warren Buffet, is a measure of total U.S. stock market capitalization to U.S. GDP. It has already fallen -22% from its all-time high of 202.5% in August 2021 to 157.5% as of June 12, 2022. The stock market, however, remains significantly overvalued, as we are simply back to the peak valuation of 157.5% in March 2000, which was right before the dot-com bubble burst.[xxiii]
Mere talk of reducing the Fed balance sheet in January sparked volatility and sent stocks into a bear market.
The Fed has gotten itself into a tough spot. Perhaps the economy will slow down so rapidly that inflation fades quickly, and the central bankers do not have to try and unload bonds. If the Fed maintains its almost $9 trillion balance sheet, or in fact increases it as a response to an unforeseen economic crisis, investors would likely be willing to take on more risk and send stocks higher. If employment remains strong and inflation remains historically high, they will be pressured to continue to raise interest rates and reduce liquidity by decreasing the balance sheet. June nonfarm payrolls were much stronger than expected, with 372,000 jobs created for the month versus the Dow Jones estimate of 250,000.[xxiv] June CPI showed inflation was up +9.1%, hotter than the +8.8% Dow Jones estimate[xxv] and the largest year-over-year increase since 1981.[xxvi]
Q2 2022 earnings season will bring the results of corporate efforts last quarter, as well as – more importantly – the outlook of those companies’ CEOs for what they see lies ahead for the rest of the year. The Federal Open Market Committee (FOMC) will meet on July 26-27 to determine how much to raise short-term interest rates. Higher rates mean less money for companies to spend on stock buybacks and real corporate expenditures and consumers to purchase goods and services.
Active management strategies are vital during periods when answers to important questions are unknown. Will the Fed do what they say they would and reduce their balance sheet? Could a 20% reduction in central banks’ balance sheets have a severely negative effect on the world’s stock markets? Will geopolitical stability be impacted? Will a “hard landing” and recession lead to no QT that brings the return of past trends or will various troubles create a future that has little similarity to history? Democratic decline, aging populations, fiscal deficits, polarizing geopolitics and deglobalization suggest uncharted territory ahead. How long this uncertainty lasts remains an open question and prudent investors must contemplate all scenarios.
Meanwhile, we “take arms against a sea of troubles”[xxvii] by continuing to take much less risk in our managed accounts versus traditional benchmarks. We will be patient and remain vigilant until some clarity is gained regarding inflation, interest rates and the direction of the economy. To QT or Not To QT: that is the question. Ah, “what [soft landing] dreams may come” from the World’s central bankers.
The Bard’s wisdom — “This above all: to thine own self be true”[xxviii] — prompts us to seek your questions, concerns and perspectives on the markets, the economy, and the value of careful active management, especially during uncertain times. We would welcome the opportunity to connect with you via voice or email.


