CIG Asset Management Update: Pain Points – What Can Be Learned; What Can Be Done?
Summary:
* Ready, Fire, Aim: Fed Chair Powell Jackson Hole speech sends stocks sharply lower.
* Reading the Room: “Some pain to households and businesses”
* Active Management: Possible strategies and implementations to relieve pain
 August 2022 Returns:
Commentary:
Approximately $2 trillion in global stock market capitalization was lost as Federal Reserve Chairman Jerome Powell spoke and said the word “inflation” 47 times in the span of his eight-minute speech.[ix]
Until his short presentation at the Jackson Hole Economic Symposium on August 25 sent stocks lower, U.S. equities spent most of the month of August adding on to July’s gains. By month’s end, however, U.S. equities, as measured by the S&P 500, were down -4.1% in August. International Equities in developed markets erased -4.8%[x], while Emerging Market Equities interestingly gained +0.4%.[xi] Fixed income lost -2.8% as measured by the Bloomberg U.S. Aggregate Index[xii] as the 10-Year U.S. Treasury bond yield rose +49 basis points to end the month at 3.13%.[xiii] Gold fell -2.8%[xiv] and crude oil lost -9.2%[xv] as the U.S. Dollar Index gained +2.8%.[xvi]
At the end of a market cycle, bear market rallies like the recent one from mid-July to mid-August are not uncommon and ultimately painful to optimistic buyers. According to the Wall Street Journal, “it is the worst year for buying the stock-market dip since the 1930s.”[xvii]
Pain remains the operative word all around. “While higher interest rates, slower growth, and softer labor market conditions will bring down inflation, they will also bring some pain to households and businesses. These are the unfortunate costs of reducing inflation. But a failure to restore price stability would mean far greater pain”, said Chairman Powell.[xviii]
Slower Growth and Softer Labor Markets
Markets have been volatile since Powell’s Jackson Hole speech as investors try to determine how fast and how high the Fed will raise rates, and perhaps most importantly, how long before the Fed cuts rates. It is our opinion that inflation will remain elevated for longer than many may hope for and as a result, the Fed will need to continue raising rates in efforts to fight inflation. Indeed, Chairman Powell said, “Reducing inflation is likely to require a sustained period of below-trend growth. Moreover, there will very likely be some softening of labor market conditions.”
Lower Asset Prices
The Federal Reserve’s doubling of its balance sheet sent a big liquidity wave through the economy that helped increase prices of assets from houses to stocks. As of September 14, 2022, the Federal Reserve balance sheet was $8.8 trillion, roughly double the $4.3 trillion pre-pandemic level on March 11, 2020, and only slightly lower than the $8.9 trillion balance as of June 1, 2022, the day the Federal Reserve began systematically reducing debt.[xix]
Long-time readers of our Asset Management updates may appreciate that we have been concerned about debt for some time. We discussed the Fed balance sheet more than a year ago in our June 2021 CIG Asset Management Review: Inflation and Fragility.
This same Federal Reserve is now intent on draining liquidity out of the economy to combat inflation. What will happen to these inflated asset prices as the Federal Reserve attempts to take liquidity out of the economy as it sells bonds to reduce its balance sheet and takes in hundreds of billions of dollars in cash?
Higher Government Debt Burden
The pandemic greatly increased the indebtedness of the United States. The total federal debt at the end of 2Q 2022 totaled $30.6 trillion, +32% more than the $23.2 trillion in early 2020.[xx]
We believe there is a consequence to all this debt and that this amount of debt is becoming unwieldy. The U.S. Treasury has paid out $590 billion in interest on its debt since October 1, 2021, when the Federal government’s fiscal year began.[xxi] This interest expense is quickly approaching the $777 billion that Congress approved for 2022 defense spending and is approximately 2.5% of the roughly $24 trillion annual U.S. economy.[xxii] If the economy is able to grow at a healthy pace, many may overlook the interest on the U.S. debt, but in a recession, this interest expense becomes magnified as the total output of the economy shrinks. Tax hikes may very well be in our future as the government tries to manage this debt. We would not be surprised to see taxes on capital gains increased in the near future.
Given this pain, why would you leave your hard-earned assets in a less active, less flexible account?
We took steps in our actively managed strategies in 2021 to significantly reduce risk versus the benchmarks and it continues to be rewarding. Publicly traded alternatives, which are generally less correlated to market movements, have also been part of our focus. Most recently, during the last week of September we reduced domestic equity and fixed income exposures in both the CIG Dynamic Growth and CIG Dynamic Balanced strategies and allocated the proceeds to cash.
Through 8/31/2022, our CIG Dynamic Growth Strategy composite has avoided approximately 50% of the losses of the growth benchmark and our CIG Dynamic Balanced Strategy has avoided approximately 55% of the losses of the balanced benchmark.[xxiii]
Meanwhile, anecdotally, we suspect that assets held in traditionally less flexible, company-sponsored 401(k) and 403(b) plans or in less actively managed accounts may have experienced greater losses. We would suggest that you review your recent statements or discuss this with your investment advisor when they call you next.
We would welcome the opportunity to connect with you via voice or email to discuss market challenges and opportunities, as well as the benefits of active investment management.
This report was prepared by CIG Asset Management and reflects the current opinion of the authors. It is based upon sources and data believed to be accurate and reliable. Opinions and forward-looking statements expressed are subject to change without notice. This information does not constitute a solicitation or an offer to buy or sell any security.
Â
[i] The Growth Benchmark is a blend of 60% Russell 3000, 25% MSCI All-Country ex U.S. and 15% Bloomberg U.S. Aggregate Bond indices. Sources: CIG, Zephyr, and Morningstar.
[ii] The Balanced Benchmark is a blend of 45% Russell 3000, 10% MSCI All-Country ex U.S. and 45% Bloomberg U.S. Aggregate Bond indices. Sources: CIG, Zephyr, and Morningstar.
[iii] Zephyr: S&P 500
[iv] Zephyr: Bloomberg U.S. Aggregate Bond
[v] Zephyr: MSCI EAFE Net
[vi] Zephyr: MSCI Emerging Markets Net
[vii] Calculated using data from finance.yahoo.com
[viii] Calculated using data from finance.yahoo.com
[ix] Twitter: @Schuldensuehner 08/28/2022
[x] Zephyr: MSCI EAFE Net
[xi] Zephyr: MSCI Emerging Markets Net
[xii] Zephyr: Bloomberg U.S. Aggregate
[xiii] Calculated using data from finance.yahoo.com
[xiv] Calculated using data from finance.yahoo.com
[xv] Calculated using data from finance.yahoo.com
[xvi] Calculated using data from finance.yahoo.com
[xvii] https://www.wsj.com/articles/buying-the-stock-market-dip-is-backfiring-this-year-11664064845?reflink=desktopwebshare_permalink
[xviii] https://www.federalreserve.gov/newsevents/speech/powell20220826a.htm
[xix] https://fred.stlouisfed.org/series/WALCL
[xx] https://fred.stlouisfed.org/series/GFDEBTN
[xxi] https://www.politico.com/news/magazine/2022/09/20/fed-inflation-powell-debt-00057606
[xxii] https://www.armed-services.senate.gov/download/fy22-ndaa-agreement-summary
[xxiii] Calculated by CIG
Image: Torsten Dederichs/Unsplash
CIG Asset Management Update: Think Different
Summary:
* Best month for the S&P 500 since November 2020[i]
* The Fed raises short-term interest rates +0.75%
* Contrarian thinking and active investing
July 2022 Returns:
Commentary:
U.S. equities, as measured by the S&P 500, were up +9.2%, the best month since November 2020. International Equities were up +5.0%[x]. Fixed income gained +2.4% as measured by the Bloomberg U.S. Aggregate Index.[xi] Gold fell -2.3%[xii] and crude oil lost -6.8%[xiii] as the U.S. Dollar Index gained +1.3%.[xiv]
On Wednesday, July 27, the Federal Open Market Committee raised the Federal Funds Rate (the interest rate at which depository institutions trade federal funds [balances held at Federal Reserve Banks] with each other overnight) by +0.75% to a range of 2.25% to 2.50%.[xv] During the press conference that followed the rate announcement, Federal Reserve Chair Jerome Powell said the Fed had already reached a “neutral” level of interest rates—one that neither boosts nor restricts economic activity. The S&P 500 gained +3.8% from the start of Powell’s press conference at 2:30p.m. July 27 through the close on July 29.[xvi] Many market observers attribute the post-FOMC meeting rally to Powell’s “neutral” comment. Has the Fed already done the heavy lifting? We think not and believe we are not alone in this thinking. Former Treasury Secretary Lawrence Summers said on Wall Street Week, “Jay Powell said things that, to be blunt, were analytically indefensible,” and “There is no conceivable way that a 2.5% interest rate, in an economy inflating like this, is anywhere near neutral.” Mohamed El-Erian, Chief Economic Adviser to Allianz SE and President of Queen’s College, said that “the zip code for neutral is above where we are now.”[xvii]
We have illustrated below just how far behind the curve the Fed currently is in its fight against inflation. In the previous seven tightening cycles, the Federal Reserve raised the Fed Funds Rate to a level higher than the inflation rate, as measured by CPI at that time, to bring prices down. As recently as April 2019, the effective Fed Funds Rate, the volume-weighted median rate, was 2.4% while CPI was up +2.0% year-over-year.[xviii]
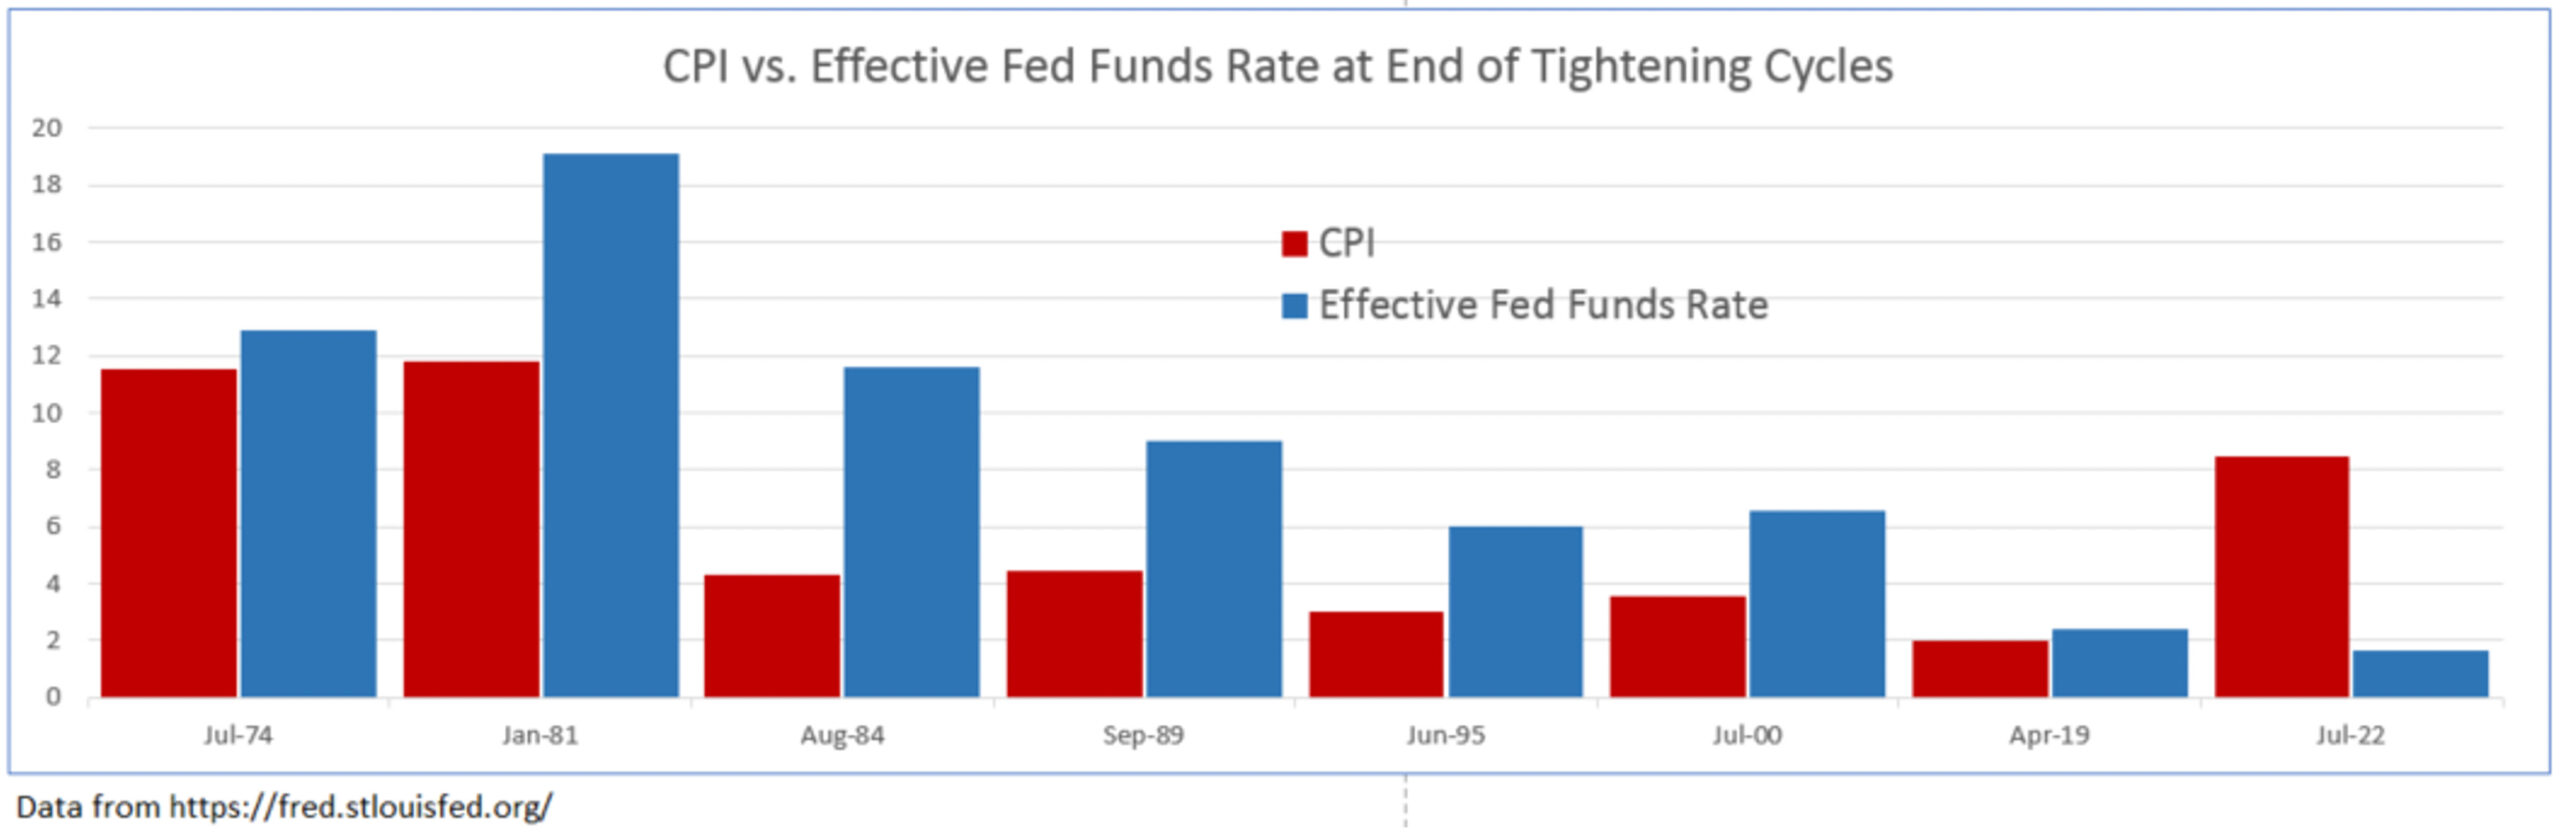
July 2022 CPI was up +8.5% year-over-year, while the effective Fed Funds Rate is only 1.68%.[xix] We find it incredulous that with over four times the amount of inflation now versus in 2019 and with the effective Fed Funds Rate lower than it was, that the Fed is at “neutral”. The Fed may very well need to raise short-term interest rates a lot more to combat inflation. If it does, we believe stocks will have a sell off.
Having stock, interest rate, and other views that diverge from the collective wisdom of the market can be quite rewarding. In 1997, Apple Inc. launched the “Think Different” advertising campaign. The slogan was launched shortly after Steve Jobs returned to Apple to counter IBM’s slogan at the time, “Think”, a campaign for their ThinkPad.[xx] Apple’s market capitalization in 1997 was around $2.3 billion[xxi] and grew to $2.6 trillion at the end of July 2022.[xxii] IBM’s market cap in 1997 was around $86 billion[xxiii] and only grew to about $119 billion at the end of July 2022.[xxiv] “Think Different” has been very rewarding for Apple—not because of the slogan, but their strategies. Over that 25-year period, excluding dividends, an investment in Apple grew over +100,000% versus IBM’s +38% growth. Howard Marks, legendary investor and co-founder of Oaktree Capital Management, recently wrote a memo to investors titled, I Beg to Differ.[xxv] Marks’ memo highlighted, among many other things, how active investing and contrarian investing are some of the few ways that investors can achieve better returns than the market. In other words, think different.
Marks’ memo has fortified our investment committee’s approach to the entire investment decision-making process. Here we list nine items that we live by each day.
1. Most investors will have average returns. They may be good or bad, but they will be average.
2. If you are happy with average returns, buy index funds and allocate the same as the respective benchmark.
3. To be above average, one must stray from consensus behavior and do something different. One must over/underweight sectors, asset classes and markets. This is “active investing”.
4. Active investing carries both the risk of below average returns and the potential reward of above average returns.
5. When one departs from the herd of passive index investing, they need to use “second-level thinking” to dig deep to develop their investment strategy.
6. Second-level thinking, as Marks describes it is different, deep, convoluted and complex. It takes into account questions, such as:
a. What is the range of future outcomes?
b. What outcome do I think will occur?
c. What is the probability I’m right?
d. What does the consensus think?
e. How does my expectation differ from consensus?
7. Contrarian thinking can be beneficial at market extremes. To effectively act contrary to the masses one must know what the herd is doing, why it is doing it, why they are wrong and what your solution is.
8. Active investing and contrary thinking carry with it the risk of being wrong in hopes of reaping the reward of being right. An active investor seeks better returns than the herd at risk of falling ehind.
9. Howard Marks says it best, “Unconventional behavior is the only road to superior investment results, but it isn’t for everyone. In addition to superior skill, successful investing requires the ability to look wrong for a while and survive some mistakes.”
The CIG investment committee takes great pride in “Think Different”. We are currently over or underweight sectors, asset classes and markets in an attempt to limit risk while seeking to provide a return to meet our clients’ goals in their financial plans. The following are just a few items that we have a different opinion on than the conventional wisdom of many investors, a group that we call “the herd”.
1. The U.S. equity markets are still historically very overvalued—the herd is “buying the dip”.[xxvi]
2. Markets likely have not priced in an extended Russia/Ukraine conflict or the possibility of a China/Taiwan conflict, even though Blackrock rates the likelihood of both “high”.[xxvii]
3. The Fed raising rates at the fastest pace since 1981 and possible quantitative tightening as we head into a recession will be quite damaging to the economy and stock markets—the herd is already placing bets on the timing of the first interest rate cut.[xxviii]
4. Inflation will remain elevated for longer than most economists forecast—The herd believes inflation has peaked and will rapidly come down and the Fed will stop raising interest rates in the near term.[xxix]
Thinking differently is what allowed us to position our portfolios defensively in 2021 and as a result, year-to-date through July 31, our CIG Dynamic Growth Strategy composite has avoided approximately 54% of the growth benchmark’s losses and our CIG Dynamic Balanced Strategy composite has avoided approximately 61% of the balanced benchmark’s losses.[xxx]
Thinking differently does not mean being universally bearish or bullish about the future. Our thinking differently at CIG is about embedding imagination, like Steve Jobs did at Apple, in repeatable processes. In our case, we assess a wide range of scenarios and possible outcomes which are dependent on the path of critical, potentially life-transformative events to help clients succeed, regardless of how interesting the times are—now or at any point in the future.
We would welcome the opportunity to connect with you via voice or email to discuss how you think (differently) about life… about the markets and the value of active investment management.
This report was prepared by CIG Asset Management and reflects the current opinion of the authors. It is based upon sources and data believed to be accurate and reliable. Opinions and forward-looking statements expressed are subject to change without notice. This information does not constitute a solicitation or an offer to buy or sell any security.
Â
[i] Zephyr: S&P 500
[ii] The Growth Benchmark is a blend of 60% Russell 3000, 25% MSCI All-Country ex U.S. and 15% Bloomberg U.S. Aggregate Bond indices. Sources: CIG, Zephyr, and Morningstar.
[iii] The Balanced Benchmark is a blend of 45% Russell 3000, 10% MSCI All-Country ex U.S. and 45% Bloomberg U.S. Aggregate Bond indices. Sources: CIG, Zephyr, and Morningstar.
[iv] Zephyr: S&P 500
[v] Zephyr: Bloomberg U.S. Aggregate Bond
[vi] Zephyr: MSCI EAFE Net
[vii] Zephyr: MSCI Emerging Markets Net
[viii] Calculated using data from finance.yahoo.com
[ix] Calculated using data from finance.yahoo.com
[x] Zephyr: MSCI EAFE net
[xi] Zephyr: Bloomberg U.S. Aggregate
[xii] Calculated using data from finance.yahoo.com
[xiii] Calculated using data from finance.yahoo.com
[xiv] Calculated using data from finance.yahoo.com
[xv] https://www.cnbc.com/2022/07/27/fed-decision-july-2022-.html
[xvi] Calculated by CIG using data from finance.yahoo.com
[xvii] Bloomberg News 07/29/2022
[xviii] Data from https://fred.stlouisfed.org/
[xix] https://fred.stlouisfed.org/
[xx] https://www.forbes.com/sites/onmarketing/2011/12/14/the-real-story-behind-apples-think-different-campaign/?sh=5f33405062ab
[xxi] https://www.thestreet.com/apple/stock/1980-to-now-the-journey-of-apples-market-cap#:~:text=Apple’s%20market%20cap%20in%201997,been%20on%20the%20IPO%20day.
[xxii] https://finance.yahoo.com/quote/AAPL?p=AAPL&.tsrc=fin-srch
[xxiii] https://www.nytimes.com/1997/05/14/business/10-years-later-ibm-sets-a-new-high-in-a-changed-market.html
[xxiv] https://finance.yahoo.com/quote/IBM/?p=IBM
[xxv] https://www.oaktreecapital.com/insights/memo/i-beg-to-differ
[xxvi] https://finance.yahoo.com/news/stocks-down-not-jim-cramer-153941061.html
[xxvii] https://www.blackrock.com/corporate/literature/whitepaper/geopolitical-risk-dashboard-july-2022.pdf
[xxviii] https://www.marketwatch.com/story/nouriel-roubini-says-investors-are-delusional-if-they-expect-the-fed-to-cut-rates-next-year-11660665215?mod=markets
[xxix] https://www.wsj.com/articles/the-markets-peak-inflation-story-fights-the-fed-11660225446
[xxx] Calculated by CIG
Image: CreativaImages/iStock
CIG Asset Management Update: Quantitative Tightening: The Fed, its Tools and Policies
Summary:
* A challenging first half of 2022.
* Will the Fed do what they say they would and reduce their balance sheet?
June 2022 Returns:
Commentary:
June 2022 brought to a close the first half of the year and proved to be a difficult month for investors. The U.S. equities, as measured by the S&P 500, were down -8.25%.[ix] International Equities were down -9.28%[x] in spite of Chinese stocks gaining +6.66% [xi] as their economy reopened from COVID lockdowns. Fixed income offered no relief and lost -3.79% as measured by the Bloomberg U.S. Aggregate Index.[xii] Gold fell -2.09%[xiii] and crude oil lost -7.77%[xiv] as the U.S. Dollar Index gained +2.66%.[xv] The S&P 500 wrapped up the first half of 2022, down -20% year-to-date, marking its worst first half performance in 50 years. 10-year U.S. Treasury bonds had their worst first half performance since 1788, just before George Washington became our first president.[xvi]
Why has the first half of 2022 delivered such unfavorable returns across so many different asset classes? We believe the end of Quantitative Easing, “QE”, may be the root cause. During QE, the Federal Reserve (Fed) bought bonds in the open market in an attempt to increase the money supply and liquidity and lower borrowing costs. QE was first used in the U.S. in reaction to the Great Financial Crisis in 2007-2008. The first three rounds of QE ballooned the Fed’s balance sheet from $900 billion to $4.5 Trillion and ended in 2014.[xvii] During the fourth round of QE, the Fed, in response to the COVID-19 pandemic, almost doubled the balance sheet from 2014 levels to nearly $9 trillion.[xviii]
We discussed the Fed balance sheet a year ago in our June 2021 CIG Asset Management Review: Inflation and Fragility. In that review, we talked about how Federal Reserve asset purchases created a massive liquidity wave which dramatically increased the discomfort of holding cash with 0% yield and amplified the desirability of buying risky stocks that investors expect will offer higher returns. We cautioned that without continued Fed intervention, volatility would likely increase. Volatility has indeed increased—significantly. For the entirety of 2021, our proprietary CIG Volatility Signal was on for only 6 out of 252 trading days (2% of the days). Year-to-date through June 30, our Signal has been on for 76 out of 124 trading days (approximately 61% of the days). We have updated the chart from our June 2021 discussion below. The strong correlation between what appears to be an ever-increasing balance sheet and a stronger stock market, the S&P 500, continued until January 2022, when the Federal Reserve suddenly pivoted from a position of “inflation is transitory” to being more hawkish.
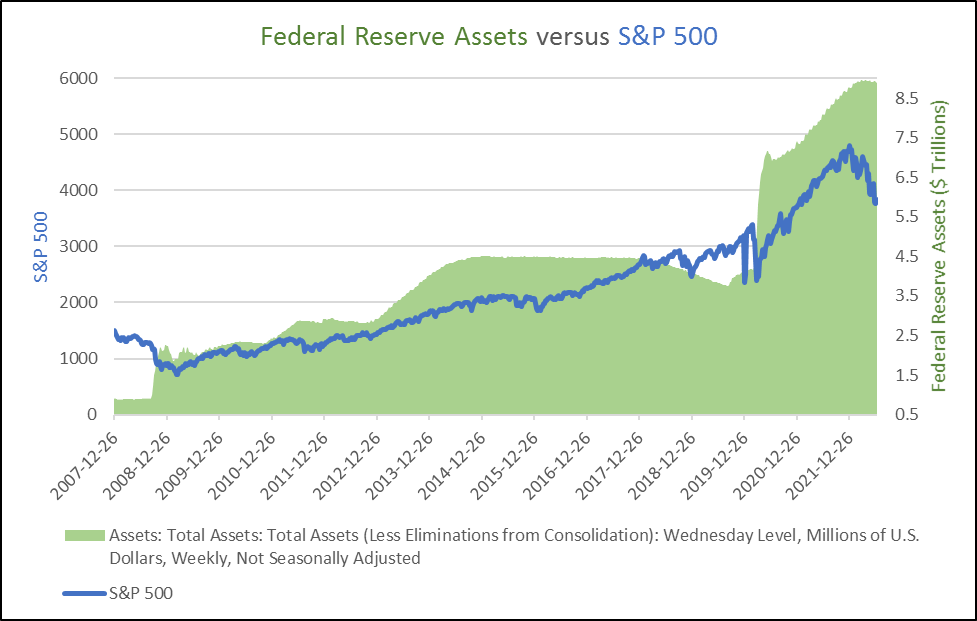
Data from: https://fred.stlouisfed.org and investing.com
On May 4, 2022, the Fed announced it would start reducing its nearly $9 trillion balance sheet on June 1 at the rate of $30 billion of treasury securities and $17.5 billion of mortgage-backed securities. This is so-called “quantitative tightening,” “QT”. Additionally, The Fed said it would increase the monthly reduction to $95 billion three months later.[xix] What progress has the U.S. Fed made in balance sheet reduction so far? The Fed only reduced its assets by $1 billion in June, which is nowhere close to the $47.5 billion that they originally talked about.[xx]
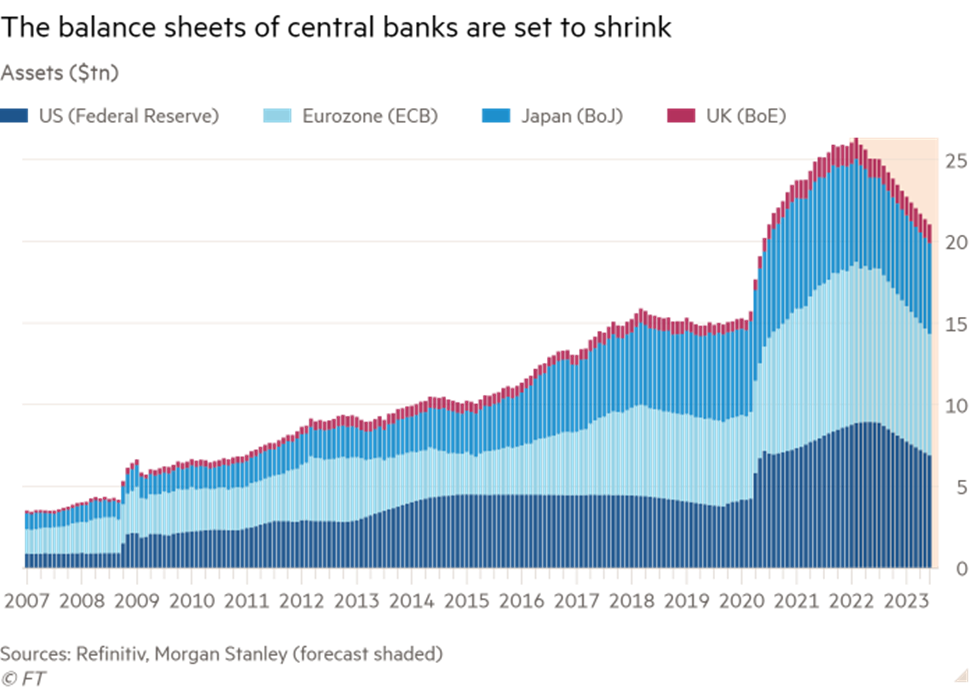
The U.S. Fed is not the only central bank considering shrinking their balance sheet and it’s no wonder, with central bank balance sheets being 5 times greater than they were before the 2008 Great Financial Crisis.[xxi] The Fed has just raised short-term interest rates from 0.25% to 1.75%.[xxii] Many economists expect the Fed to raise short-term rates an additional +0.75% at the July FOMC meeting. Suddenly, money markets and certificates of deposits offer a nominal yield. Morgan Stanley has estimated that in total, the world’s central banks may reduce their balance sheets by about $5 trillion by the end of 2023.
Could a 20% reduction in central banks’ balance sheets have a negative effect on the world’s stock markets? It is entirely possible. The Buffet Ratio, named after Warren Buffet, is a measure of total U.S. stock market capitalization to U.S. GDP. It has already fallen -22% from its all-time high of 202.5% in August 2021 to 157.5% as of June 12, 2022. The stock market, however, remains significantly overvalued, as we are simply back to the peak valuation of 157.5% in March 2000, which was right before the dot-com bubble burst.[xxiii]
Mere talk of reducing the Fed balance sheet in January sparked volatility and sent stocks into a bear market.
The Fed has gotten itself into a tough spot. Perhaps the economy will slow down so rapidly that inflation fades quickly, and the central bankers do not have to try and unload bonds. If the Fed maintains its almost $9 trillion balance sheet, or in fact increases it as a response to an unforeseen economic crisis, investors would likely be willing to take on more risk and send stocks higher. If employment remains strong and inflation remains historically high, they will be pressured to continue to raise interest rates and reduce liquidity by decreasing the balance sheet. June nonfarm payrolls were much stronger than expected, with 372,000 jobs created for the month versus the Dow Jones estimate of 250,000.[xxiv] June CPI showed inflation was up +9.1%, hotter than the +8.8% Dow Jones estimate[xxv] and the largest year-over-year increase since 1981.[xxvi]
Q2 2022 earnings season will bring the results of corporate efforts last quarter, as well as – more importantly – the outlook of those companies’ CEOs for what they see lies ahead for the rest of the year. The Federal Open Market Committee (FOMC) will meet on July 26-27 to determine how much to raise short-term interest rates. Higher rates mean less money for companies to spend on stock buybacks and real corporate expenditures and consumers to purchase goods and services.
Active management strategies are vital during periods when answers to important questions are unknown. Will the Fed do what they say they would and reduce their balance sheet? Could a 20% reduction in central banks’ balance sheets have a severely negative effect on the world’s stock markets? Will geopolitical stability be impacted? Will a “hard landing” and recession lead to no QT that brings the return of past trends or will various troubles create a future that has little similarity to history? Democratic decline, aging populations, fiscal deficits, polarizing geopolitics and deglobalization suggest uncharted territory ahead. How long this uncertainty lasts remains an open question and prudent investors must contemplate all scenarios.
Meanwhile, we “take arms against a sea of troubles”[xxvii] by continuing to take much less risk in our managed accounts versus traditional benchmarks. We will be patient and remain vigilant until some clarity is gained regarding inflation, interest rates and the direction of the economy. To QT or Not To QT: that is the question. Ah, “what [soft landing] dreams may come” from the World’s central bankers.
The Bard’s wisdom — “This above all: to thine own self be true”[xxviii] — prompts us to seek your questions, concerns and perspectives on the markets, the economy, and the value of careful active management, especially during uncertain times. We would welcome the opportunity to connect with you via voice or email.
This report was prepared by CIG Asset Management and reflects the current opinion of the authors. It is based upon sources and data believed to be accurate and reliable. Opinions and forward-looking statements expressed are subject to change without notice. This information does not constitute a solicitation or an offer to buy or sell any security.
Â
[i] The Growth Benchmark is a blend of 60% Russell 3000, 25% MSCI All-Country ex U.S. and 15% Bloomberg U.S. Aggregate Bond indices. Sources: CIG, Zephyr, and Morningstar.
[ii] The Balanced Benchmark is a blend of 45% Russell 3000, 10% MSCI All-Country ex U.S. and 45% Bloomberg U.S. Aggregate Bond indices. Sources: CIG, Zephyr, and Morningstar.
[iii] Zephyr: S&P 500
[iv] Zephyr: Bloomberg U.S. Aggregate Bond
[v] Zephyr: MSCI EAFE Net
[vi] Zephyr: MSCI Emerging Markets Net
[vii] Calculated using data from finance.yahoo.com
[viii] Calculated using data from finance.yahoo.com
[ix] Zephyr: S&P 500
[x] Zephyr: MSCI EAFE net
[xi] Calculated using data from finance.yahoo.com
[xii] Zephyr: Bloomberg U.S. Aggregate
[xiii] Calculated using data from finance.yahoo.com
[xiv] Calculated using data from finance.yahoo.com
[xv] Calculated using data from finance.yahoo.com
[xvi] https://fortune.com/2022/07/01/horror-story-charts-first-half-2022-stocks-crypto/
[xvii] Source: https://www.newyorkfed.org/markets/programs-archive/large-scale-asset-purchases
[xviii] Calculated using data from fred.stlouisfed.org
[xix] https://www.federalreserve.gov/newsevents/pressreleases/monetary20220504b.htm
[xx] https://schiffgold.com/exploring-finance/did-the-fed-forget-to-start-qt/
[xxi] Financial Times 07/10/2022
[xxii] https://www.thebalance.com/fed-funds-rate-history-highs-lows-3306135
[xxiii] https://www.gurufocus.com/stock-market-valuations.php
[xxiv] https://www.cnbc.com/2022/07/08/jobs-report-june-2022-.html
[xxv] https://www.cnbc.com/2022/07/13/inflation-rose-9point1percent-in-june-even-more-than-expected-as-price-pressures-intensify.html
[xxvi] https://www.bls.gov/news.release/cpi.nr0.htm
[xxvii] Hamlet, Act III, Scene I
[xxviii] Hamlet, Act I, Scene III
Image: DNY59/iStock
CIG Asset Management Update: The Choice for Today’s Investor: Red Pill or Blue?
Summary:
* What happens if the market steps out of Plato’s Cave?[i]
* Equity valuations are still expensive and equity duration remains historically high.
 April 2022 Returns:
In the 1999 movie The Matrix, Morpheus offers the protagonist Neo the choice between a red pill or blue pill. Morpheus says, “You take the blue pill…the story ends, you wake up in your bed and believe whatever you want to believe. You take the red pill…you stay in Wonderland, and I show you how deep the rabbit hole goes.”[x] Neo is offered a choice between continuing to live his life in contented ignorance or learning an unsettling, life-changing truth.
This type of choice was explored thousands of years earlier by Plato in his Allegory of the Cave. In it, a conversation between Plato’s brother Glaucon and Socrates describes a group of people who have lived their entire life chained in a cave facing a blank wall. These people watch shadows projected on the wall and believe the shadows are the only things that are real. What happens when one is freed from the cave to face reality; how would they cope; would they choose to return to the cave? The story goes on to assume a freed prisoner goes back to the cave to free the others so they too could learn the truth about the real world. Socrates and Glaucon conclude the other prisoners would likely kill anyone who tried to free them; that they would not want to leave the security and comfort of the world they perceived to be real.[xi]
It feels like markets have been living in the same contented ignorance as the aforementioned people in the cave and ignoring valuations. The Buffet Ratio, which is the total market capitalization of U.S. stocks divided by the Gross Domestic Product of the economy, hit a dizzying 202% on December 30, 2021. This was far more than the 143% seen back in March 2000 at the peak of the dot-com boom. While the recent sell-off in the markets has brought the Buffet Ratio back down to 170% as of April 30, 2022, it remains above the dot-com peak.[xii]
After a decade, it appears that some market participants seem to have begun stepping out of the cave to see reality. As of April 30, 2022, the S&P was down -14.3% from its all-time high hit on January 4, 2022, and the NASDAQ 100 was down -23.3% from its peak set back on November 22, 2021.[xiii] A bear market is defined as a -20% correction from the high. Surely with the NASDAQ 100 trading in bear market territory the worst is behind us, right? Not necessarily. In August 2020, we reminded investors in A Reminiscence of a Bubble Past[xiv] how the S&P 500 lost 50% and the NASDAQ lost 78% from the March 2000 peak to the October 2002 low.[xv]
As we discussed last October in What if the Bubble Bursts?[xvi], the market can trade lower for longer. It took just under 13 years for the NASDAQ 100 to recoup its losses after the dot-com bubble burst. Many investors are likely not comfortable with a 13-year time horizon where they simply just climb back to even. In April 2021, we asked the questions, Do you have enough time? Why is this time different?[xvii] and discussed how the average duration for a balanced portfolio was up to 43 years, 2.5 times longer than the historical average. The average duration corresponds to the time that it would take for investors to recoup their investment if they only received dividends and interest and never sold. The S&P 500 is +4% higher as of April 30, 2022 than it was on March 31, 2021, when the average duration was calculated.[xviii]
We are not alone in thinking that the market has become highly speculative. At the Berkshire Hathaway annual meeting on April 30th, Warren Buffet said U.S. markets have become “almost totally a casino,” and “overwhelmingly large companies in America, they became poker chips and people were buying and selling like three-day calls, two-day calls.”[xix]
Of course, markets – and the investors who participate in them – always operate across a broad range of risk with wise investment at one end and the “gambling” described above by Mr. Buffet at the other. The term speculation describes where one is on that range. Buying stocks with a “margin of safety” to protect the investment’s value in adverse conditions, like Mr. Buffett does, is considered less speculative, while uninformed or knee-jerk investments, such as short-term call option buying, are more speculative. Gambling involves the deliberate creation of new risks for the sake of diversion. Today, many investors see “investing” as a form of entertainment.[xx]
Assessing where the market is and where our clients’ portfolios should be along the range discussed above is among our most important focuses at CIG. Of course, we avoid gambling and attempt to be at the less speculative and more prudent side. Given our holistic approach and utilizing active management, The Ride[xxi] can be smoother, and clients may sleep better at night during periods like we are experiencing now.
Charles McKay, the author of Extraordinary Popular Delusions and the Madness of Crowds (1841), highlights that “Men, it has been well said, think in herds; it will be seen that they go mad in herds, while they only recover their senses slowly, and one by one” in speculative manias.[xxii] Recently, Bank of America’s Michael Hartnett discussed his Capitulation Indicators checklist suggesting that while the recovery process has begun, we have a fair way to go. For every $100 coming into the market during this cycle, only $3 has gone out. In past bear markets the average was $50 going out. Additionally, only 0.2% of industry-wide assets invested have moved out of the market versus 3% to 6% during prior market lows.[xxiii]
For those who would opt for the blue pill, we would welcome the opportunity to learn about where you think the market is and how your portfolio is positioned to weather the process of market capitulation ahead. We saw many bear market rallies during the dot-com bust, to only see the market grind lower for two more years before finally hitting rock-bottom. As of April 30th of this year, the Growth Benchmark is down -12% YTD, something not seen since the Great Financial Crisis.[xxiv]
This report was prepared by CIG Asset Management and reflects the current opinion of the authors. It is based upon sources and data believed to be accurate and reliable. Opinions and forward-looking statements expressed are subject to change without notice. This information does not constitute a solicitation or an offer to buy or sell any security.
Â
[i] https://en.wikipedia.org/wiki/Allegory_of_the_cave#Summary
[ii] The Growth Benchmark is a blend of 60% Russell 3000, 25% MSCI All-Country ex U.S. and 15% Bloomberg U.S. Aggregate Bond indices. Sources: CIG, Zephyr, and Morningstar.
[iii] The Balanced Benchmark is a blend of 45% Russell 3000, 10% MSCI All-Country ex U.S. and 45% Bloomberg U.S. Aggregate Bond indices. Sources: CIG, Zephyr, and Morningstar.
[iv] Zephyr: S&P 500
[v] Zephyr: Bloomberg U.S. Aggregate Bond
[vi] https://www.msci.com/end-of-day-data-search
[vii] https://www.msci.com/end-of-day-data-search
[viii] finance.yahoo.com
[ix] finance.yahoo.com
[x] https://en.wikipedia.org/wiki/Red_pill_and_blue_pill#Background
[xi] https://www.masterclass.com/articles/allegory-of-the-cave-explained
[xii] https://www.gurufocus.com/stock-market-valuations.php
[xiii] Calculated by CIG Asset Management using data from finance.yahoo.com
[xiv] https://cigcapitaladvisors.com/a-reminiscence-of-a-bubble-past/
[xv] Calculated by CIG Asset Management using data from finance.yahoo.com
[xvi] https://cigcapitaladvisors.com/cig-asset-management-review-what-if-the-bubble-bursts/
[xvii] https://cigcapitaladvisors.com/cig-asset-management-review-do-you-have-enough-time-why-is-this-time-different/
[xviii] Calculated by CIG Asset Management using data from finance.yahoo.com
[xix] https://www.ft.com/content/418b5af6-ce43-419e-845a-d63f303638f0
[xx] Chandler, Edward. Devil Take the Hindmost – A History of Financial Speculation.
Plume Books, 2000, page xiii.
[xxi] https://cigcapitaladvisors.com/june-2020-asset-management-update-the-ride/
[xxii] Mackay, Charles. Extraordinary Popular Delusions and the Madness of Crowds.
Harriman Definitive ed., Harriman House LTD, 2018.
[xxiii] https://cigcapitaladvisors.com/cig-asset-management-review-do-you-have-enough-time-why-is-this-time-different/
[xxiv] The Growth Benchmark is a blend of 60% Russell 3000, 25% MSCI All-Country ex U.S. and 15% Bloomberg U.S. Aggregate Bond indices. Sources: CIG, Zephyr, and Morningstar.
Image: Septimiu Balica/Pixabay
CIG Asset Management Update: Prudent Risk Management is Prudent Investment Management
Summary:
* U.S. equities before and after the March FOMC meeting
* A differentiated view and alternative assets can add value in difficult markets
Â
 March 2022 Returns:
Commentary:
Domestic equity returns for the month can best be looked at before and after the March 16th Federal Reserve (“FOMC”) meeting.
Pre-FOMC, March 1 through March 14 the S&P 500 was down -2.5%.[ix] As the Russia/Ukraine war intensified, crude oil hit a 13-year high of $130/barrel on March 7 with Europe and the U.S. considered banning all Russian oil imports.[x] On March 10, the February Consumer Price Index increased +0.8% m/m and +7.9% y/y, the highest rate since 1982.[xi] On March 15, the February Producer Price Index showed prices rising +10.0% y/y, tied with January 2022 for the biggest 12-month move since the current series began in 2011.[xii]
On March 16, the Federal Reserve raised interest rates by +0.25%, the first rate hike since 2018. In the press conference that followed the announcement, Federal Reserve Chairman Powell discussed in soothing tones[xiii] the timing of potential future rate hikes and that the Federal Reserve members are working on a plan to start to reduce the nearly $9 billion balance sheet.[xiv] “The Fed has got your back” seems to have become the dominant market narrative.
Post-FOMC, March 15 through March 31 the S&P 500 was up +8.6%.[xv] Despite reports of persistent inflation and an inversion in the yield curve, markets appeared to be encouraged that the next FOMC meeting would not take place until May 3-4. The war continued. On March 25, the University of Michigan Consumer Sentiment Index hit an 11-year low as consumers deal with the highest inflation in 40 years.[xvi] On March 29, the yield on the 5-year U.S. treasury surpassed the yield on the 10-year U.S. treasury, something that has not happened since 2006, before the Great Financial Crisis. In normal markets, as bond maturities lengthen in time, bond yields increase. An inversion in the yield curve historically has been one of the most reliable indicators of an impending recession.[xvii] Finally, on March 31, the Bureau of Economic Analysis released the February Personal Consumption Expenditures Price Index, the Fed’s favorite inflation gauge, showing a +6.4% annual increase in February, the steepest rise since February 1982.[xviii]
We continue to offer a differentiated view. Market history has taught us to be very careful during markets like the one described above. We scenario plan – we don’t forecast the market – meaning we are cognizant of the possibility of both continued upside speculation (like post-FOMC) and significant declines (like the 2000-2002 bear market). In significantly up markets like 2019, CIG captured mid to high teens for clients. When markets were more challenging in 2020, our clients were well-served by our risk-balanced strategy – an approach that strives for resilience to specific economic conditions. We currently hold positions in alternative assets, such as gold, a long/short fund, and a managed futures fund in client accounts which have increased in value year to date. Overall, we remain focused on striking the right aggressiveness versus defensiveness in client portfolios given the evolving uncertainty in the markets, economy, and geopolitics. Other market pundits appear to be more positive. On March 25, Jim Cramer on CNBC firmly stated, “I think the bear market is over!”[xix]
CIG attempts to manage the risk of the markets to try to limit losses. Risk management is key to how we think and execute – prudent investment management is prudent risk management. Given a holistic approach and utilizing active management, The Ride[xx] can be smoother, and clients may sleep better at night.
In today’s markets, how would you like to protect and then grow your nest egg to achieve your financial goals? We would welcome speaking with you to explore your needs and how you are tracking against your plan.
This report was prepared by CIG Asset Management and reflects the current opinion of the authors. It is based upon sources and data believed to be accurate and reliable. Opinions and forward-looking statements expressed are subject to change without notice. This information does not constitute a solicitation or an offer to buy or sell any security.
Â
[i] The Growth Benchmark is a blend of 60% Russell 3000, 25% MSCI All-Country ex U.S. and 15% Bloomberg U.S. Aggregate Bond indices. Sources: CIG, Zephyr and Morningstar.
[ii] The Balanced Benchmark is a blend of 45% Russell 3000, 10% MSCI All-Country ex U.S. and 45% Bloomberg U.S. Aggregate Bond indices. Sources: CIG, Zephyr and Morningstar.
[iii] Morningstar: S&P 500 TR USD
[iv] Morningstar: Bloomberg US Agg Bond TR USD
[v] https://www.msci.com/end-of-day-data-search
[vi] https://www.msci.com/end-of-day-data-search
[vii] finance.yahoo.com
[viii] finance.yahoo.com
[ix] Return calculated by CIG using data from finance.yahoo.com
[x] https://www.cnbc.com/2022/03/06/us-crude-oil-jumps-to-125-a-barrel-a-13-year-high-on-possible-western-ban-of-russian-oil.html
[xi] https://www.bls.gov/news.release/cpi.nr0.htm
[xii] https://www.bls.gov/news.release/ppi.nr0.htm
[xiii] This is how the media and market missionaries described his demeanor.
[xiv] https://www.federalreserve.gov/mediacenter/files/FOMCpresconf20220316.pdf
[xv] Return calculated by CIG using data from finance.yahoo.com
[xvi] https://news.umich.edu/inflation-top-consumer-issue-top-policy-challenge/
[xvii] https://www.chicagofed.org/publications/chicago-fed-letter/2018/404
[xviii] https://www.nytimes.com/2022/03/31/business/economy/pce-inflation-february.html
[xix] https://www.cnbc.com/video/2022/03/25/jim-cramer-says-the-bear-market-is-over.html
[xx] https://cigcapitaladvisors.com/june-2020-asset-management-update-the-ride/
Image: iStock by Getty Images
CIG Asset Management Review: Uncertainty About How Much Risk You May Be Taking Is a Risk unto Itself
Summary:
* Threat of a growing war, inflation and interest rate hike fears led equities lower
*Â Risks may be buried in your portfolio
* Will the “January Barometer” portend a bad year ahead?
Â
 January 2022 Returns:
Commentary:
So far in 2022, inflation, interest rate fears and war in Europe have led equities lower as crude oil surged +27.27% to close at $95.72 a barrel[xvii] and the yield on the 10-year U.S. Treasury bond rose +0.33% to 1.84% on February 28.[xviii] Partially because of the horrible events in Ukraine, we have seen crude oil reach $130.50 and the 10-year U.S. Treasury bond as high as 2.13%, since then on an intraday basis. Amid these events, fixed Income did not provide a safe haven, as the Bloomberg U.S. Bond AGG Index lost -3.12% in the first two months. The S&P 500 suffered its worst January since 2009, during the depths of the Great Financial Crisis.[xix] The year is off to a difficult start. But what year hasn’t over the last few?
What does a bad first month suggest for the rest of the year? In 1972, Yale Hirsch, founder of the Stock Trader’s Almanac, introduced the “January Barometer”, which simply put says, as goes the S&P 500 in January, so goes the year. Our team is focused on illuminating potential blind spots as we attempt to manage the risks of the market in efforts to protect clients’ assets. There were many events in January that underscore the importance of managing those things that may fall outside of what is clearly visible.
On January 5, the minutes from the December 2022 FOMC meeting showed the Federal Reserve was becoming more hawkish than expected. A key section of the minutes stated, “Participants generally noted that, given their individual outlooks for the economy, the labor market, and inflation, it may become warranted to increase the federal funds rate sooner or at a faster pace than participants had earlier anticipated.”[xx]
Technology stocks are particularly sensitive to interest rates and the tech-heavy NASDAQ 100 Index reacted negatively to a potentially more hawkish Fed that same day, falling -3.1%, its largest daily loss since March 2021.[xxi]
We have witnessed many investor portfolios outside of CIG that are overweight large cap information technology stocks versus a typical growth benchmark. At CIG, we have significantly limited our exposure in what we believe is an expensive sector, to approximately 55% of the benchmark allocation in our managed accounts. To those who may read this who are not currently CIG clients, we would ask, “Do you know how much risk you are taking in technology currently?”
Many investors have also chased yield in a low interest rate environment and as a result, the duration of their fixed income portfolios may have increased. These portfolios tend to have more bonds that have maturities in the 10- to 20-year range. When interest rates rise, longer duration fixed income tends to fall more than shorter duration. Corporate bonds many times also lose value as higher rates can potentially lead to more defaults.
At CIG, we have limited the duration in the fixed income portion of our portfolios to approximately 90% of the Bloomberg U.S. Agg Bond Index. We have also limited our exposure to corporate bonds to about 2% of our fixed income exposure. The benchmark currently has 24% in corporate bonds that the Federal Reserve will no longer be buying once they stop expanding the balance sheet. Do you know how much risk you are taking in the fixed income portion of your portfolio?
In Part 2 of this Market Review, we consider additional potential risks given February’s events and explore further Yale Hirsch’s January Barometer. If you would like to learn more, please click here to e-mail Brian Lasher.
Part of our mission is well-informed investors. For those who may not currently be CIG clients, we believe you would find benefit in assessing what risks exist in your portfolio – such a conversation has no downside for you. A “second opinion”, if you will, seeking nothing more than to help increase your knowledge. Please click here to schedule a strategic review with CIG Asset Management.
This report was prepared by CIG Asset Management and reflects the current opinion of the authors. It is based upon sources and data believed to be accurate and reliable. Opinions and forward-looking statements expressed are subject to change without notice. This information does not constitute a solicitation or an offer to buy or sell any security.
Â
[i] The Blended Growth Benchmark is a blend of 60% iShares Russell 3000 ETF, 25% iShares MSCI ACWI ex U.S. ETF and 15% iShares Core U.S. Aggregate Bond ETF. Sources: CIG, Hedge Fund Research, Yahoo Finance and Morningstar.
[ii] The Blended Balanced Benchmark is a blend of 45% iShares Russell 3000 ETF, 10% iShares MSCI ACWI ex U.S. ETF and 45% iShares Core U.S. Aggregate Bond ETF. Sources: CIG, Hedge Fund Research, Yahoo Finance and Morningstar.
[iii] Morningstar: S&P 500 TR USD
[iv] Morningstar: Bloomberg US Agg Bond TR USD
[v] https://www.msci.com/end-of-day-data-search
[vi] https://www.msci.com/end-of-day-data-search
[vii] finance.yahoo.com
[viii] finance.yahoo.com
[ix] The Blended Growth Benchmark is a blend of 60% iShares Russell 3000 ETF, 25% iShares MSCI ACWI ex U.S. ETF and 15% iShares Core U.S. Aggregate Bond ETF. Sources: CIG, Hedge Fund Research, Yahoo Finance and Morningstar.
[x] The Blended Balanced Benchmark is a blend of 45% iShares Russell 3000 ETF, 10% iShares MSCI ACWI ex U.S. ETF and 45% iShares Core U.S. Aggregate Bond ETF. Sources: CIG, Hedge Fund Research, Yahoo Finance and Morningstar.
[xi] Morningstar: S&P 500 TR USD
[xii] Morningstar: Bloomberg US Agg Bond TR USD
[xiii] https://www.msci.com/end-of-day-data-search
[xiv] https://www.msci.com/end-of-day-data-search
[xv] finance.yahoo.com
[xvi] finance.yahoo.com
[xvii] finance.yahoo.com
[xviii] finance.yahoo.com
[xix] https://www.ft.com/content/5cf5199c-5538-40b6-a059-d2c795108919
[xx] https://www.federalreserve.gov/monetarypolicy/fomcminutes20211215.htm
[xxi] https://www.bloomberg.com/news/articles/2022-01-05/nasdaq-100-posts-worst-day-since-march-sparked-by-fed-minutes
Image: iStock by Getty Images
CIG Asset Management Review: How To Be A More Strategic Investor In 2022
Summary:
* USÂ and developed international equities rallied
*Â The importance of remaining rational in an increasingly emotional environment
Commentary:
A Blended Growth Benchmark returned approximately 2.80% while a Blended Balanced Benchmark gained about 1.96% in December.[i] These benchmarks represent the theoretical performance of diversified passive portfolios blending indices related to geography and asset classes. During December, international stocks in developed markets were higher with the MSCI EAFE net index up +5.05%[ii], slightly besting the S&P 500 index (up +4.48%[iii]), while the MSCI Emerging Markets equities lagged, only gaining +1.62%.[iv] From an asset class perspective, Fixed Income was down slightly as with the Bloomberg US Agg Bond Index falling -0.26%.[v] Crude Oil recovered a little more than half of November’s losses, gaining +13.6% to close at 75.21 a barrel.[vi]
A recent Wall Street Journal article cited an American Psychological Association survey conducted last year that found that after two years of pandemic, nearly one-third of adults are struggling with basic decisions, including small choices like what to eat or wear.[vii] One of the experts interviewed suggested that one way to make decisions was to replace individual choices with all-encompassing principles that do the work for you. If you create and honor rules, for example, you can better assess risks, mitigate biases and act. The year ahead, as with any new year, will bring both challenges and opportunities. How we meet these challenges will impact, in our opinion, our ability to capitalize on the opportunities and manage the challenges we are presented in the market. Here is what we suggest.
Avoid looking in the rear-view mirror. While the newspaper may state that the S&P 500 has returned 8.4% each year since its inception in 1957 to December 31, 2020[viii], no one should put 100% of their retirement savings into the S&P 500. If one did, those savings could be exposed to potentially swift, unexpected losses. We explored this exposure in Risk Happens Fast. So, why would we consider the S&P 500 a benchmark for what your real-world, diversified portfolios have done? We should not.
Search for the best potential investments going forward, not what worked in the past. CNBC’s twice yearly “Millionaire Survey” discussed the inherent risk of buying and holding onto large technology stocks (FANGMAN) – “They [investors] haven’t got the guts to pull out.”[ix] For example, investors continue to ignore Apple’s missing earnings guidance in its recent quarter given the prospect of reaching a $3 trillion market capitalization. And the Apple car? Bulls have been trotting that one out since 2014. We’ve seen how a drawdown in technology stocks played out in 2000, and shared our thinking in What If the Bubble Bursts?
Pay more attention to what is going on beneath the surface. In December, Bloomberg ran a story when the S&P 500 closed at a 52-week high. It highlighted that 334 companies trading on the New York Stock Exchange hit a 52-week low, more than double the amount of those hitting 52-week highs on that same day[x]. The last time that the market experienced this Market Internal[xi] was just prior to the tech bubble collapse more than twenty years ago. We discussed other internals, as well – poor liquidity and retail trader’s share of stock market volume in Inflation and Fragility.
Consider that we are likely in uncharted territory. Over the last decade, the Federal Reserve has tried multiple times to end its various “money printing” programs, but it didn’t take long before a market downdraft caused a “U-turn.” This time, the difference is that the Fed is perceived to have lost control of inflation. On January 5, Federal Reserve meeting minutes[xii] indicated officials are considering an earlier timetable for shrinking their $9 trillion balance sheet – that’s not just raising rates or tapering buying (“printing”), that’s completely taking away the liquidity punchbowl. In our opinion, the most prudent prescription is The Return of Active Portfolio Management.
The Wall Street Journal article mentioned above concludes with advice from Annie Duke, a former professional poker player and author of How to Decide. She reminds us that many decisions can be tweaked later but we must ask, “What might be the early warning signs of an unpleasant outcome?” Active risk balanced investing can help identify potential problems, guide us through a volatile market landscape and help us in managing the outcomes.
In December, we presented our unique perspective on the current investment and economic environment via a small group gathering of select clients and prospects. To listen to the recording of our presentation, please reach out to your Wealth Manager or Brian Lasher <blasher@cigcapitaladvisors.com>.
You can find more information on this and related topics at https://cigcapitaladvisors.com/category/asset-management/.
As we enter 2022, we remain focused as always on ensuring that client portfolios are aligned with their planning objectives and long-term goals.
This report was prepared by CIG Asset Management and reflects the current opinion of the authors. It is based upon sources and data believed to be accurate and reliable. Opinions and forward-looking statements expressed are subject to change without notice. This information does not constitute a solicitation or an offer to buy or sell any security.
Â
[i] These indices shown are broad-based and used for illustrative purposes only. Past performance should not be taken as an indication or guarantee of future performance, and no representation or warranty, expressed or implied is made regarding future returns. The Blended Growth Benchmark is a blend of 60% Russell 3000 Index, 25% MSCI All-Country World Index excluding the US ETF and 15% iShares Core U.S. Aggregate Bond ETF. The Blended Balanced Benchmark is a blend of 45% Russell 3000 Index, 10% MSCI All-Country World Index excluding the US ETF and 45% iShares Core U.S. Aggregate Bond ETF.Â
Sources: CIG, Hedge Fund Research, Yahoo Finance and Morningstar
[ii]Â https://www.msci.com/end-of-day-data-search
[iii] Morningstar: S&P 500 TR USD
[iv] https://www.msci.com/end-of-day-data-search
[v] Morningstar: Bloomberg US Agg Bond TR USD
[vi] finance.yahoo.com
[vii] https://www.wsj.com/articles/decision-fatigue-is-real-heres-how-to-beat-it-this-year-11641186063
[viii] https://www.wsj.com/articles/wall-street-bets-s-p-500-will-say-goodbye-to-outsize-stock-gains-in-2022-11640514607
[ix] https://www.cnbc.com/2021/12/28/millionaires-want-to-own-a-little-less-of-everything-bubble-next-year.htmlÂ
[x] https://www.bloomberg.com/news/articles/2021-12-27/it-s-december-1999-based-on-the-nyse-shares-touching-new-lows
[xi] Market internals are a series of indicators that traders can use to get a sense of where the market is heading.
[xii] https://www.federalreserve.gov/monetarypolicy/files/fomcminutes20211215.pdf
Chess image: Carlos Esteves/Unsplash
Stock exchange board image: Pixabay/Pexels
CIG Asset Management Review: What If the Bubble Bursts?
Summary:
  * US Equities surge while international equities lag
  * Tesla and the growing stock market bubble
  * What happens when a bubble eventually bursts?
Commentary:
The S&P 500 index gained +7.01% in October, bouncing back from its September decline and closing at an all-time high.[i] Overseas markets were up, but much less so versus the U.S., with the MSCI EAFE net index up +2.38% and the MSCI Emerging markets up +0.93%.[ii] Fixed income did not offer much in the way of returns for the month with the Bloomberg US Agg Bond Index falling -0.03%.[iii] Crude oil added to September’s gains, increasing +11.38% and closing at $83.57/barrel, a 7-year high[iv], despite global growth forecasts being revised lower.[v]
We continue to be concerned that U.S. equity markets may be in a bubble. Tesla, for example, gained +44% in October.[vi] In just 2 weeks, the company gained $310 billion in market capitalization. That gain is more than the market cap of 482 companies in the S&P 500 Index.[vii] Tesla’s current market cap is over $1.2 trillion, greater than the market capitalization of Toyota, VW, Daimler, GM, Ford, BMW, Honda and Hyundai combined![viii] Tesla isn’t the only stock that may currently be overvalued.
When we look at the market using several different measuring sticks, we find more extreme valuations. The Buffet Ratio, which we have talked about before and measures total market capitalization to U.S. GDP, is at 215.5%, double the 107.5% seen in May 2007, right before the Great Financial Crisis and 50% higher than the March 2000 dot com boom high of 142.9%.[ix] The current Shiller PE ratio for the S&P 500 is 40.09. The only other time that we saw the market trade at such a high price to earnings ratio was during the dot com bubble, when the S&P 500 traded above 40x from January 1999 through September 2000.[x] No one can predict with any degree of certainty just how much larger the current bubble can get or how long it may last, but we must take note of what has happened when previous bubbles finally burst.
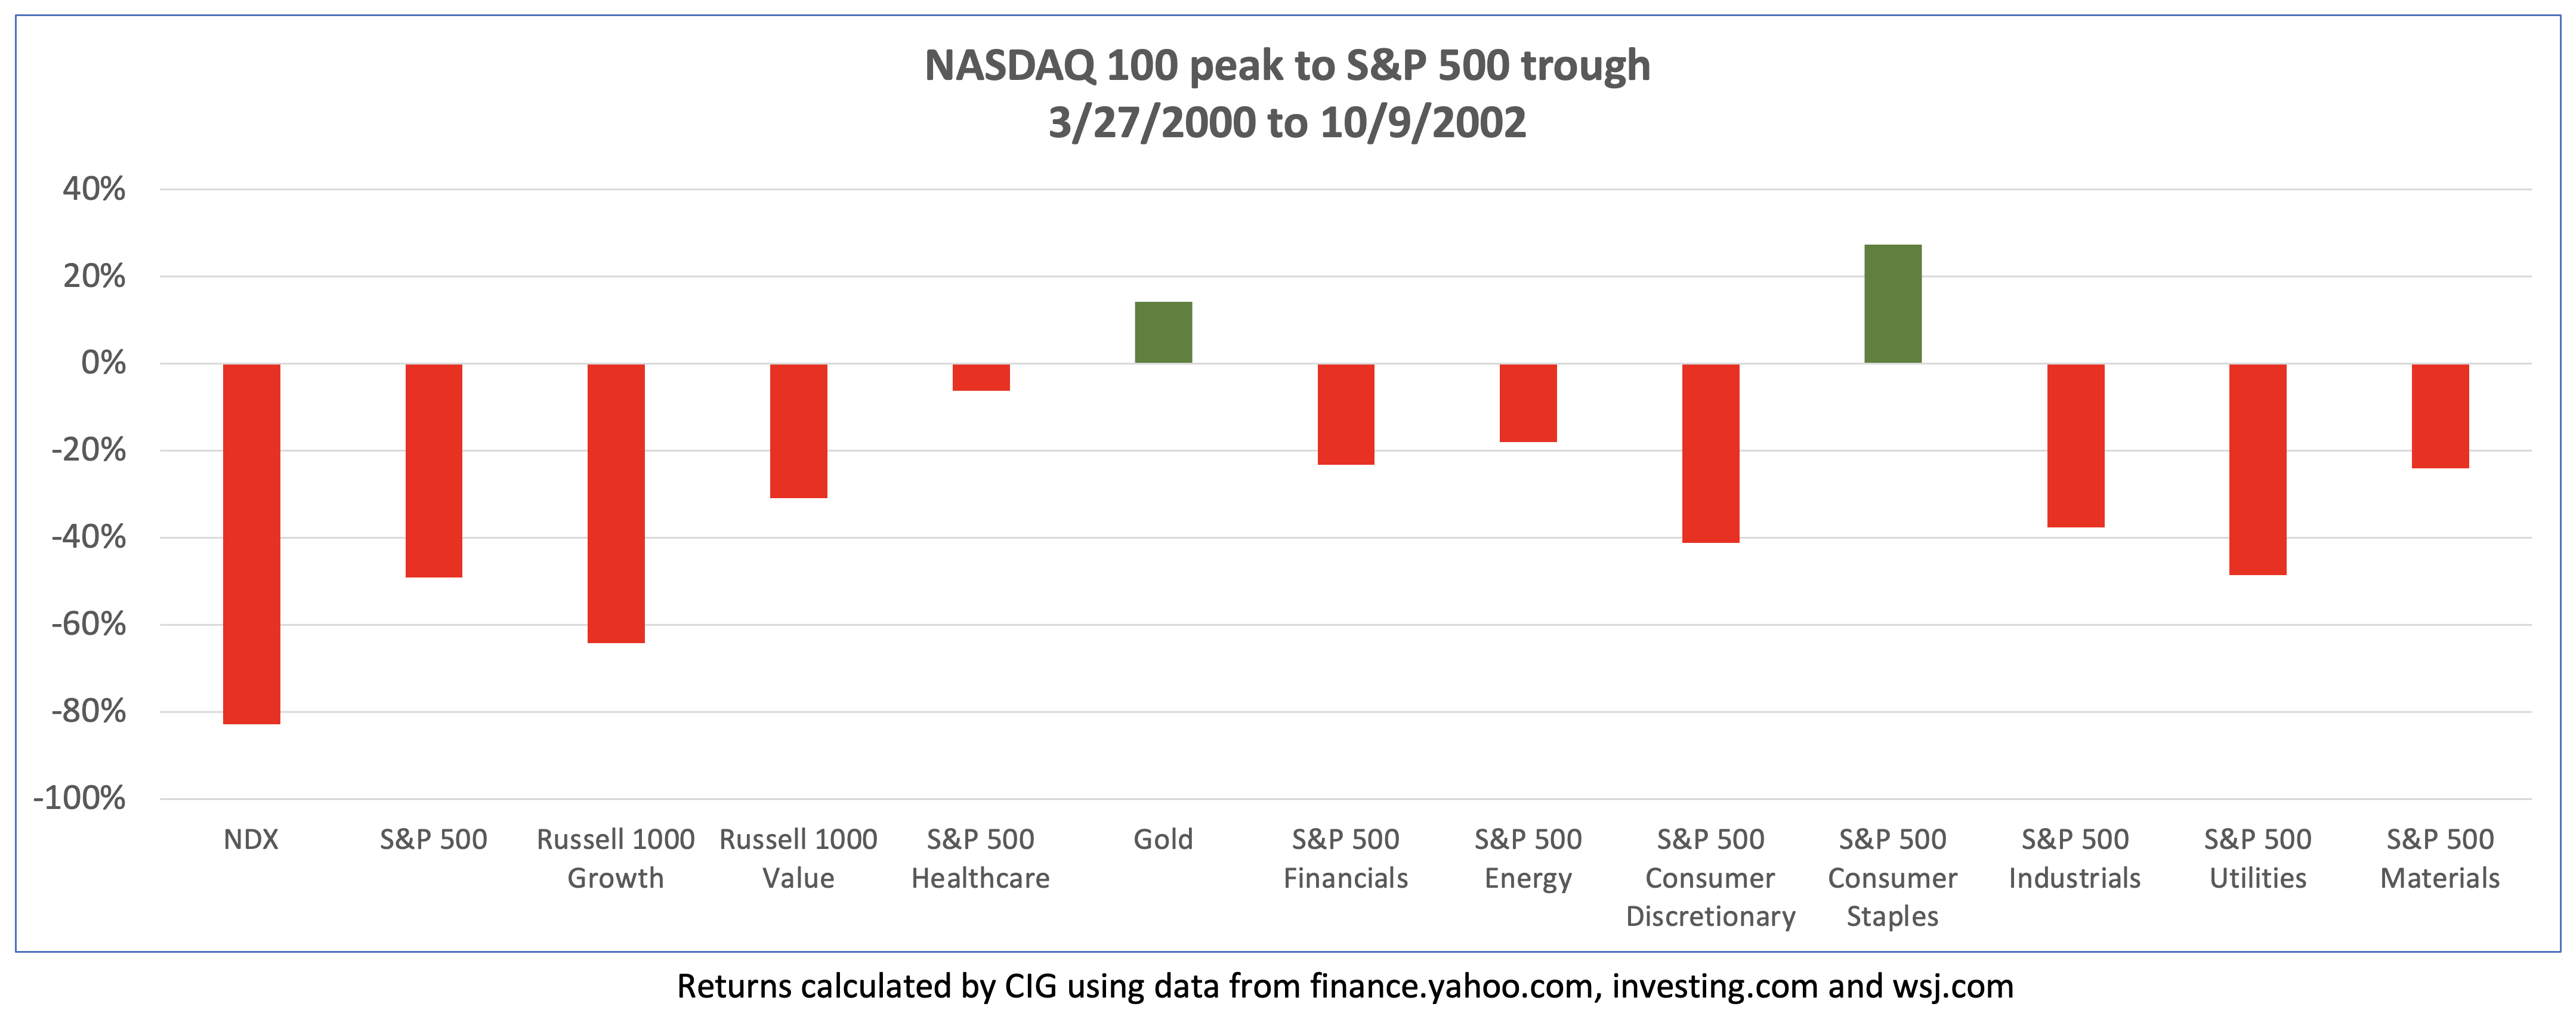
How bad can things get when a stock market bubble bursts? During what was, prior to now, the largest stock market bubble, the dot com boom, the NASDAQ 100 hit its then all-time closing high on March 27, 2000. The broader market, as measured by the S&P 500, did not reach the bottom until October 9, 2002 with a peak to trough loss of -49%.[xi] As illustrated in the chart below, a lot of money was lost in different sectors and factors during this period while gold and consumer staples, which clients currently have exposure to, gained.
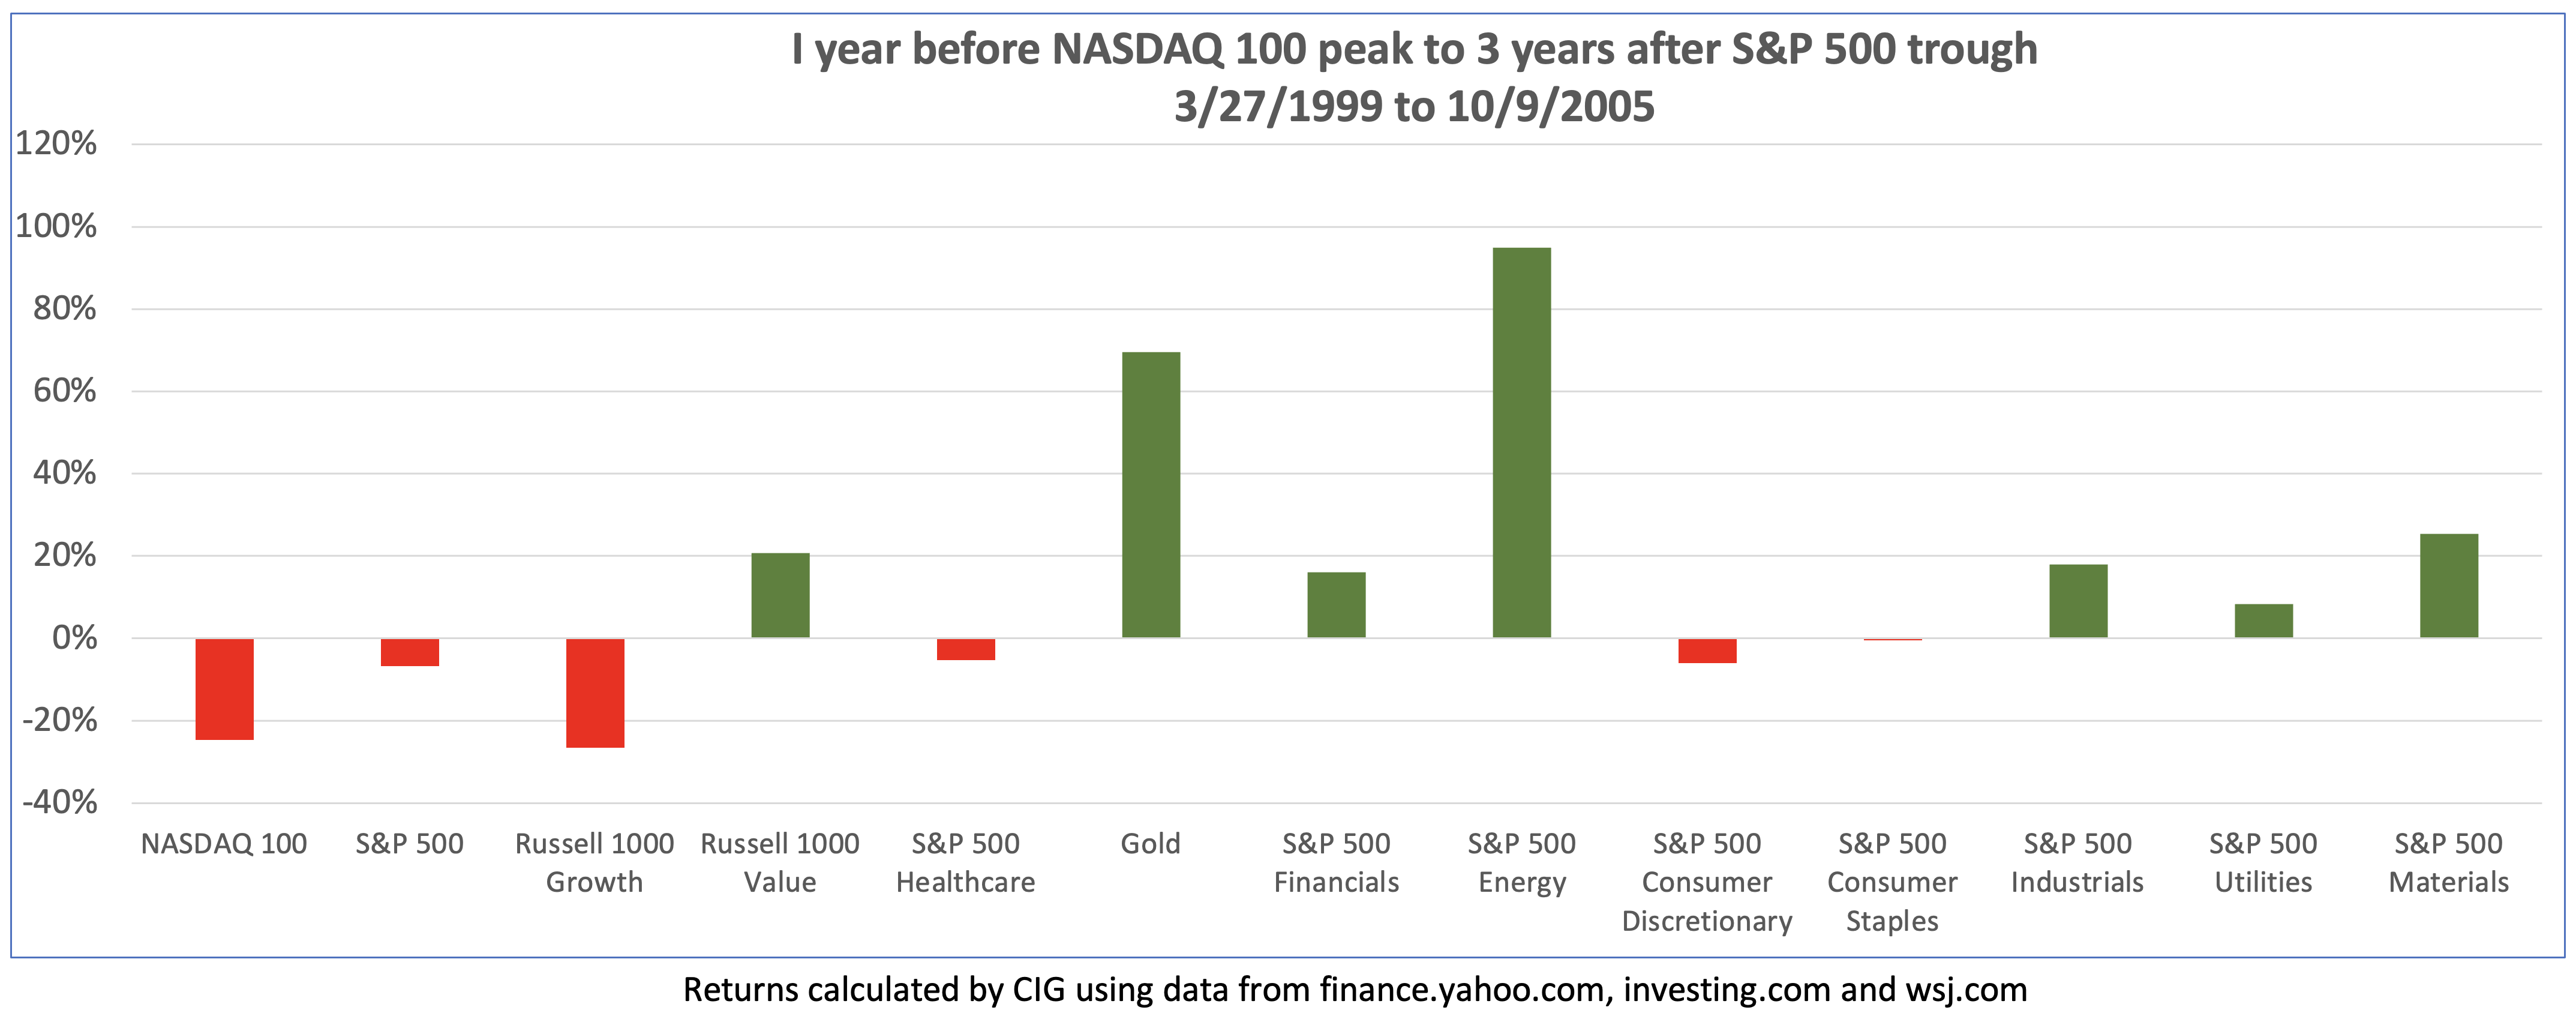
An investor would have to be extremely unlucky to buy at the top and sell at the bottom. What do returns look like if you bought one year before the top, on March 27, 1999 and held on for three years after the bottom, October 9, 2005? The S&P 500 was down -6.8%, and the NASDAQ 100 lost -24.7%. Notably, gold, energy, financials, industrials, utilities, materials, and value stocks were up.
As seen in the chart below, it took just over 7 years for the S&P 500 to get back to its March 27, 2000 high (from point (1) to point (2)). Just months after the market had recovered, the Great Financial Crisis began, and the market did not bottom out again until March of 2009. The S&P 500 did not fully recover until March 4, 2013 (point (3)). If you bought the S&P 500 on March 27, 2000, you had a very brief amount of time in 2007 to get out even, or you had to wait until March 2013 to recoup your losses, just under 13 years after the dot com peak![xii] “Do you have enough time?” was the title of a recent Asset Management Insight.
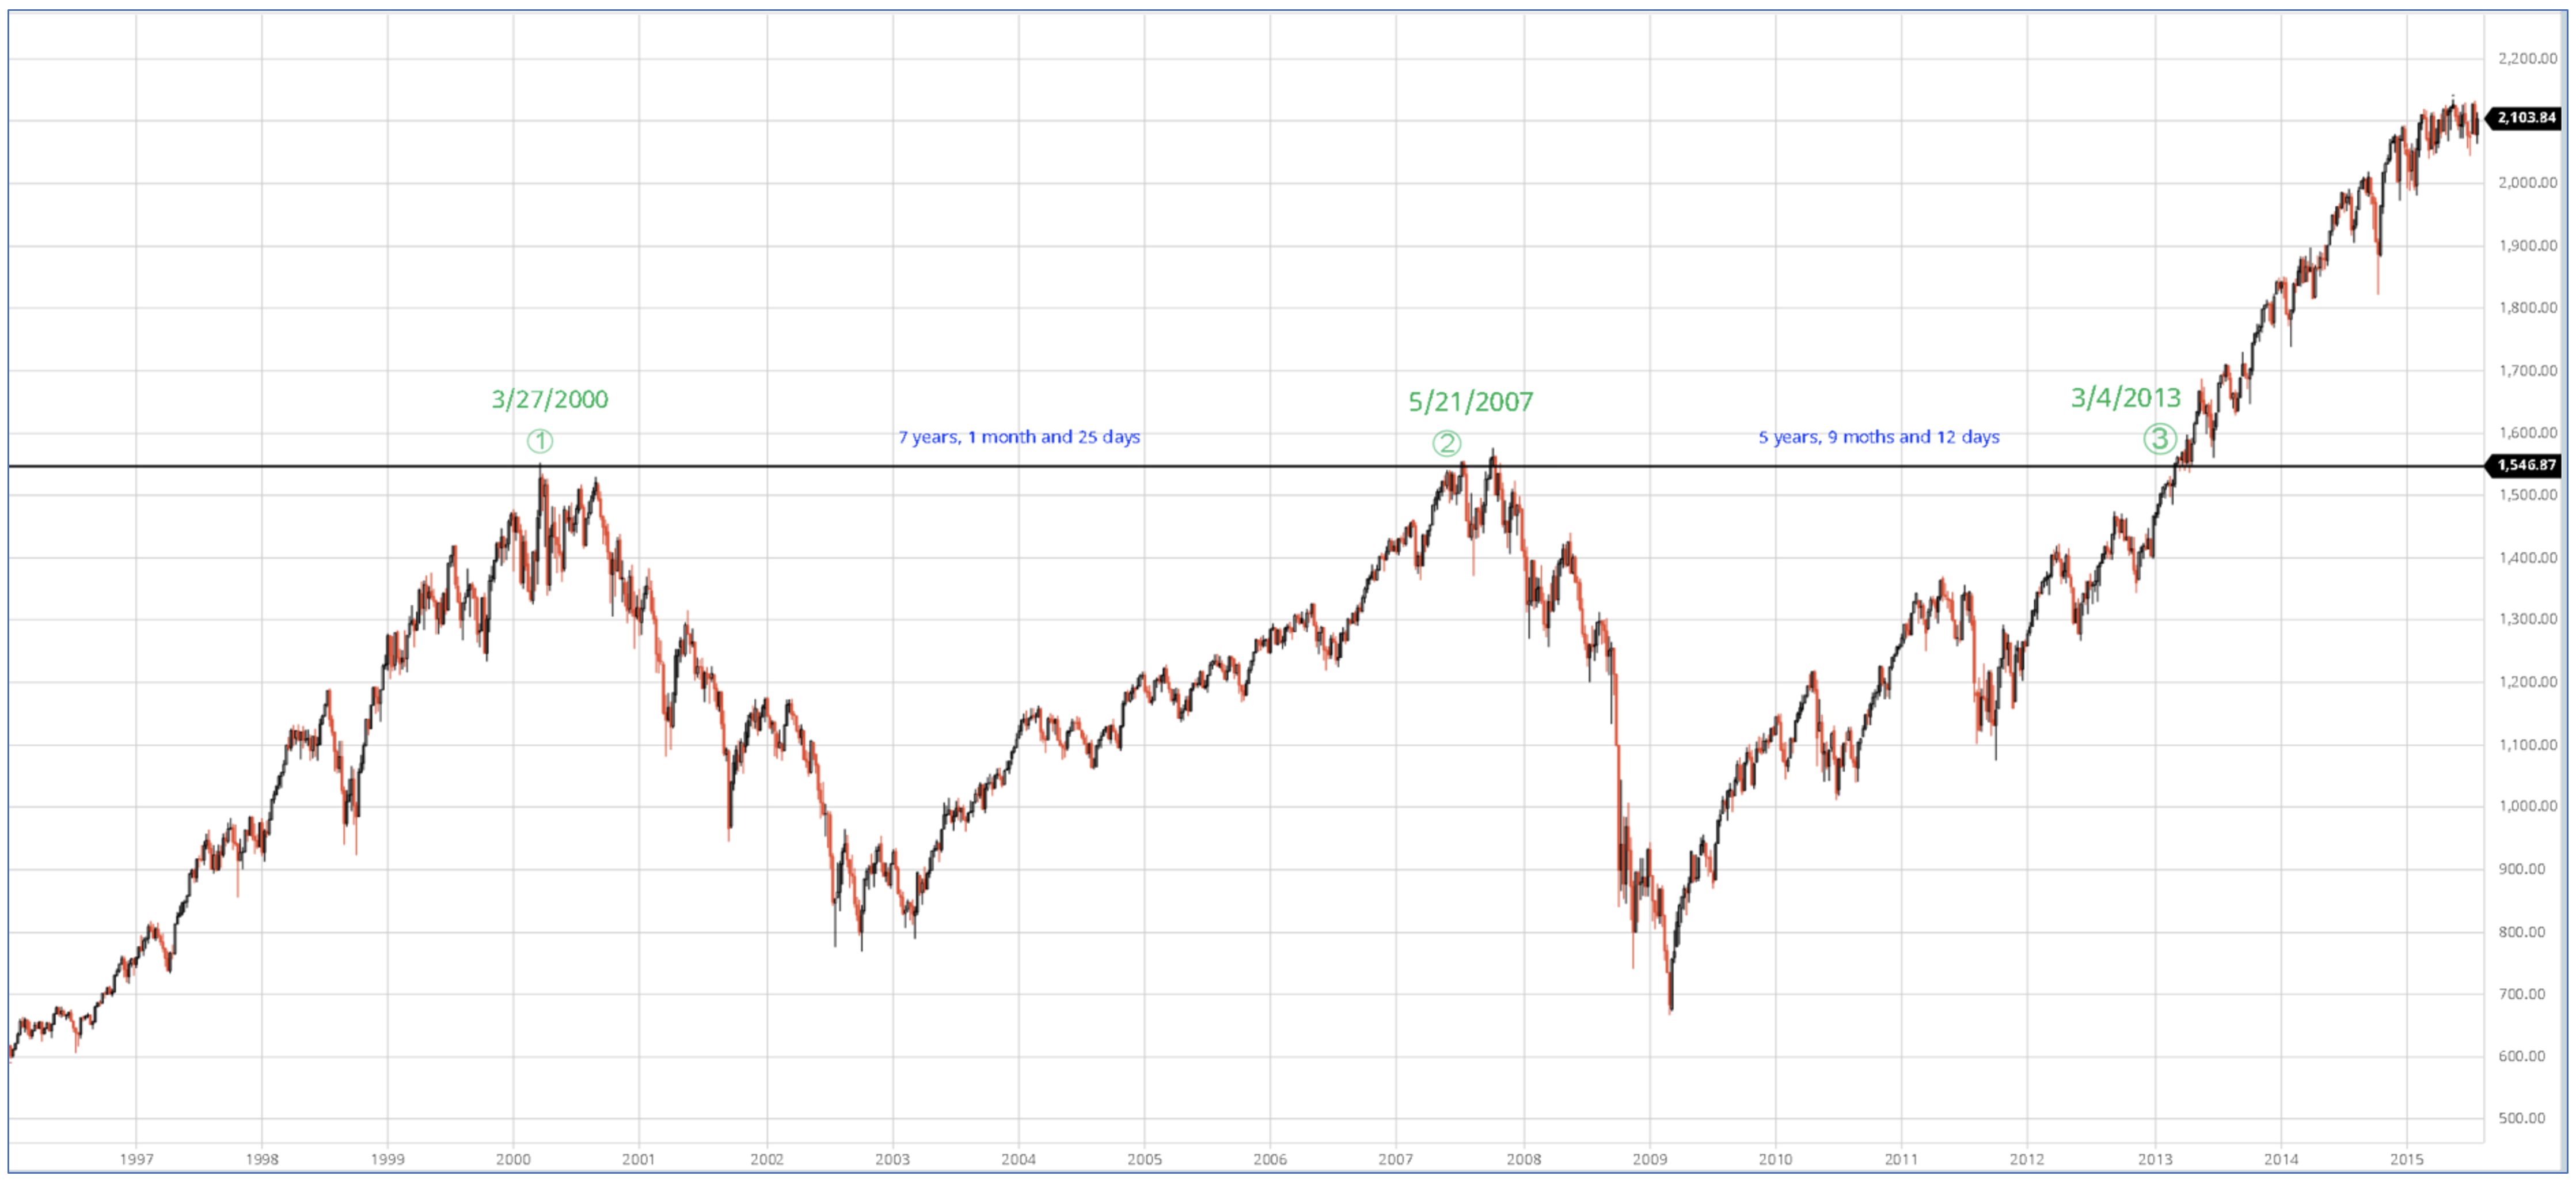
Source: barchart.com
During the dot com bubble in 1999 to 2000, many investors believed that traditional valuation metrics such as price to earnings and price to sales no longer mattered. “This time is different” was a phrase often used. During the pre-Great Financial Crisis housing bubble many believed again, “this time is different”, no money down mortgages and other financial innovations would forever change the way assets were valued, and residential real estate has never gone down on a country-wide basis. Ultimately, traditional valuation methods won out and both bubbles burst.
History has taught us to be very careful. We continue to stay the course of risk balanced investing – take enough risk to reach your goals but not much more. We remain focused on striking the right aggressiveness versus defensiveness in client portfolios given the evolving uncertainty in the markets and the economy.