
CIG Asset Management Update April 2020: Uncharted Territory
Equity markets embarked on their own version of the much hoped-for “v” shaped economic recovery during the month of April, even as economic data continued to record nasty numbers. The S&P 500(1) gained +12.7%, recovering much of the prior month’s losses. Outside of the U.S., the MSCI EAFE net(2) was up +6.5% and the MSCI Emerging Markets Index was up +9.2%(2). Within fixed income, the Barclays U.S. Aggregate Total Return Index (3) returned +1.8% and the Barclays U.S. High Yield Index(3) increased +4.5% for the month.
In April, there was a continued tug-of-war between economic reality and hopes that the worst of the pandemic may be behind us:
On Friday, April 3, it was reported that the March unemployment rate rose to 4.4%, the highest since August 2017.(4) Over the following weekend, many anecdotal news stories came out, spreading hope that COVID-19 was peaking. The ensuing Monday, April 8, the S&P 500 was up +7.03% for the day(5).
The weekly unemployment report on April 9 showed another 6.6 million in weekly claims(6), only to be quickly forgotten about as the Federal Reserve issued a statement within seconds of the Department of Labor release. The Fed announced a $2.3 trillion relief package including the Main Street Lending Program, to lend money to mid-sized businesses, and a municipal and corporate bond buying program. This latest Fed action put them far past anything they attempted during the 2008 Great Financial Crisis.
The April 16 weekly unemployment claims were 5.2 million(6), and the following day, a report that Remdesivir, an anti-viral drug may help treat symptoms of COVID-19, was made public.
Then on April 21, West Texas Intermediate oil futures settled at a negative number – never before had that happened! The following day, President Trump tweeted that we could shoot Iran boats down in the Persian Gulf, and of course, the oil and the stock markets rallied.
On April 23, weekly unemployment claims totaled 4.4 million(6). The following day, April 24, President Trump said that Apple CEO Tim Cook told him in a private conversation that he believes there will be a “v” shaped economic recovery, and markets moved higher.
April 30 weekly report brought another 3.8 million unemployed claims(6). The following weekend, several states began to gradually reopen their economies.
As can be clearly seen in the above timeline, every extremely negative economic statistic that was reported in April was met soon after by either a Federal Reserve announcement, a Trump tweet or positive news stories about pandemic hopes.
No rallies are more violent than bear market rallies and seeing April produce one of the most forceful rallies in decades fits that playbook. We would argue that the markets just followed a historic playbook given historic interventions on the monetary and fiscal fronts. Warren Buffett indicated at his May shareholders’ meeting that he’s not finding places of value to invest and has announced the selling of all airline shares with the view that the impacts of the recent crisis will not magically disappear but will take time to filter through the system.
In the meantime, what is driving the performance of the S&P 500 Index? To oversimplify, it comes down to five companies; Facebook (FB), Amazon (AMZN), Apple (AAPL), Microsoft (MSFT) and Alphabet (GOOGL). The acronym that most on Wall Street use is FAAMG. Year-to-date through April 30, the FAAMG stocks are up an average of +10% versus the other 495 companies in the S&P 500 down -13%(7).
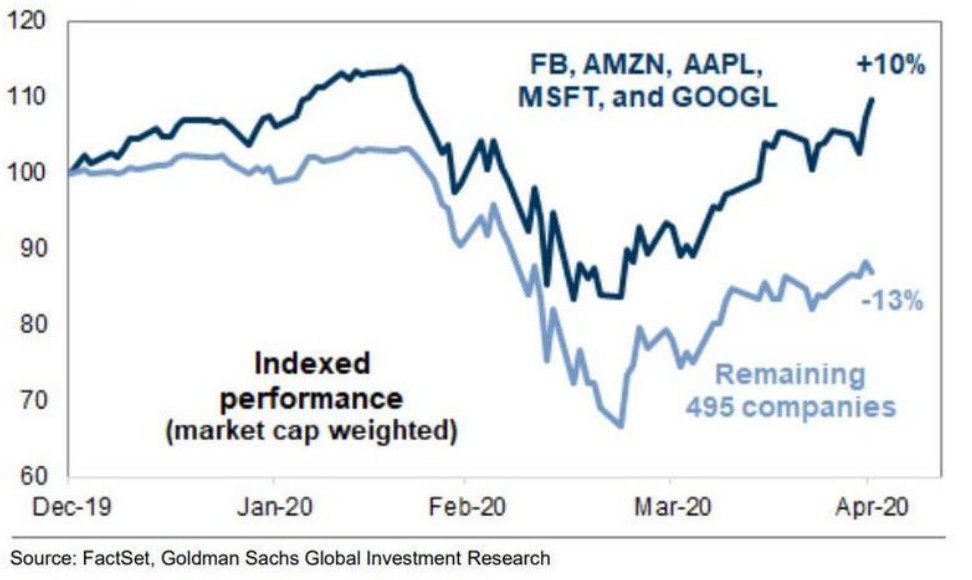
The performance spread between the FAAMG stocks and rest of the S&P 500 will most likely narrow over time. The lagging 495 stocks could begin to catch up with the leaders, FAAMG could start underperforming, or a combination of the two.
We have mentioned before that it’s not possible to forecast the path of the pandemic. In contrast to the above, states reopening and the massive Federal stimulus have already produced “green shoots” suggesting that the economy could begin to recover. Starbucks announced on May 5 they planned to open 85% of its locations by the end of the week, with contactless pickup and cashless payments. Simon Properties, the country’s largest shopping mall operator, announced it would open malls as states allow it. Recent activity on the Apple map app is showing signs that driving activity is starting to rebound. We would especially like to strike an optimistic tone on that last point.
Here at CIG we continue to be proactive and nimble as we see how long this bear market rally and tug-of-war can continue.
This report was prepared by CIG Asset Management and reflects the current opinion of the authors. It is based upon sources and data believed to be accurate and reliable. Opinions and forward-looking statements expressed are subject to change without notice. This information does not constitute a solicitation or an offer to buy or sell any security.
SOURCES:
- Calculated from data obtained from Yahoo Finance, as of May 1, 2020.
- MSCI, as of May 1, 2020
- NEPC
- Bureau of Labor Statistics, April 3, 2020
- Calculated from data obtained from Yahoo Finance, as of May 1, 2020
- United States Department of Labor.
- FactSet, Goldman Sachs Global Investment Research

CIG Asset Management Update March 2020: March Madness
Market volatility continued through the month of March and continues month to date at extreme levels. Long time readers of our updates know that we have been warning about asset bubbles and Central Banks’ recent actions since last year. Valuation, volatility and liquidity are the three main areas that we believe investors should focus on right now.
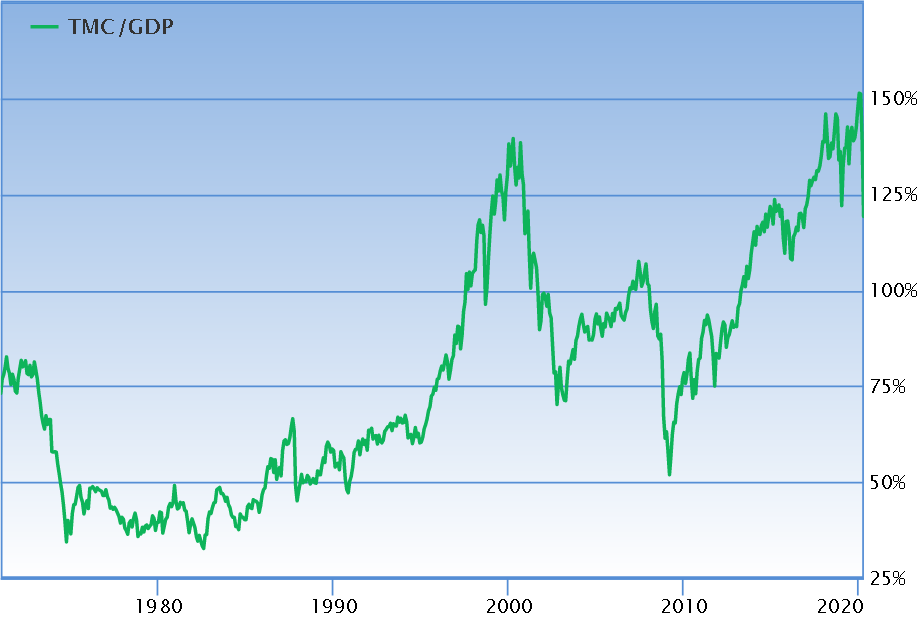
Valuation: In spite of a -20% year to date return for the S&P 500(1) through March 31st, U.S. stock market valuations are still quite high relative to the size of the U.S. economy on a historical basis. The ratio of total U.S. market capitalization to GDP (TMC/GDP), reached an all-time high of 151.3% in December 2019(2). As a result of the sharp sell-off in March 2020, TMC/GDP dropped -21% to 119.2% as of March 30th(2). As easy as it is to measure total market capitalization on a daily basis, nobody knows how much or for how long the U.S. economy (GDP) will decline. The TMC/GDP ratio fell to 75 or lower during the post-Dot Com recession in 2001 and the Great Financial Crisis in 2009. An argument could be made that if the contraction in the economy is large and persistent enough, the U.S. stock market may not have yet seen its low.
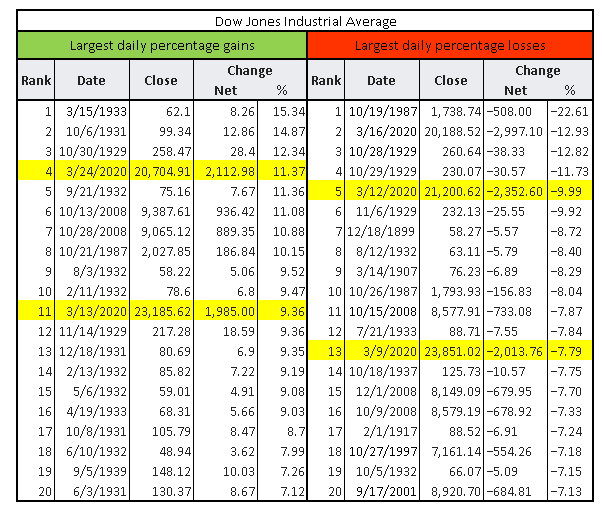
Volatility: March witnessed two of the top 20 daily percentage gains and two of the top 20 percentage daily losses for the Dow Jones Industrials Average (Dow), ever(3). Generally, these periods of extreme moves to the upside and downside have not occurred at or near market bottoms. Major market bottoms have occurred once volatility becomes more muted. Please reference the table below. As of this writing, we can add an additional top 20 up day. The Dow was up +7.7% on April 6, 2020(3).
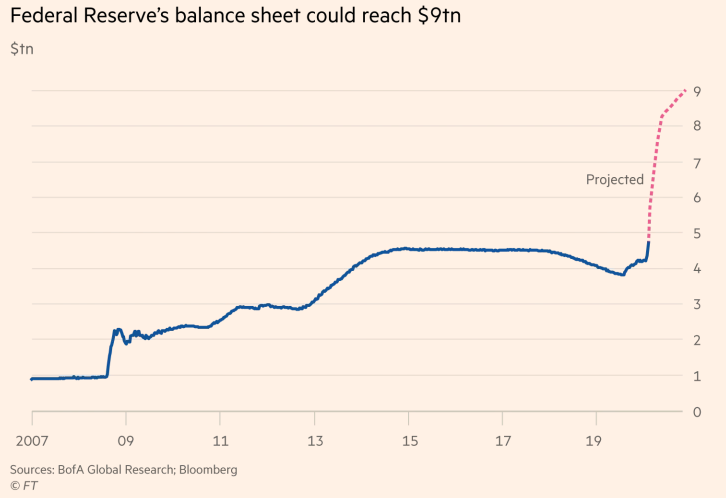
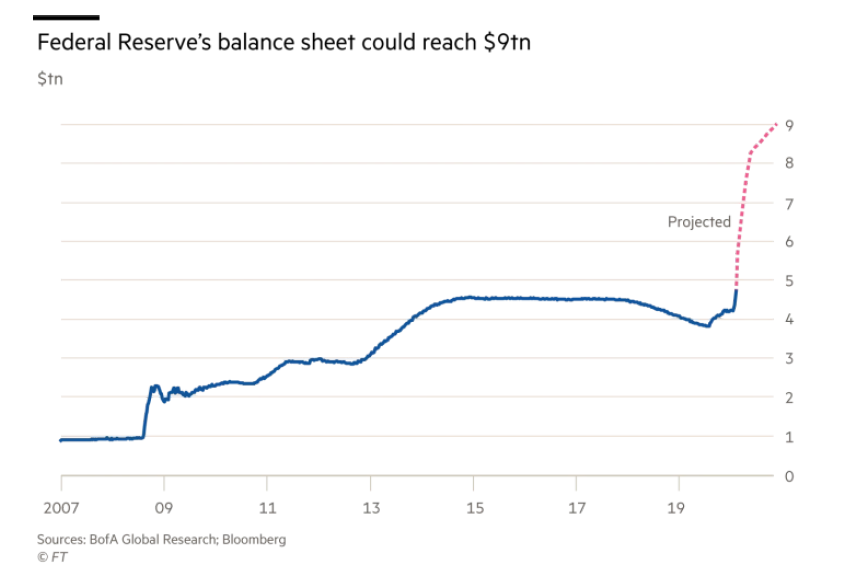
Liquidity: Following the rare emergency interest rate cut on March 3rd, the Fed cut the fed funds rate again by 1% to a 0 to 0.25% range at a subsequent emergency meeting on Sunday, March 14th. The Fed balance sheet expanded by an average $1 million per second from March 18th to March 31st. Bank of America believes the balance sheet could expand to $9 trillion by the end of the year (~40% of the U.S. economy.)(4) This is an exponential move from the expansion that began in late 2018. Typically, when the Federal Reserve pumps money into the financial system, stock market volatility calms down. In spite of unprecedented Fed action, volatility in March remained high. In fact, for the month of March, the stock market as measured by the S&P 500, moved intra-day an average of 5%, the most for any month on record. Even through the depths of the Depression or the Great Financial Crisis, the average intra-day move did not surpass 4%.(5)
Despite the continued ups and down, we would offer a little additional commentary beyond what we have discussed in the two recent webinars and above. For March, the numbers speak for themselves. The S&P 500(1) lost -12.4%, while the MSCI EAFE Net Index(6) of developed international equities was down -13.3% and the Emerging Markets Net Index(6) declined -15.4%. The Barclays U.S. Aggregate Total Return Index (7) returned -0.6% last month. The Barclays US High Yield Index(7) decreased -11.5% for the month. Hopefully, you are not too glued to CNBC or Fox Business News which we have warned house-bound market watchers about, given the media’s continued emotional rollercoaster and market manipulation (yes, we are talking about you, Bill Ackman).
In March, we kept our heads down and continued to focus on the one of the most important aspects of our relationship with clients. Beyond the investment expertise that we offer, our job is to ensure when times like this arise that we work together to restrain any exuberant investment behaviors as well as moderate our fearful investment behaviors.
The actions that we took in March in the Dynamic portfolios exemplify this goal. When the ten-year Treasury bond declined to an all-time low yield, we reduced portfolios exposures to long-term bonds. As you may recall, prices increase when bond yields fall. When it appeared that equity markets were temporarily bottoming, we increased our stock market exposure by adding to the equity hedge fund manager. During the last week of the month, when it looked like the House of Representatives would approve the CARES Act, we increased Treasury Inflation Protected Securities (TIPs) and more market sensitive equity positions. Overall, the Dynamic portfolios ended the month with more stock market exposure but not dramatically so.
Last week, we began our quarterly rebalancing of portfolios towards their strategic targets. We identified some areas that seem to be successful in this current environment, and we reduced cash and bonds that previously worked but are less likely to do so going forward. We are taking incrementally more risk via adding to defensive equities like healthcare and consumer staples. In certain portfolios, we added a “value-add” fund that is focused on a trend-following process which can work in higher-volatility markets.
On a positive note, we would quote Dr. Anthony Fauci: “You can’t rush the science, but when the science points you in the right direction, then you can start rushing.”(8) We have many laboratories looking to develop and roll out a vaccine. When the science is ready, a solution to the virus could come well before the usual 18 months. Even if we end up “going old school” and transferring plasma from previously infected individuals, we will get to the mountaintop and, ultimately, see a safer public health, economic and investment environment. Until then, we will continue to very nimble and proactive as we manage the portfolio allocation.
This report was prepared by CIG Asset Management and reflects the current opinion of the authors. It is based upon sources and data believed to be accurate and reliable. Opinions and forward-looking statements expressed are subject to change without notice. This information does not constitute a solicitation or an offer to buy or sell any security.
- Calculated from data obtained from Yahoo Finance, as of April 1, 2020.
- https://www.gurufocus.com/stock-market-valuations.php
- https://en.wikipedia.org/wiki/List_of_largest_daily_changes_in_the_Dow_Jones_Industrial_Average
- “How big could the Fed’s balance sheet get?” Financial Times, April 5, 2020 citing report from Bank of America
- Bloomberg, Jonathan Ferro as of March 31, 2020
- MSCI, as of April 1, 2020.
- NEPC
- https://www.brainyquote.com/lists/authors/top-10-anthony-fauci-quotes

Diversification Can Help Protect Against Market Crashes
The idea of diversification is very old and can be, in some cases, useful for survival. How many times in life have we heard “Don’t put your eggs all in one basket?” In investment terms, market crashes like the one we witnessed in March 2020 can happen. Losses such as these can be bad for your financial and mental health as well as your ability to meet your financial plan or retire. Diverse investment strategies and assets can behave differently in various crashes, and this differentiation of responses increases the chance your portfolio will survive a market crash. Here’s why a diversification strategy is important:
Diversification in terms of investing became more popular in the early 1990s and really took off in the early 2000s. Whether it is emerging market bonds, wind parks, real estate, etc., the diversification argument became more obvious after the DotCom Crash of 2000. At its core, diversification forces you to “buy low and sell high,” an adage that is arguably commonplace and easily mocked. But it really works. Just look at March 2020’s market returns.
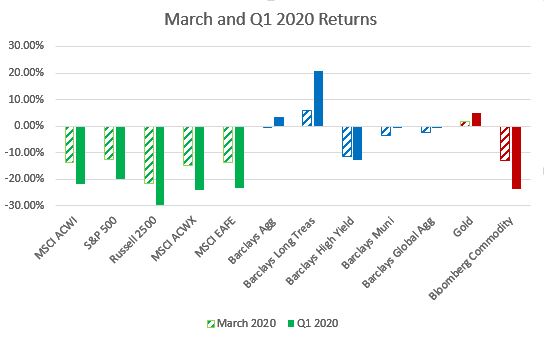
In March 2020, COVID-19 appeared to impact most asset classes. As a result of our investment strategy and process, we became worried about the asset valuations in early to mid-2019. This led us to diversify away from an over-concentration in stocks and into a more varied portfolio of assets. Consequently, we were better prepared for March 2020 and had exposure to longer-dated Treasury bonds and gold, which were some of the only major asset classes up last month.
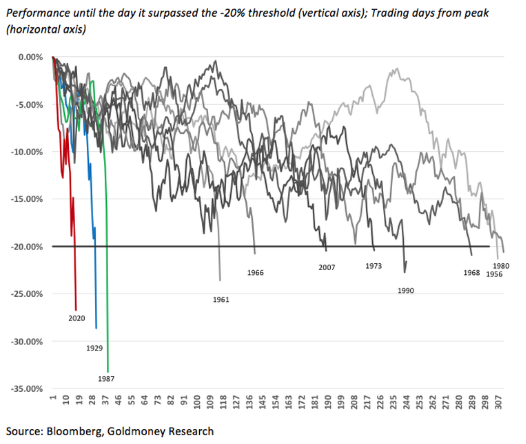
In 2019, prudence and diversification came under fire. With the S&P 500 Index up a massive 31%[i], investors with diversified portfolios felt like they left money on the table. In 2020, diversification came roaring back as investors realized the above-mentioned benefits of having parts of their portfolio perform when risky assets struggle. What a difference a few weeks and months can make! March 2020’s crash was the quickest decline in stock market history[ii]. During market crashes, diversification not only helps to potentially shore up returns, but also provides a source of money for rebalancing. With a 20% decline in equities in just under a couple of weeks, buying low and selling high is paramount for investment success over the long term.
In March 2020, the Federal Reserve balance sheet has increased +$1.1 trillion and the European Central Bank’s balance sheet has increased +$400 billion[iii]. Another $2 trillion fiscal stimulus bill is being considered in the U.S.[iv] So, we may yet again be lulled into believing that a period of elevated U.S. stock market valuations and low market volatility could persist throughout this decade. In that case, diversification may return to its regret-maximizing ways, where there will often be an underperforming asset (in this case, bonds or cash) in your portfolio that you wish you had sold, just like there will often be the asset (usually, equities) you wish you owned more of because its price went up the most. That said, when market volatility inevitably returns, you realize that staying diversified is worth it in the long run.
At CIG Capital Advisors, we attempt to pursue diversified portfolios for clients by employing the following thought processes. First, we invest only in investment choices we understand. Second, we determine investment and asset allocations based on collecting as much data as possible, employing common sense constraints, doing fundamental research, and rebalancing portfolios regularly. Lastly, we adapt to change, try to learn continuously, seek new sources of returns, and re-evaluate allocations regularly. We tend to shy away from an investment with an effortlessly smooth return history. These might or might not be safe as many of these strategies are the equivalent of picking up pennies in front of a steamroller.
While there are many known unknowns related to COVID-19, we anticipate continued volatility in the near term as the economic fallout from the pandemic is realized. As always, we maintain diversified, risk-balanced portfolios for clients to help ride out potential market selloffs, and to evaluate, and sometimes capture, the opportunities that present themselves. We conclude with a famous quote from Benjamin Graham, the British-born American investor known as the “father of value of investing,” “the essence of investment management is the management of risks, not the management of returns.”[v] Thus, diversify!

This report was prepared by CIG Asset Management and reflects the current opinion of the authors. It is based upon sources and data believed to be accurate and reliable. Opinions and forward-looking statements expressed are subject to change without notice. This information does not constitute a solicitation or an offer to buy or sell any security.
[i] Yahoo Finance
[ii] Bloomberg, Goldmoney Research
[iii] https://docs.google.com/spreadsheets/d/1s6EgMa4KGDfFzcsZJKqwiH7yqkhnCQtW7gI7eHpZuqg/edit#gid=0
[iv] Source: “How big could the Fed’s balance sheet get?” Financial Times, April 5, 2020 citing a report from Bank of America


Important Client Announcement Related to COVID-19
| At CIG Capital Advisors, the health and safety of our clients, business partners and team is our first priority. Amid the growing concerns around COVID-19, we are taking substantial measures to ensure the welfare of our clients and employees is protected: Moving In-Person Meetings to Virtual Meetings: In an effort to minimize any potential exposure, we are taking the highest level of precaution and are strongly encouraging all client service meetings be conducted in a virtual format. Should you agree to change your in-person meeting to a virtual meeting via either our secure video conference system or telephone, please contact your CIG Capital Advisors senior wealth manager. Social Distancing and our Business Continuity Plan: The Centers for Disease Control and Prevention (CDC) recommends social distancing as a measure that can help prevent the spread of COVID-19. This could eventually extend to our office environment, so in an abundance of caution, CIG Capital Advisors will conduct a trial run of a full-staff remote work day on Tuesday, March 17. Should you need to contact a CIG Capital Advisors staff member on Tuesday, the usual channels of communication like email and phone will be available per our Business Continuity Plan. Our leadership team is monitoring the situation daily, taking into account guidance from the CDC, public health agencies and state officials. We will adapt our protocols as necessary and keep you apprised of all updates and changes. Investment Management: While health and wellness must be our priority, the financial health of your portfolio is a fiduciary responsibility we take seriously every day, no matter the macro-economic conditions. However, during times of economic instability like we have seen in recent weeks, it’s natural to seek information about how your asset manager is reacting amidst the turmoil. To discuss our prudent response to the uncertainty in the global markets, we’ve scheduled a special client-only webinar on Wednesday, March 18 at 1 p.m. The webinar will last approximately 30-45 minutes. All clients are invited to register for the webinar, hosted by CIG Capital Advisors Managing Principal Osman Minkara and Vice President of Asset Management Brian Lasher; you may also want to refer to our monthly Asset Management updates and recent 2019 Asset Management Year in Review letter, all of which were previously emailed to you and can also be found on our website here. REGISTER FOR THE WEBINAR HERE: https://zoom.us/webinar/register/WN_BSWP4BA_Q-yxk9J68wm2cA Please reach out to the CIG Capital Advisors team with any questions in the meantime, and we look forward to “seeing” you virtually in the webinar on Wednesday. |

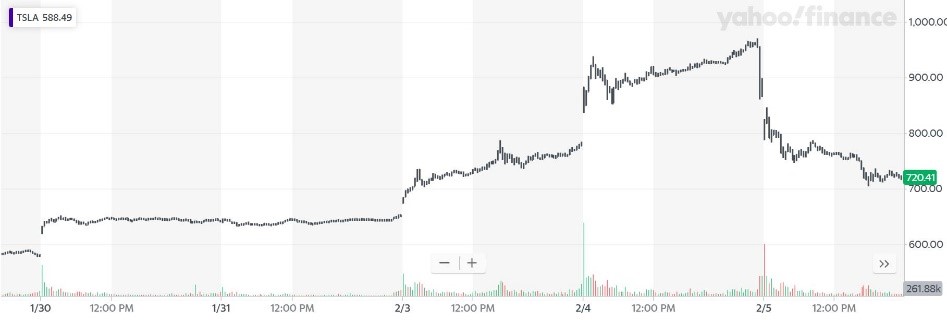
CIG Asset Management Update February 2020: The Unknown Unknowns and Our Thoughts on COVID-19
| Market volatility spiked starting at the end of February and continues today at extreme levels. Long time readers of our updates know that we have been warning about asset bubble and Central Banks’ recent actions since last year. On March 3rd, The Federal Open Market Committee (FOMC) cut the federal funds rate by 0.5 percentage points to a 1 to 1.25% range. An emergency interest rate cut between regular meetings is very rare. The last such cut was during the Great Financial Crisis (GFC) in October 2008. In fact, there have only been 7 emergency actions since October 1998. Interestingly, the FOMC took this action after only a -8.2% decline in February for the S&P 500 Total Return Index(1). Similarly other markets around the world showed “orderly” selling – the MSCI EAFE Net index of Developed Markets was down only -9.0% while Emerging Markets, as measured by the MSCI Emerging Markets Net Index, lost only -5.3% during the month(2). How have stocks performed in the past after the FOMC cuts rates unexpectedly? The answer in the table below(3) is that they tend to go lower the following 12 months. The average one year return on the S&P 500 following an emergency cut is -7.3%. The October 15, 1998 emergency cut was in reaction to a hedge fund, Long Term Capital Management (LTCM), imploding. Excluding the LTCM cut, the average one year return after the other six actions was much worse, -12.5%. 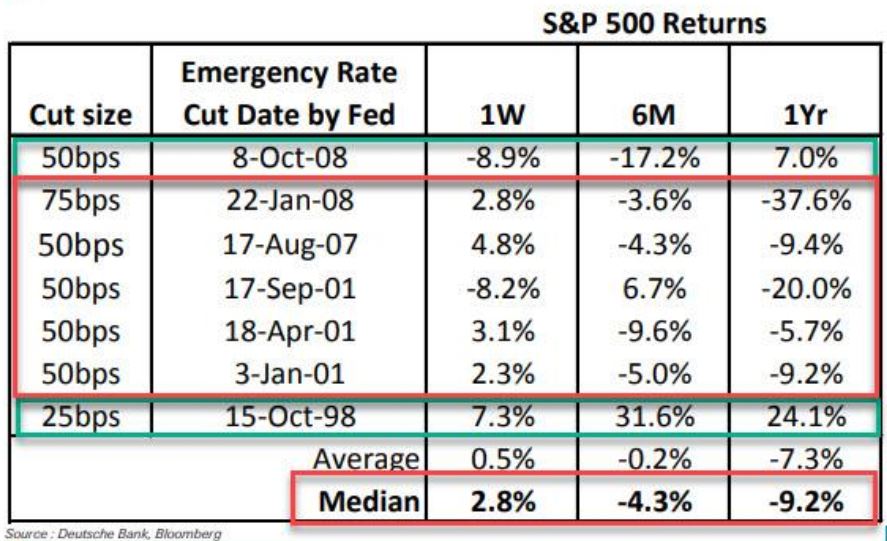 On February 20 and 21, FOMC speakers were cheerleading the market and saying that no rate cuts were necessary. We must ask ourselves, why did the Federal Reserve deem it necessary to act so suddenly? Ultimately, fears intensified over the new coronavirus (COVID-19) turning into a pandemic given that the number of new cases appearing outside of China were outpacing those within China, all this without adequate testing in many places. However, we remain skeptical that monetary policy can solve the global economic issues. Amazon, Google, Facebook and Microsoft are now pushing working from home(6). All, in addition to Apple, JP Morgan, Proctor & Gamble and others, have limited employee travel(6). Major events such as the St. Patrick’s Day Parade in Dublin have been cancelled, and forthcoming cancellations will be likely, too. Corporate management teams know that they will be forgiven if they lump as much bad news as possible into the first half of 2020 whether it is COVID-19-related or not. The bad news is likely to keep coming and the economic damage may be significant. It is possible that that Central Banks can regain control as Central Banks have managed to restrain volatility for the six previous times issues arose since the GFC. However, with the VIX at 60+, they appear to be more challenged than ever post-2008. Already, Treasury yields have reached record lows in February. Accordingly, the Barclays U.S. Long Treasury Index increased 6.7% during the month(4). Market participants are now anticipating three interest rate cuts to occur in 2020(5) and in March, Treasury yields have reached unprecedented low levels! The 30-year Treasury is below 1% as we write(1). In this high volatility environment, anything is possible and we are watching the markets and economy like a hawk. The CIG-managed portfolios have benefited from being positioned for late cycle volatility since October, with the Dynamic portfolios even more so since late February. There is massive risk to the downside as well as the upside. On the plus side, we may get a global fiscal stimulus package which would in turn boost markets. In that case, markets are very oversold, meaning assets that have traded lower/ gotten cheaper have the potential for a price bounce. On the other hand, the constant subsidy of the markets and the economy has led us to a large bond and stock market bubble and very high debt levels while the Federal Reserve has left themselves with way fewer tools. We have plans for both scenarios. CIG has a robust business continuity plan to lessen any interruption to service and allow us to remain fully operational at all times. We can accommodate a fully remote staff if necessary. We believe the communication procedures that we have in place will help ensure that there is no disruption to your service. We remain committed to meeting your expectations regarding meeting attendance and recognize that some clients may prefer conference calls or videoconferencing in lieu of in-person gatherings. Finally, we are persistently following the investment markets and repercussions of COVID-19 and will continue to communicate with you when appropriate about the portfolio impact and opportunities that are created. Until then, please stay well and support your friends and neighbors. The elderly who are deeply concerned now and neighbors without alternative childcare will need our help. As long as it is advisable, please visit your service vendors like restaurants and tip generously. We also ask that you generously give to local organizations who support the needs of lower-income families who might rely on travel, retail and hospitality sources of income. They will suffer disproportionately. Even if COVID-19 burns out in the coming months, as we hope it will, the economic issues could possibly linger for some time. This report was prepared by CIG Asset Management and reflects the current opinion of the authors. It is based upon sources and data believed to be accurate and reliable. Opinions and forward-looking statements expressed are subject to change without notice. This information does not constitute a solicitation or an offer to buy or sell any security. SOURCES: 1. Calculated from data obtained from Yahoo Finance, as of February 28, 2020. 2. MSCI, as of February 28, 2020 3. Deutsche Bank report using Bloomberg Data 4. NEPC 5. https://www.cmegroup.com/trading/interest-rates/countdown-to-fomc.html as of March 9, 2020. 6. https://www.businessinsider.com/companies-asking-employees-to-work-from-home-due-to-coronavirus-2020 |
CIG Asset Management Update January 2020: How Much to Dance?
| Meanwhile, the worsening of the coronavirus appears to have caused a plunge in bond yields in January as investors seek additional safe havens and the VIX Index(2) (the CBOE Volatility Index® which measures U.S. equity market volatility) has also risen. Consequently, we have acted in client portfolios to adjust to our perception of the ongoing exaggeration of the market environment that we talked about above and in the recent year-end letter (we highly encourage you to read it if you have not done so already.) Given these risks in the market, we continue to proceed with caution and feel that portfolio discipline remains paramount. While recessionary concerns remain low given the massive central bank stimulus around the globe, CIG’s outlook can rapidly adjust as a result of a material change in economic indicators or a dramatic shift in central bank policy. Accordingly, we ask ourselves, “How and how much do we want to dance with this market today?” |

2019 Asset Management Year in Review and Look Ahead to 2020
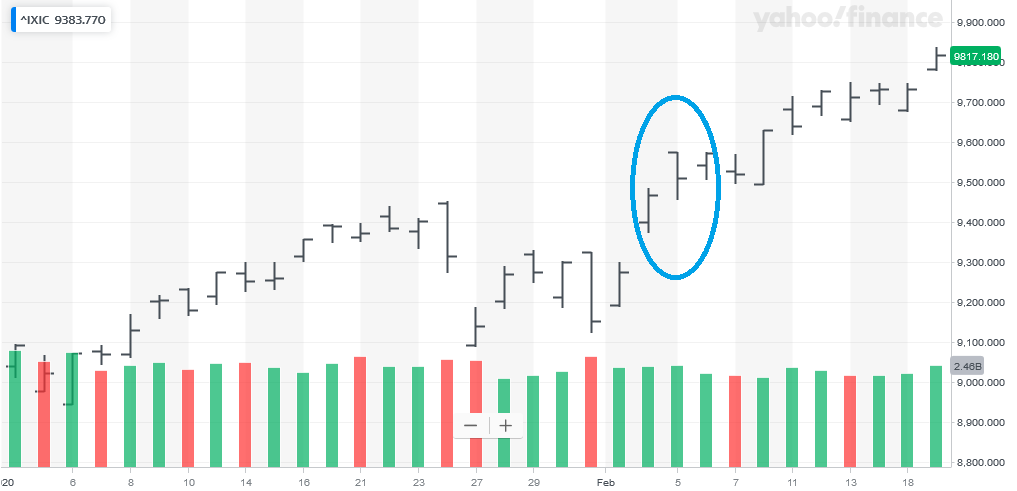
What a difference a year makes. Last December, equity markets plunged almost into bear market territory driven by fears that the Federal Reserve and their rate hikes would throw the economy into a recession. Today, the Federal Reserve is buying more treasury bills than they ever bought in prior Quantitative Easing (QE) periods and have pushed the markets to new all-time highs[1]. QT, or “Quantitation Tightening” – increasing short term rates and a shrinking Federal Reserve balance sheet – is but a vague memory now. So, just as last year’s pessimism clearly was overdone, today’s optimism is likely outpacing the economic evidence that the economy is moving to higher growth.
A measure of that is the CNN Fear & Greed Index- below reaching the “Extreme Greed” level as we started trading for 2020 versus 1 Year Ago[2].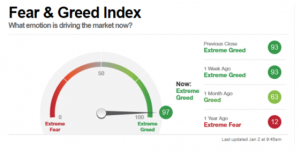
2019 was a stellar year for the equity and bond markets. Nearly every major asset class had significant outperformance versus the rate of inflation. That said, it is important to recognize 2019’s good returns were primarily driven by what investors are willing to pay for a dollar of company earnings (the “earnings multiple”), as annual earnings growth is likely to be only single digits when companies complete announcing their 2019 Fourth Quarter results this month. 2018’s disappointing equity market returns were the result of the exact opposite situation: 22% earnings growth but declining earnings multiples. You may recall from our January 2019 letter that almost no asset classes beat inflation in 2018. While such a dichotomy between the years is not unheard of, it was historically extreme as noted by Morgan Stanley[3].
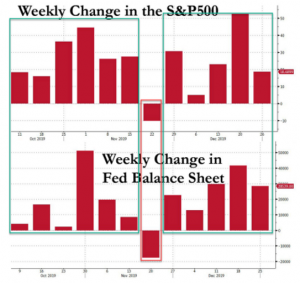
Central Banks, including the Federal Reserve, can have a large impact on earnings multiples. According to economic theory, when money growth is faster than the growth of the economy, the excess money goes into financial assets driving even expensive stocks and bonds higher. Ever since the start of October when the Fed launched QE4 in response to the September stealth banking crisis, the Federal Reserve balance sheet rose 11 of 12 weeks starting October 9, and declined just 1 of 12, and magically, the S&P did just that as well[4].
We remain concerned that the New York Federal Reserve continues to inject reserves into the banking system to keep some short-term rates from rising. This system, the overnight repo market, is where the interest rates that central banks set meet the interest rates that real economic actors use. You may recall the unrest in September in the money markets, when short-term interest rates got out of the Federal Reserve’s control and briefly spiked to 9%[5]. This could signal that something’s potentially wrong with the financial system, especially as it relates to banks and liquidity.
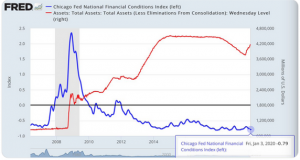
During 2019, we counted over 50 Central Bank easing actions, and global short term rates declined about -0.6%[6]. The aggressiveness of the Central Banks has been a surprise to many with the Federal Reserve, in particular, adding almost $400 billion dollars to the markets in just four months! (Note dramatic upturn in the graph below[7].)
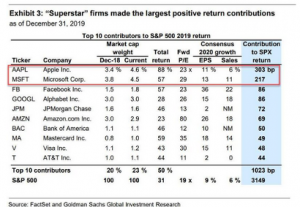
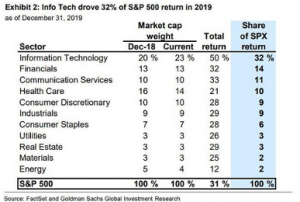
It is also remarkable how skewed the S&P 500’s 2019 return is toward a small handful of larger-cap firms and sectors. Apple (+88% return) and Microsoft (+57% return) accounted for almost one-fifth, and Information Technology was 50% of the S&P 500 index’s return. The largest source of stock buying was the companies themselves, with Information Technology buying back the most stock of any sector.
Companies buying back their own shares has been a major contributor to the rally since 2009. A Goldman Sachs analysis warns that they anticipate 2019 stock buybacks will drop 15% in 2019 to $710 billion and continue to drop in 2020. Corporate buybacks currently provide more demand for stocks than any other individual source, including households, mutual funds or exchange-traded funds. Buybacks as a percentage of trailing annual free cash flow has historically peaked near the highs of the market, i.e.: 2000, 2008, and 2016[8]. A slower pace of buybacks should not only drag on companies’ earnings per share, but also lead to increased market volatility as corporations provide less support to the equity markets.
The last time that we saw such dynamics in the market was the late 1990s, with “insurance” rate cuts, skewed returns and political risks. We remember what happened in 2000: a severe market downturn.
All of this is in the background of an investment market that wants to find a narrative to support driving asset prices higher. In December, the narrative was that the three biggest worries of 2019 have been solved during the week of December 9. On trade, the U.S. and China agreed to a “Phase One” deal and additional tariffs scheduled for December 15 were delayed. In the UK, Prime Minister Boris Johnson won a landslide victory, ensuring that “Brexit” would finally take place. Lastly, the Federal Reserve said that interest rates should remain steady through 2020. As we entered 2020, markets started off slow but now have begun to make some new highs. Given recent events in the Middle East, it feels like anything could happen.
Where does this leave the investment markets? One of the best indicators of the fair value of the stock market in the U.S. is the total market value relative to the total economy, or GDP. At this point, an argument could be made that the market is significantly overvalued, given that the total market value is almost 155% of the last reported GDP. The last time that this happened was the Dot Com Boom of the late 1990s.
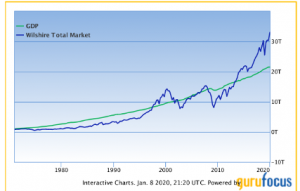
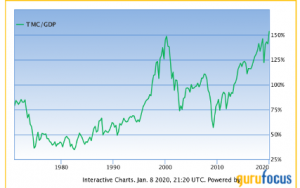
While some may argue that low interest rates and the amount of company sales overseas have impacted this ratio, on the face of it, the U.S. stock market would likely need to return about -3% per year in the next eight years to get back to the long term trend for the economy.
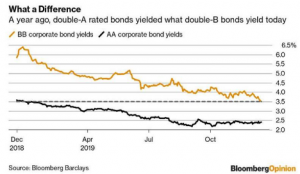
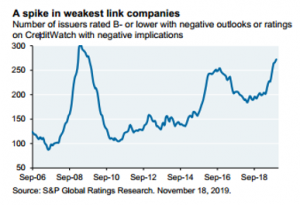
The corporate bond market has also benefited from declining interest rates over the last 18 months. As interest rates and bond yields have fallen in Europe and Japan into negative territory, investors there have bought more corporate bonds in the U.S[9]. As a result, the current market requires investors to increase risk in order to maintain the interest payments that they received in previous years. As of mid-December, the average junk bond (BB rated) yielded just 3.5%, an all-time low, including a credit premium or “spread” of just 1.64% more than risk-free Treasuries. A year before, the average high quality corporate bond (AA rated), such as those issued by Berkshire Hathaway, Apple and Exxon, was yielding 3.6%, more than the yield one now gets for bonds whose rating is some nine credit rating levels lower, in deep junk territory[10]. Meanwhile, cracks are starting to show in the lowest rated bonds[11].
Consequently, our objective in 2019 was to generate returns ahead of client financial plan targets by taking restrained risk in relation to client general risk preferences. We accomplished that by being:
- Slightly less invested in stocks and 25% less invested in bonds versus our benchmarks.
- Invested in shorter-term bonds to avoid the risk of rising interest rates.
- Diversified internationally and in alternatives investments like Gold.
- Underweight expensive corporate bonds and loans with deteriorating protections for investors like those mentioned above.
In 2020, the CIG team will continue to weigh the potential risks in the markets and plan for a wide range of scenarios, both positive and negative, while steadily reevaluating and managing the appropriate level of risk so that clients can achieve their financial plan goals. Specifically, our strategy remains consistent with prior years and will encompass:
- A core portfolio which focuses on stock and bond characteristics – Factors – that are a persistent source of investment return. We will attempt to limit the Momentum Factor in our portfolios. Momentum manifests itself in investors simply buying what has been making money (i.e., high growth names and consumer staples stocks) and selling what hasn’t (i.e., energy). The problem is that it leads to crowding into the same stocks. As soon as those stocks stop making money, these investors rush for the exits and the stocks fall significantly, which is what happened in the first two weeks of September.
- Meaningful diversification. After a 10-year equity bull market in the United States, the prudent approach for client portfolios is to have some investments in different geographies, fixed income and alternatives. We seek to deliver a nuanced, material understanding of diversification, which typically means carefully buying assets that have not appreciated and selling investors’ favorites. Diversification remains our best defense.
- A long-term approach. This methodology is particularly true in clients’ variable annuity and educational accounts, which generally do not have as extensive Factor or diversification exposure as the main portfolios.
- Tactical risk management. When the markets become, in our estimation, too volatile, we take risk management action in CIG’s Dynamic portfolios.
The bottom line is that we expect 2020’s market returns to be much lower than those of 2019 and less uniform. We continue to seek out “value-additive” investments to take advantage of market opportunities and be more contrarian and tactical to enhance portfolio returns in 2020. Markets are expensive and likely to get more expensive as a result of “easy money” from Central Banks. The risk of policymakers losing control is rising along with geopolitical risks. In this late cycle environment, CIG has taken a defensive stance and is prepared to take further action as the market direction dictates; we continue to focus on our clients’ risk-adjusted returns in support of their financial objectives and goals. In the words of Warren Buffet, the “Oracle of Omaha” and legendary investor, we will be “fearful when others are greedy and greedy when others are fearful.”
This report was prepared by CIG Asset Management and reflects the current opinion of the authors. It is based upon sources and data believed to be accurate and reliable. Opinions and forward-looking statements expressed are subject to change without notice. This information does not constitute a solicitation or an offer to buy or sell any security.
[1] Yahoo Finance
[2] https://money.cnn.com/data/fear-and-greed/ as of 1/2/20 at 9:45AM
[3] “On the Markets,” Morgan Stanley, January 2020
[4] “Market Your Calendar: Next Week The Fed’s Liquidity Drain Begins,” ZeroHedge.com, January 2020
[5] https://www.chicagofed.org/publications/chicago-fed-letter/2019/423
[6] Cornerstone Macro, November 3, 2019
[7] https://fred.stlouisfed.org/series/WALCL
[8] Goldman Sachs 10/21/2019
[9] “Even Goldman Bristles As Junk Bond Rally Smashers All Records,” Zerohedge.com, December 2019
[10] Bloomberg Opinion and Bloomberg Barclays
[11] “Eye on the Market,” J.P. Morgan
New Year Resolutions for Better Financial Health

As we approach the new year, it is a good idea to examine and review a financial health checklist and make changes as necessary. Here is a list of some of the items the CIG Capital Advisors Wealth Management team recommends you review as part of your resolution for better financial health in the new year and to help establish good personal finance habits in the years to come:
- Review and update beneficiaries. Confirm who is designated as your beneficiaries on your retirement accounts. For many people, naming beneficiaries happens one time, when they set up the account or policy. However, life changes (birth, marriage, divorce, death) are inevitable, and when these changes occur, you, or your family, may find that the designated beneficiary on your retirement account is not who you think it should be now.When it comes to planning for wealth transfers, it’s extremely important to review your beneficiaries periodically, especially if you have had children, divorced, or remarried since you first established your retirement account. This also applies if you had previously named a charity or trust as your beneficiary upon account setup and that organization no longer exists.
- Review and/or prepare for Required Minimum Distributions (RMDs) If you’re 70½ or older, you’re required by the IRS to take RMDs from certain retirement accounts by December 31—or face a penalty equal to 50% of the sum you failed to withdraw. If you turned 70½ this year, you have until April 1, 2020, to take your first RMD, albeit with potential consequences. Additionally, if you will be turning 70½ soon, now is the time to review your distribution strategy.
- Retirement Plan Contribution Increase. The contribution limit for employees who participate in 401(k), 403(b), most 457 plans, and the federal government’s Thrift Savings Plan, is increased from $19,000 to $19,500 for tax year 2020. Consider reviewing and changing your contribution limits if appropriate.
- Review Living Wills and Trusts. Most often people wait to do their estate planning and draft a Will until they absolutely have to, which is often after they have children, get married, buy a house, start a significant business or have a spouse or family member convince them of its importance. If nothing sudden or significant has happened such as the birth of a child, divorce, marriage, death of a family member, change in jobs, or change in your balance sheet or assets, then a good benchmark for reviewing your estate plan is once every five years. Otherwise, it’s a healthy habit to do a general review once a year.
- Revisit Tax Withholding. Changes in dependents, income and marital status can all affect your tax bill. Use the IRS’s withholding calculator to ensure you’re withholding enough—but not too much.
- Check your credit reports. Under the Fair Credit Reporting Act, each of the national credit-reporting agencies is required to provide you with a free copy of your credit report, upon request, once every 12 months. Get yours at annualcreditreport.com.
- Review your insurance needs. Make sure your loved ones and the things you’ve worked so hard for are protected. Ensure that there are no gaps in your home, auto, business insurance coverage.
Resolve to get take care of your financial health in the new year. To get assistance with a complete, holistic review of your financial plan, contact a CIG Capital Advisor to schedule a brief introductory call today.
CIG Asset Management Update December 2019: When Others are Greedy

November was a “risk-on” month, with the CNN Fear & Greed Index(1) reaching the “Extreme Greed” level. With the Federal Reserve buying more treasury bills than they ever bought in prior Quantitative Easing (QE) periods(2), a variety of U.S. equity indices did very well last month. The S&P 500 Index(3) returned 3.4% while riskier small company stocks, as measured by the Russell 2000 Index(3), were up 4.0%. The VIX Index(3) (The CBOE Volatility Index® which measures U.S. equity market volatility) posted a low for the year of 11.5 on November 26 as complacency in the market set in.
Given the lack of additional Central Bank stimulus, developed market foreign stocks in the MSCI EAFE Net(4) Index produced a more modest return of +1.1% while Emerging Markets as measured by the MSCI Emerging Markets Net(4), lost -0.1%. Investors also did not appear to be interested in bonds, as The Barclays U.S. Aggregate Total Return Bond Index(5) decreased by -0.1%. Surprisingly, market participants did not bid up the price of high yield issues, a traditional “risk-on” asset, with The Barclays High Yield Index(5) only gaining +0.3%.
Warren Buffet, the “Oracle of Omaha” and legendary investor, once said to be “fearful when others are greedy and greedy when others are fearful.”(6) With that in mind, the most important aspect of client relationships, beyond the investment expertise that we offer, is to ensure when these times arise and risk appetites are high, that we work together to restrain any exuberant investment behaviors. The same is true when risk appetites are low and we need to moderate our fearful investment behaviors (e.g., early 2009).
Consequently, the objective right now is to generate returns ahead of client financial plan targets by taking restrained risk in relation to client general risk preferences (i.e., growth models may look more balanced while still attempting to generate double-digit returns). In consideration of the massive QE mentioned above and trade war uncertainty, along with weakening global growth, CIG transitioned to “a later cycle approach” in portfolios during the last quarterly rebalance in furtherance of that goal. Overall, equity holdings were decreased, quality increased and fixed income increased slightly.
On the other hand, given the substantial QE (which one can wonder its rationale), the growth of the money supply has accelerated at a more rapid pace than last year. According to theory, when money growth is faster than the growth of the economy, the excess money goes into financial assets driving even expensive stocks and bonds higher. In addition, according to DataTrek, U.S. stocks rarely reverse course in a dramatic fashion after a year like 2019, but they also don’t usually do quite as well as the long run averages. The one exception was when the Federal Reserve tightened in 1937 and the S&P 500 Index delivered a -35% return(7).
We continue to weigh the potential risks in the markets and plan for a wide range of scenarios, both positive and negative, with the goal of consistently reevaluating and managing the appropriate level of risk so that clients can achieve their financial plan goals. It means delivering a nuanced, material understanding of diversification, which typically means carefully buying assets that have not appreciated and selling investors’ favorites. Diversification remains our best defense and recently healthcare stocks, a lesser performer in 2019, were increased in the portfolios. This increase in equities highlights our continued flexibility and our devotion to offering a fundamental value proposition to clients who seek long-term out-performance.
This report was prepared by CIG Asset Management and reflects the current opinion of the authors. It is based upon sources and data believed to be accurate and reliable. Opinions and forward-looking statements expressed are subject to change without notice. This information does not constitute a solicitation or an offer to buy or sell any security.
SOURCES:
- https://money.cnn.com/data/fear-and-greed/
- Market Commentary by Art Cashin, UBS Financial Services, November 13, 2019
- Calculated from data obtained from Yahoo Finance, as of 12/11/19
- MSCI, as 12/11/19
- NEPC, as of 12/11/19
- https://www.investopedia.com/articles/investing/012116/warren-buffett-be-fearful-when-others-are-greedy.asp
- From DataTrek in Market Commentary by Art Cashin, UBS Financial Services, October 16, 2019