
CIG Asset Management Update: Quantitative Tightening: The Fed, its Tools and Policies
Commentary:
June 2022 brought to a close the first half of the year and proved to be a difficult month for investors. The U.S. equities, as measured by the S&P 500, were down -8.25%.[ix] International Equities were down -9.28%[x] in spite of Chinese stocks gaining +6.66% [xi] as their economy reopened from COVID lockdowns. Fixed income offered no relief and lost -3.79% as measured by the Bloomberg U.S. Aggregate Index.[xii] Gold fell -2.09%[xiii] and crude oil lost -7.77%[xiv] as the U.S. Dollar Index gained +2.66%.[xv] The S&P 500 wrapped up the first half of 2022, down -20% year-to-date, marking its worst first half performance in 50 years. 10-year U.S. Treasury bonds had their worst first half performance since 1788, just before George Washington became our first president.[xvi]
Why has the first half of 2022 delivered such unfavorable returns across so many different asset classes? We believe the end of Quantitative Easing, “QE”, may be the root cause. During QE, the Federal Reserve (Fed) bought bonds in the open market in an attempt to increase the money supply and liquidity and lower borrowing costs. QE was first used in the U.S. in reaction to the Great Financial Crisis in 2007-2008. The first three rounds of QE ballooned the Fed’s balance sheet from $900 billion to $4.5 Trillion and ended in 2014.[xvii] During the fourth round of QE, the Fed, in response to the COVID-19 pandemic, almost doubled the balance sheet from 2014 levels to nearly $9 trillion.[xviii]
We discussed the Fed balance sheet a year ago in our June 2021 CIG Asset Management Review: Inflation and Fragility. In that review, we talked about how Federal Reserve asset purchases created a massive liquidity wave which dramatically increased the discomfort of holding cash with 0% yield and amplified the desirability of buying risky stocks that investors expect will offer higher returns. We cautioned that without continued Fed intervention, volatility would likely increase. Volatility has indeed increased—significantly. For the entirety of 2021, our proprietary CIG Volatility Signal was on for only 6 out of 252 trading days (2% of the days). Year-to-date through June 30, our Signal has been on for 76 out of 124 trading days (approximately 61% of the days). We have updated the chart from our June 2021 discussion below. The strong correlation between what appears to be an ever-increasing balance sheet and a stronger stock market, the S&P 500, continued until January 2022, when the Federal Reserve suddenly pivoted from a position of “inflation is transitory” to being more hawkish.
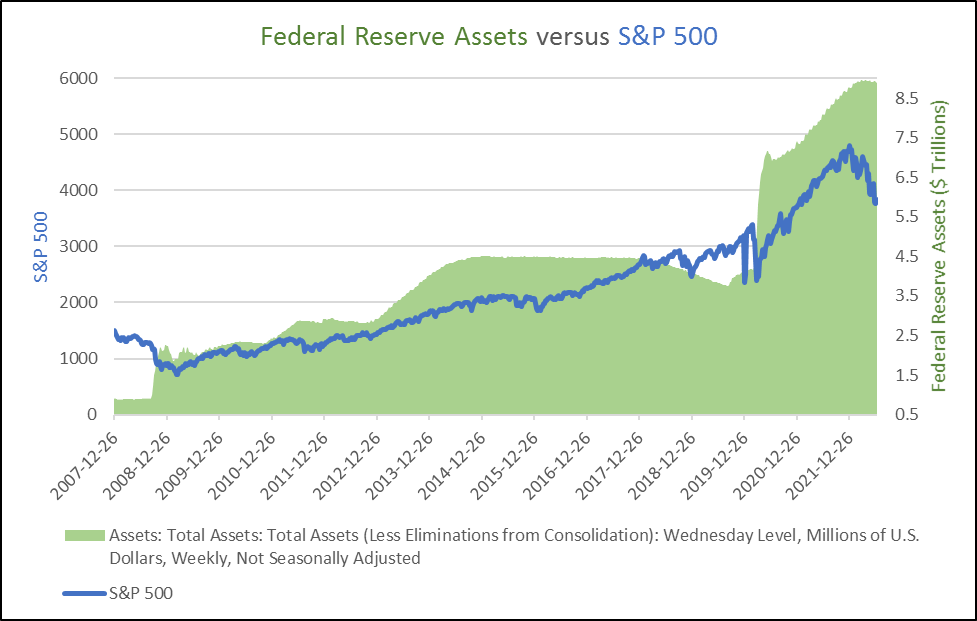
Data from: https://fred.stlouisfed.org and investing.com
On May 4, 2022, the Fed announced it would start reducing its nearly $9 trillion balance sheet on June 1 at the rate of $30 billion of treasury securities and $17.5 billion of mortgage-backed securities. This is so-called “quantitative tightening,” “QT”. Additionally, The Fed said it would increase the monthly reduction to $95 billion three months later.[xix] What progress has the U.S. Fed made in balance sheet reduction so far? The Fed only reduced its assets by $1 billion in June, which is nowhere close to the $47.5 billion that they originally talked about.[xx]
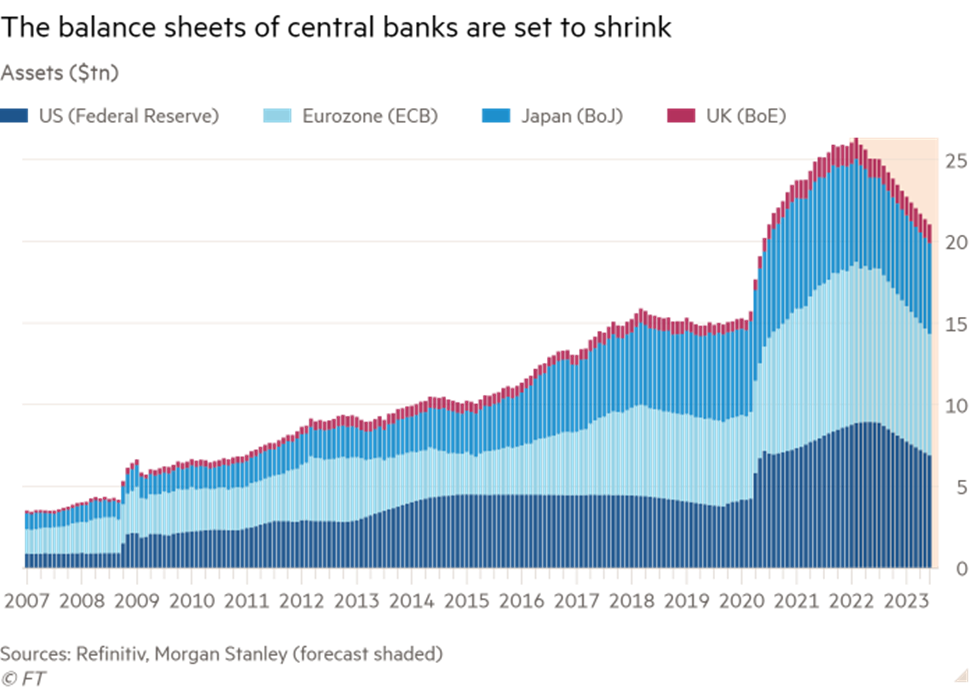
The U.S. Fed is not the only central bank considering shrinking their balance sheet and it’s no wonder, with central bank balance sheets being 5 times greater than they were before the 2008 Great Financial Crisis.[xxi] The Fed has just raised short-term interest rates from 0.25% to 1.75%.[xxii] Many economists expect the Fed to raise short-term rates an additional +0.75% at the July FOMC meeting. Suddenly, money markets and certificates of deposits offer a nominal yield. Morgan Stanley has estimated that in total, the world’s central banks may reduce their balance sheets by about $5 trillion by the end of 2023.
Could a 20% reduction in central banks’ balance sheets have a negative effect on the world’s stock markets? It is entirely possible. The Buffet Ratio, named after Warren Buffet, is a measure of total U.S. stock market capitalization to U.S. GDP. It has already fallen -22% from its all-time high of 202.5% in August 2021 to 157.5% as of June 12, 2022. The stock market, however, remains significantly overvalued, as we are simply back to the peak valuation of 157.5% in March 2000, which was right before the dot-com bubble burst.[xxiii]
Mere talk of reducing the Fed balance sheet in January sparked volatility and sent stocks into a bear market.
The Fed has gotten itself into a tough spot. Perhaps the economy will slow down so rapidly that inflation fades quickly, and the central bankers do not have to try and unload bonds. If the Fed maintains its almost $9 trillion balance sheet, or in fact increases it as a response to an unforeseen economic crisis, investors would likely be willing to take on more risk and send stocks higher. If employment remains strong and inflation remains historically high, they will be pressured to continue to raise interest rates and reduce liquidity by decreasing the balance sheet. June nonfarm payrolls were much stronger than expected, with 372,000 jobs created for the month versus the Dow Jones estimate of 250,000.[xxiv] June CPI showed inflation was up +9.1%, hotter than the +8.8% Dow Jones estimate[xxv] and the largest year-over-year increase since 1981.[xxvi]
Q2 2022 earnings season will bring the results of corporate efforts last quarter, as well as – more importantly – the outlook of those companies’ CEOs for what they see lies ahead for the rest of the year. The Federal Open Market Committee (FOMC) will meet on July 26-27 to determine how much to raise short-term interest rates. Higher rates mean less money for companies to spend on stock buybacks and real corporate expenditures and consumers to purchase goods and services.
Active management strategies are vital during periods when answers to important questions are unknown. Will the Fed do what they say they would and reduce their balance sheet? Could a 20% reduction in central banks’ balance sheets have a severely negative effect on the world’s stock markets? Will geopolitical stability be impacted? Will a “hard landing” and recession lead to no QT that brings the return of past trends or will various troubles create a future that has little similarity to history? Democratic decline, aging populations, fiscal deficits, polarizing geopolitics and deglobalization suggest uncharted territory ahead. How long this uncertainty lasts remains an open question and prudent investors must contemplate all scenarios.
Meanwhile, we “take arms against a sea of troubles”[xxvii] by continuing to take much less risk in our managed accounts versus traditional benchmarks. We will be patient and remain vigilant until some clarity is gained regarding inflation, interest rates and the direction of the economy. To QT or Not To QT: that is the question. Ah, “what [soft landing] dreams may come” from the World’s central bankers.
The Bard’s wisdom — “This above all: to thine own self be true”[xxviii] — prompts us to seek your questions, concerns and perspectives on the markets, the economy, and the value of careful active management, especially during uncertain times. We would welcome the opportunity to connect with you via voice or email.

CIG Asset Management Update: Stagflation – Is a Perfect Storm Forming?
Commentary:
Energy prices continued to climb during the month of May, adding to fears that inflation may be persistent. Natural gas gained +12.4%, adding to its +28.3% gain in April.[ix] Crude oil advanced +9.53% for the month to $114.67 per barrel.[x] The S&P 500 hit its 52-week low on May 20 and briefly entered “bear market territory”, down -20% from its all-time high and then bounced in the last week of trading to close up for the month.
Stagflation is the “perfect storm” of negative news: rising unemployment, rising costs and a slowing economy. The classical definition is persistent inflation combined with stagnant consumer demand and relatively high unemployment. Is the U.S. economy about to be hit by a stagflation storm the likes of which have not been seen since the 1970s? Let’s consider each of these indicators:
Is the U.S. economy experiencing persistent inflation? Yes. Personal Consumption Expenditures Index excluding Food and Energy was up +4.9% year-over-year in April 2022.[xi]

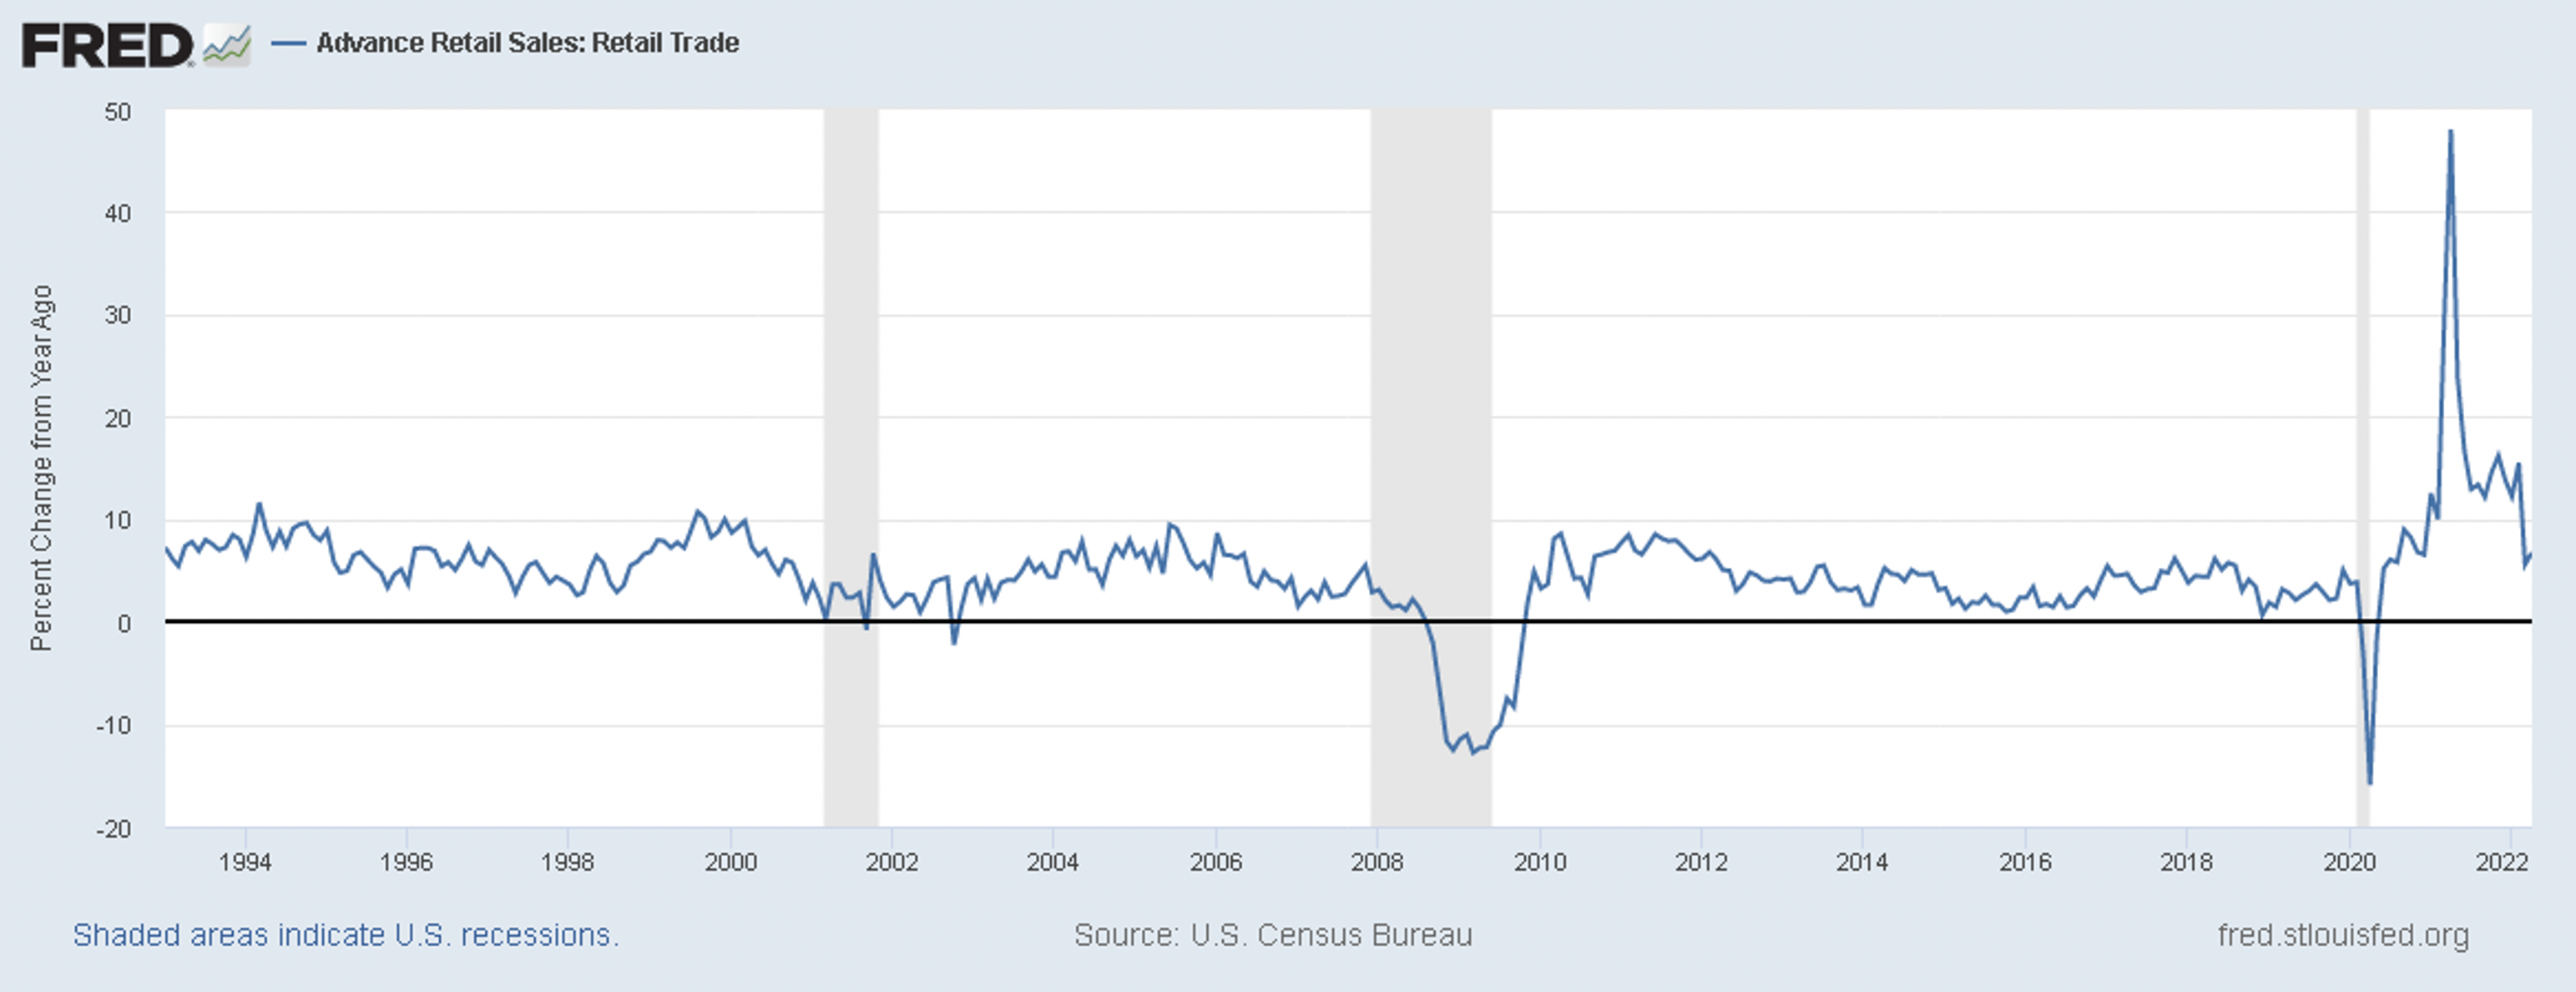
Has consumer demand stagnated? Not yet. April retail sales were up +6.7% year-over-year. Slowing from the large gains that were seen after lockdowns ended in 2021.[xii]
Retailers are starting to see a big shift in consumer spending away from non-discretionary (things you want) to discretionary (things you need). Walmart’s Chief Executive Officer Doug McMillon said the disappointing earnings were “unexpected” and reflect an “unusual” environment. Inflation squeezed consumer discretionary spending and staffing costs increased.[xiii] Walmart stock fell over -11%, its worst one-day performance since the crash of 1987.[xiv] Target fell -25%, also its worst performance since the 1987 crash, as it saw unusually high costs and consumers shift spending away from discretionary purchases.[xv]
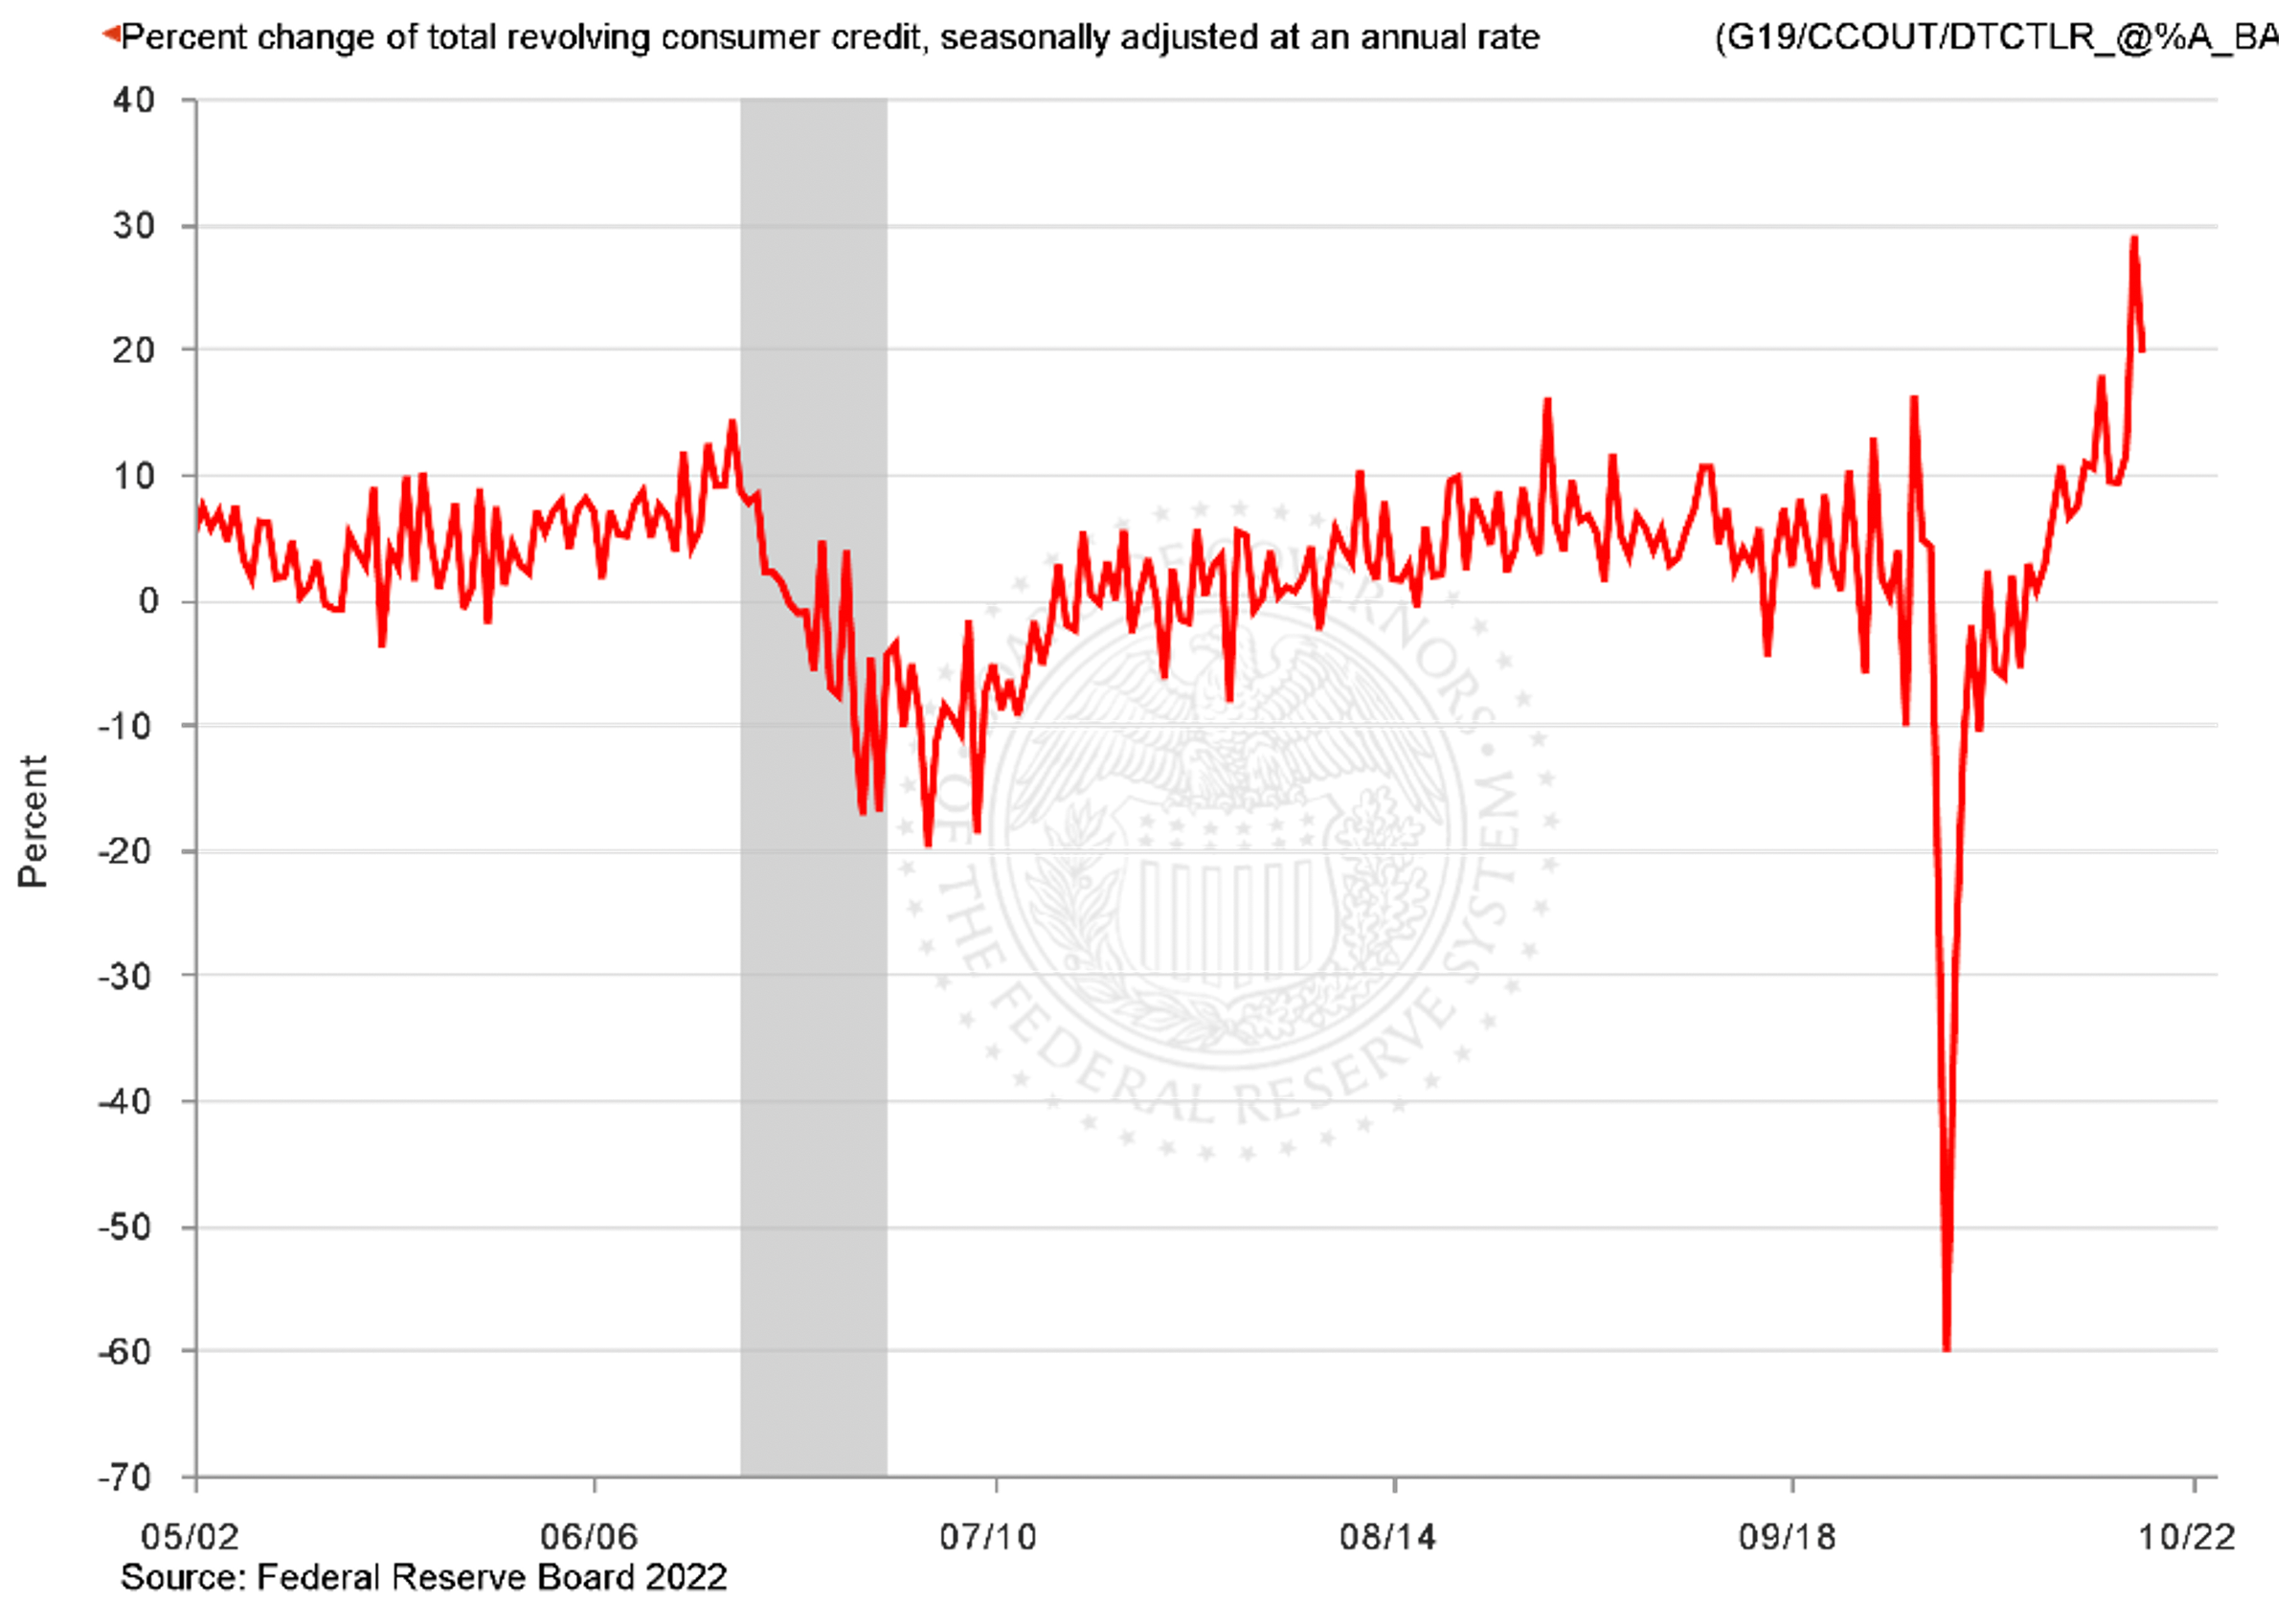
We believe that spending has been propped up by consumers buying what they need on credit. March saw a +29% increase year-over-year in revolving consumer credit, followed by a +19.6% year-over-year advance in April.[xvi] Revolving consumer credit consists mainly of credit card debt. We do not believe the trajectory of the chart below is sustainable.
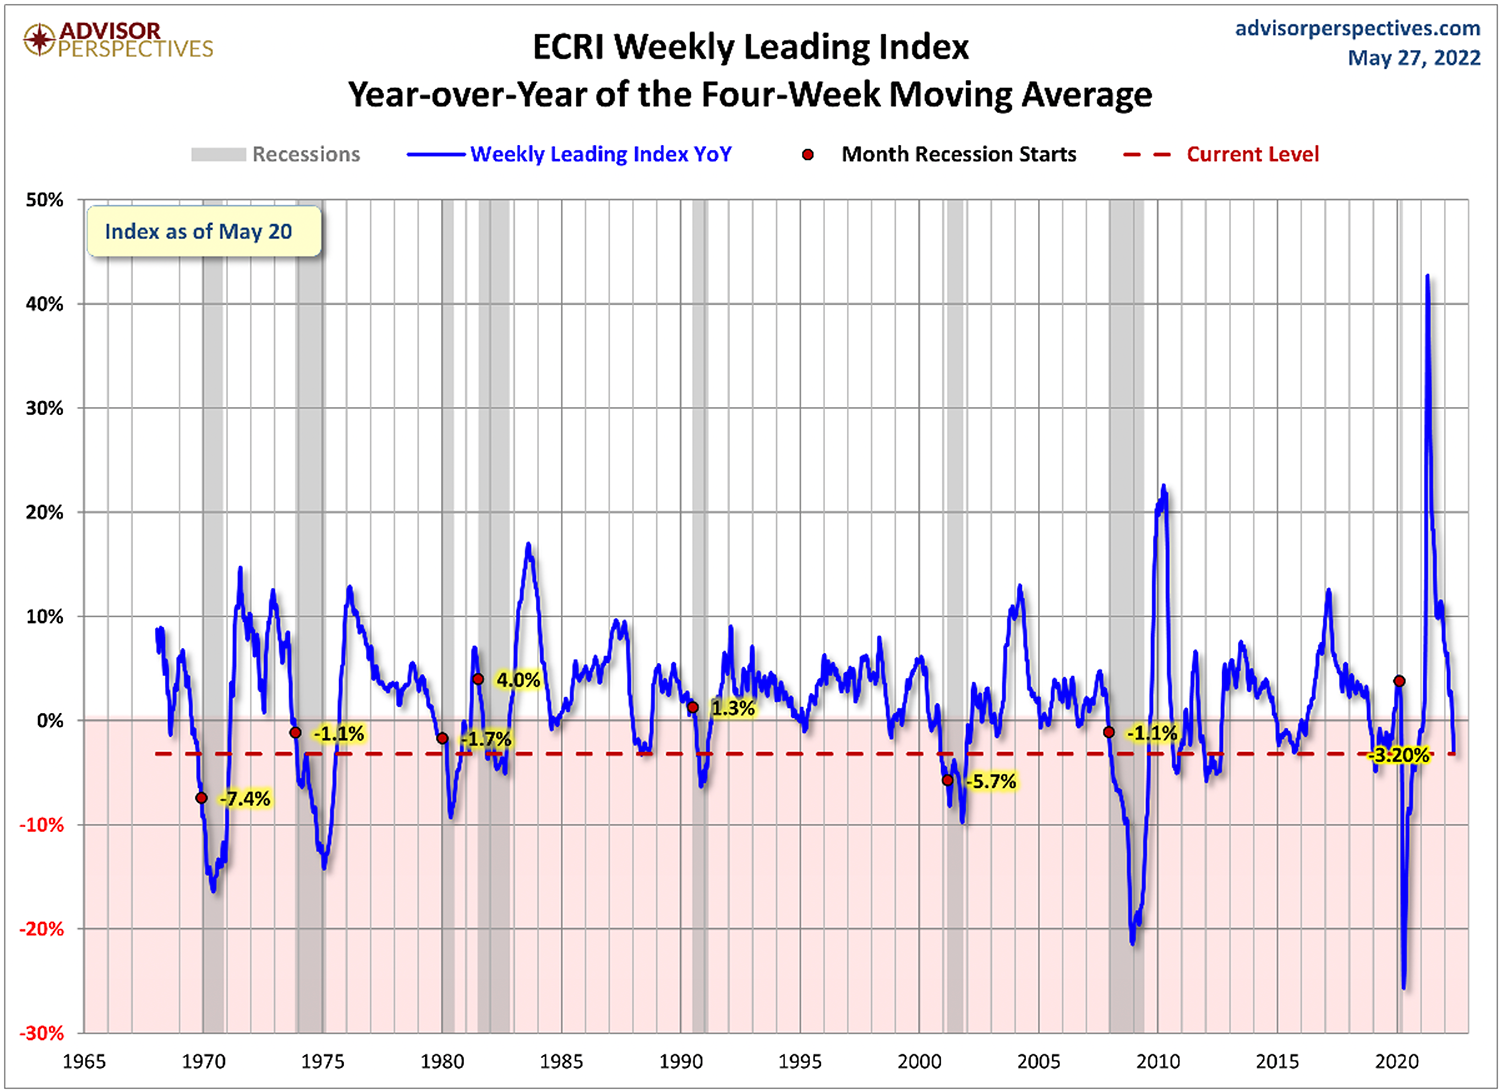
Personal consumption expenditures and retail sales are both lagging indicators. If we look at a leading indicator, the Economic Cycle Research Institute (ECRI) Weekly Leading Index, we see signs that the economy is rapidly slowing. The year-over-year change of the four-week moving average of the ECRI Weekly Leading Index was -3.2% as of May 20, 2022.[xvii]
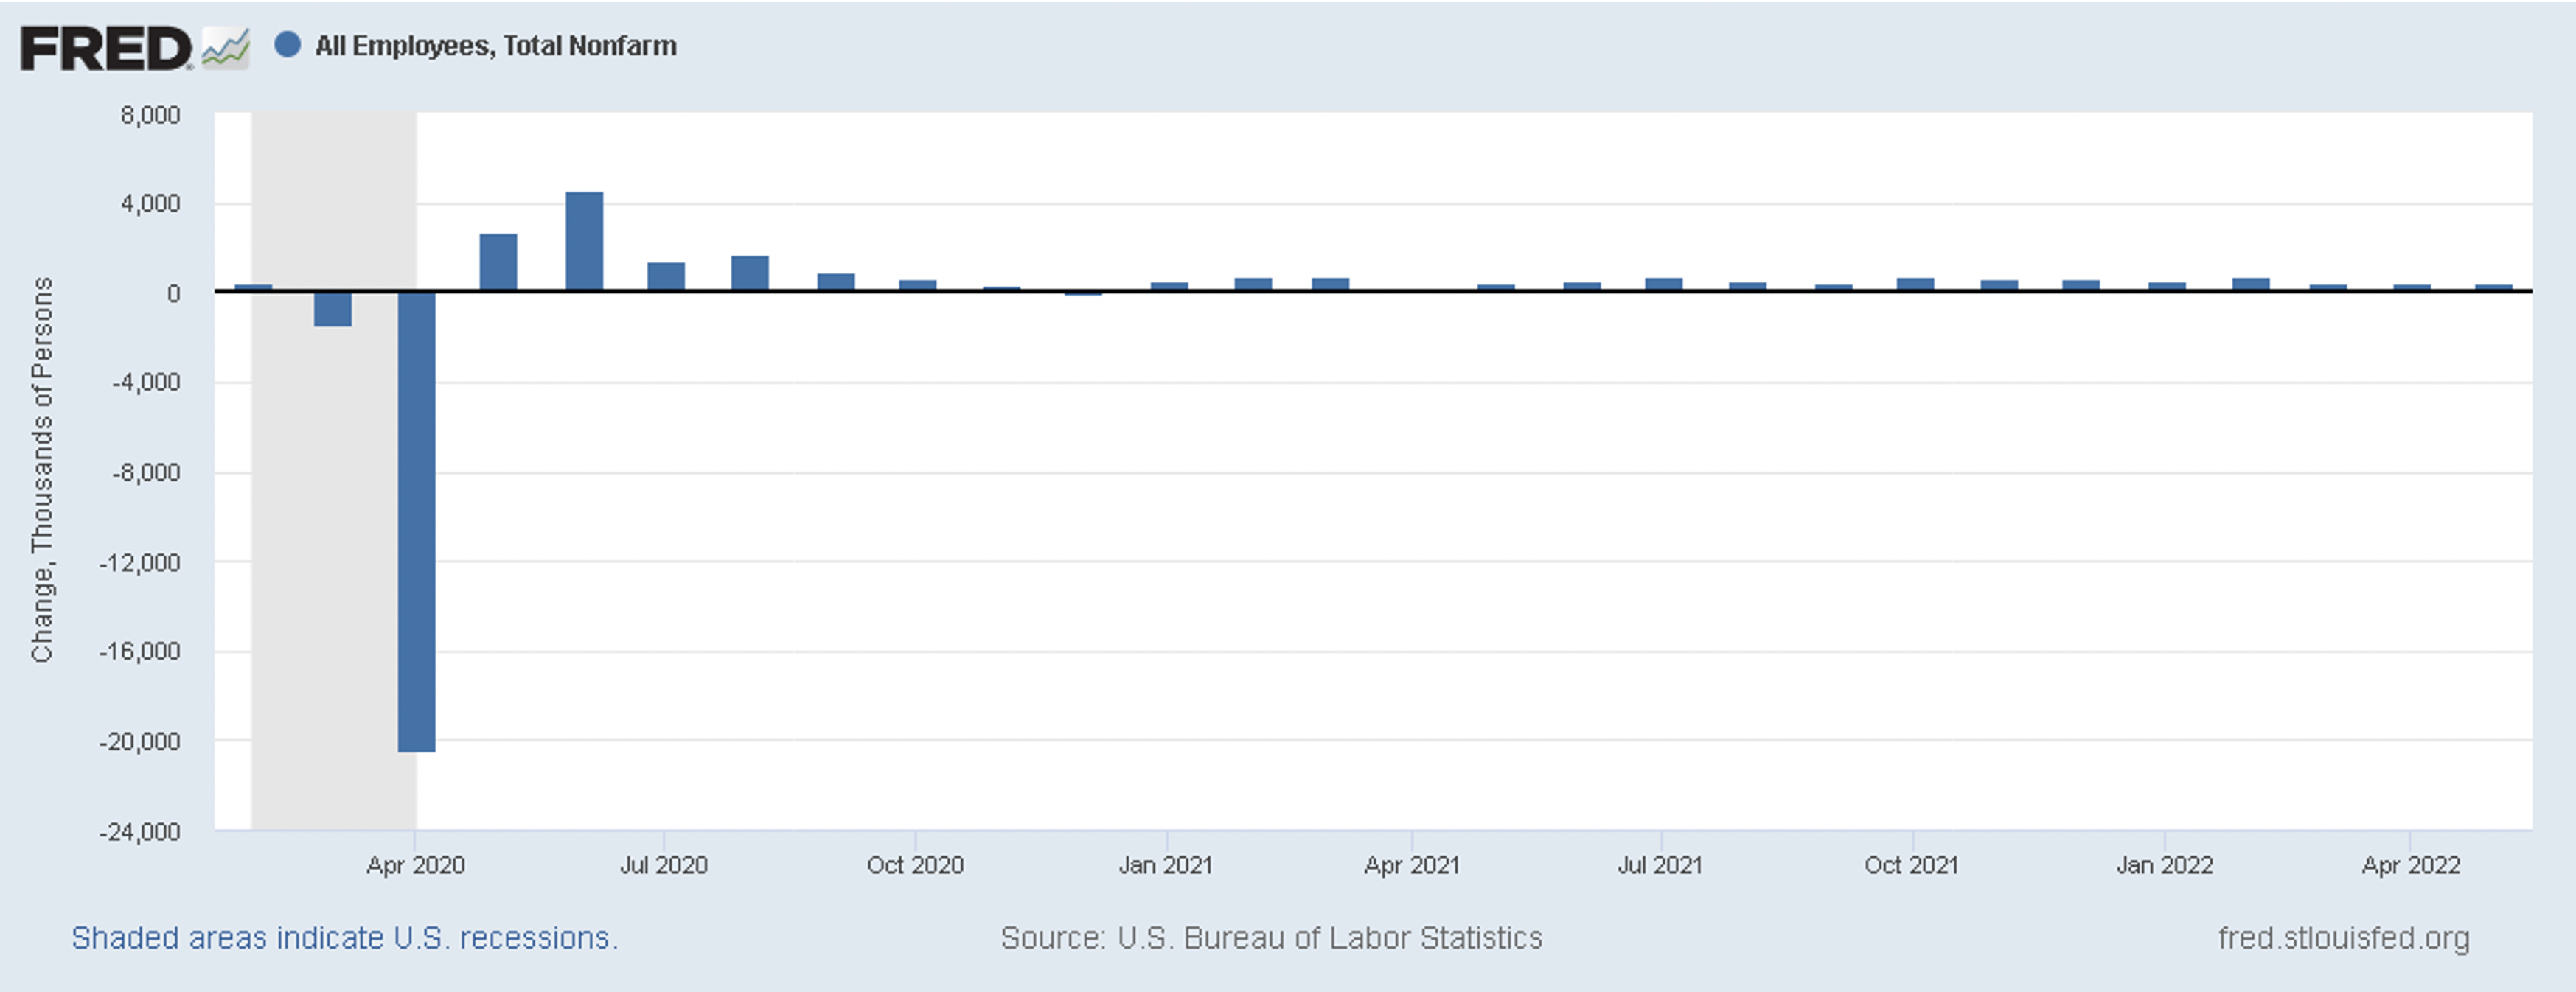
Relatively high unemployment? No. May Nonfarm Payrolls showed +390,000 jobs added to the economy.[xviii] We are still seeing healthy gains in employment, but at a more muted level than mid-2020.
Already this year, we have seen a small wave of companies, including Wells Fargo, Robinhood, Netflix, Carvana, and Peloton, announce employee cuts.[xix] On June 2, 2022, Elon Musk emailed Tesla executives and told them the company needs to reduce its workforce by 10%, citing a “super bad feeling” about the economy.[xx] As the economy slows, we may see increased layoffs.
We may continue to see persistent inflation, slowing consumer spending and slower job growth and layoffs. The Federal Reserve may have to raise rates faster and higher than expected to combat inflation and in doing so could likely impact consumer demand and increase unemployment. Economist Mohamed El-Erian, in an interview with Fortune magazine, said stagflation is “unavoidable” and investors should prepare for a “significant slowdown in growth.”[xxi] On June 1, 2022, Jamie Dimon, CEO of JPMorgan – the largest bank in the U.S. – spoke to analysts and investors and said current conditions are “fine”, but then warned, “You’d better brace yourself. JPMorgan is bracing ourselves and we’re going to be very conservative with our balance sheet.” Dimon continued, “You know, I said there’s storm clouds but I’m going to change it … it’s a hurricane.” Dimon went on to say he doesn’t know if it’s going to be “a minor one or Superstorm Sandy.”[xxii]
It is possible inflation will subside, the consumer will remain strong and unemployment will remain near record low levels. However, if these three things don’t happen, how does one to prepare for the storm?
Many investment strategists believe owning Treasury Inflation-Protected Securities (TIPS) and real assets, such as real estate and commodities, can help reduce inflation risk. We have also observed that during past environments where growth is slowing, that consumer staples (the things you need) tend to outperform the rest of the market. We have already positioned a healthy weighting of TIPS, gold, and gold miners in our Dynamic and Strategic strategies.
We may or may not be interpreting these deteriorating graphs smartly while the business leaders discussed above are shouting danger “at the top of their lungs.” Regardless, the rational act for today is to continue these investments in CIG’s client portfolios to potentially protect against inflation or stagflation. But we also recognize that the markets are remarkably unstable right now. It’s hard to predict when Chairman Powell or some other market missionary will unleash a torrent of “inflation has peaked and that the Fed is overshooting.” What ultimately may offer a safe harbor for CIG’s clients is our focus and ability to quickly adjust to changing circumstances and to pursue new investment opportunities as they emerge.
We would welcome the opportunity to connect with you to address your questions and concerns and discuss the economy, as well as the value of careful active management in uncertain times.


CIG Asset Management Review: What If the Bubble Bursts?
Summary:
* US Equities surge while international equities lag
* Tesla and the growing stock market bubble
* What happens when a bubble eventually bursts?
Commentary:
The S&P 500 index gained +7.01% in October, bouncing back from its September decline and closing at an all-time high.[i] Overseas markets were up, but much less so versus the U.S., with the MSCI EAFE net index up +2.38% and the MSCI Emerging markets up +0.93%.[ii] Fixed income did not offer much in the way of returns for the month with the Bloomberg US Agg Bond Index falling -0.03%.[iii] Crude oil added to September’s gains, increasing +11.38% and closing at $83.57/barrel, a 7-year high[iv], despite global growth forecasts being revised lower.[v]
We continue to be concerned that U.S. equity markets may be in a bubble. Tesla, for example, gained +44% in October.[vi] In just 2 weeks, the company gained $310 billion in market capitalization. That gain is more than the market cap of 482 companies in the S&P 500 Index.[vii] Tesla’s current market cap is over $1.2 trillion, greater than the market capitalization of Toyota, VW, Daimler, GM, Ford, BMW, Honda and Hyundai combined![viii] Tesla isn’t the only stock that may currently be overvalued.
When we look at the market using several different measuring sticks, we find more extreme valuations. The Buffet Ratio, which we have talked about before and measures total market capitalization to U.S. GDP, is at 215.5%, double the 107.5% seen in May 2007, right before the Great Financial Crisis and 50% higher than the March 2000 dot com boom high of 142.9%.[ix] The current Shiller PE ratio for the S&P 500 is 40.09. The only other time that we saw the market trade at such a high price to earnings ratio was during the dot com bubble, when the S&P 500 traded above 40x from January 1999 through September 2000.[x] No one can predict with any degree of certainty just how much larger the current bubble can get or how long it may last, but we must take note of what has happened when previous bubbles finally burst.
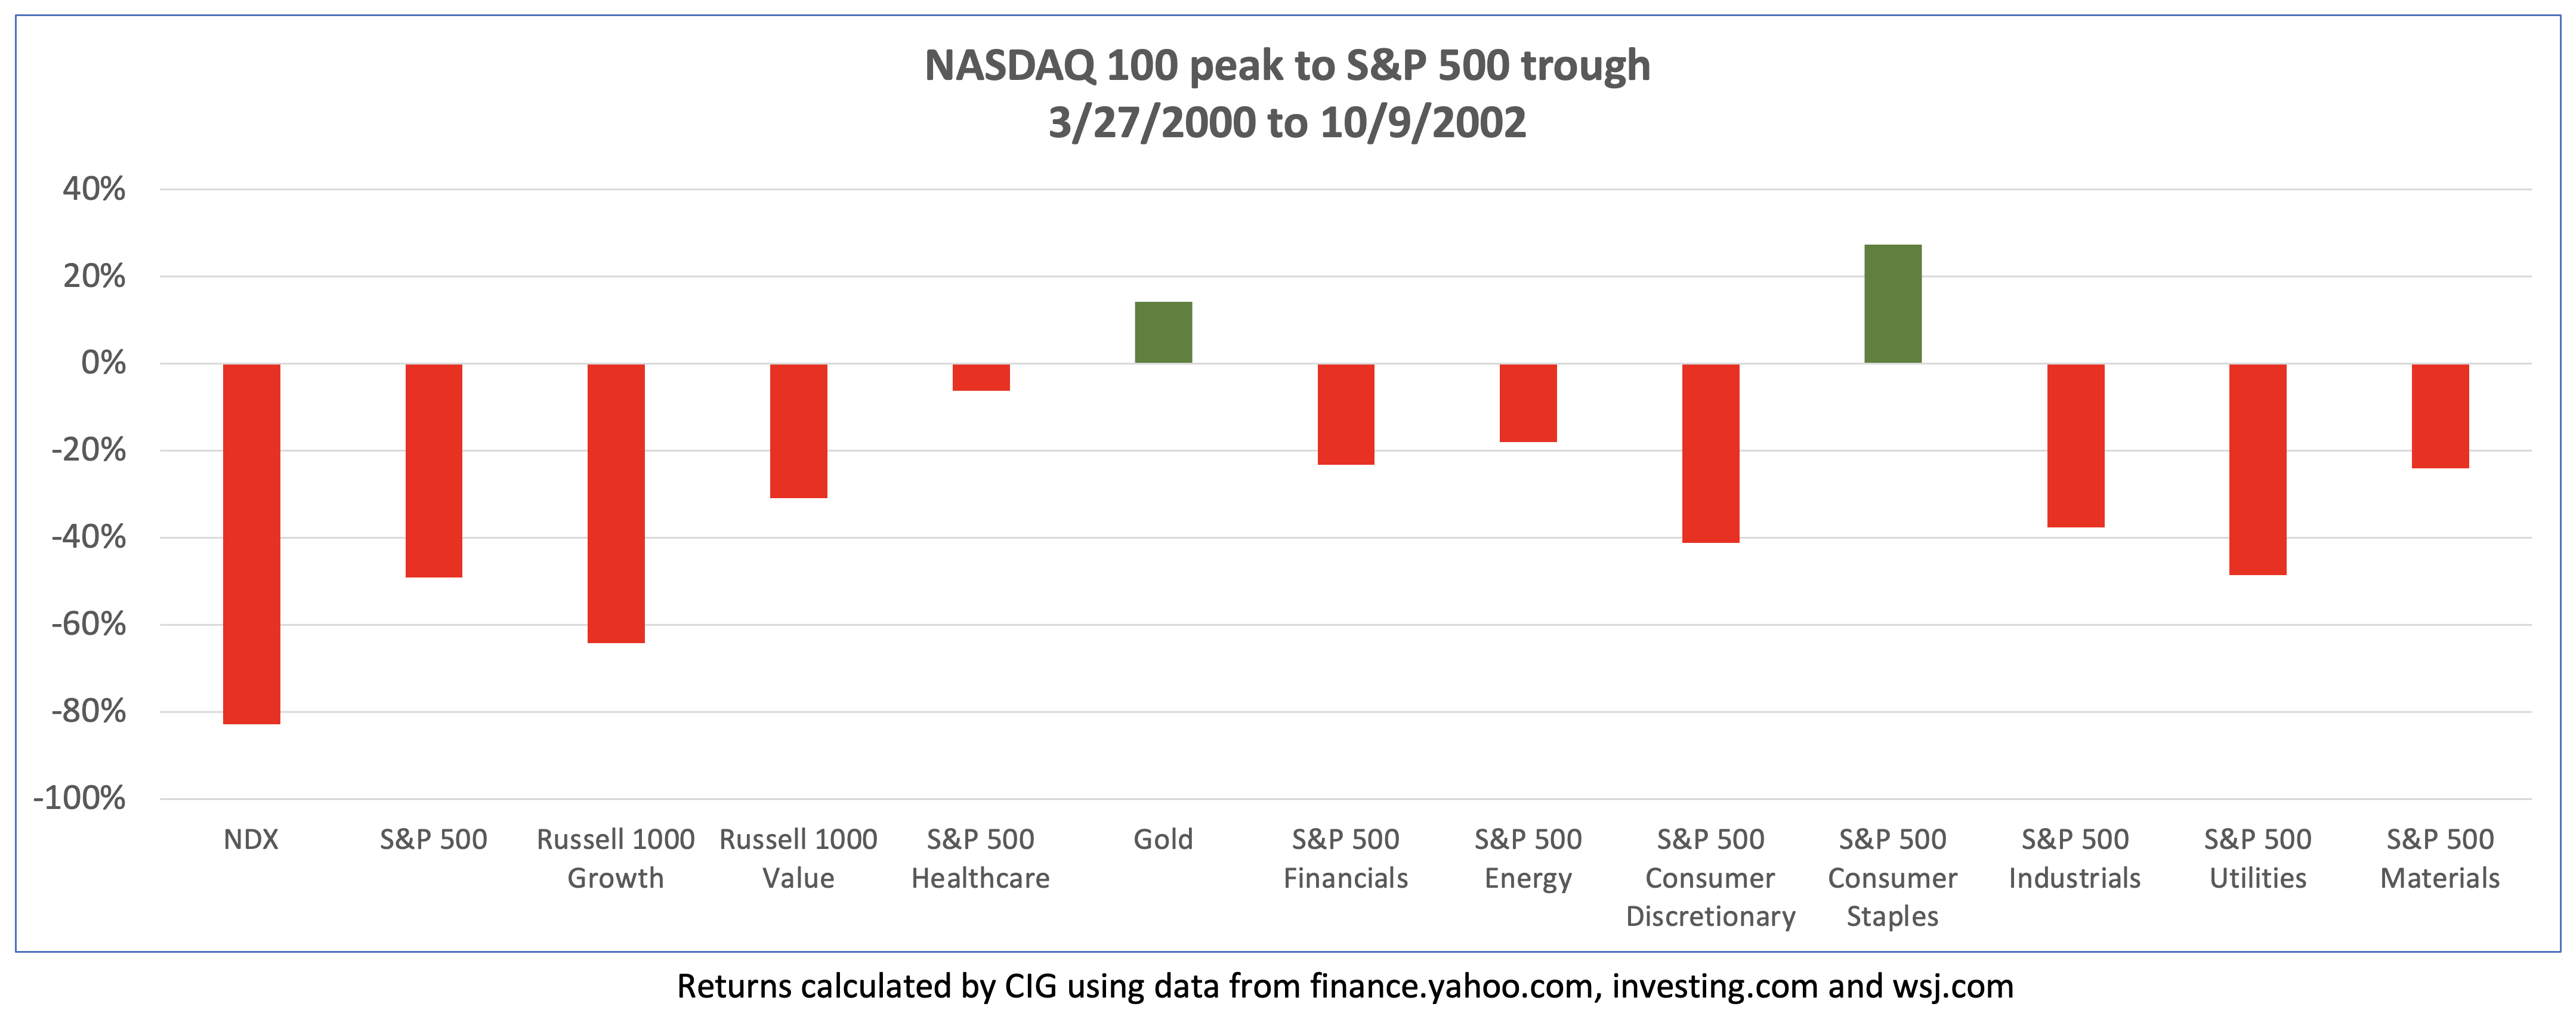
How bad can things get when a stock market bubble bursts? During what was, prior to now, the largest stock market bubble, the dot com boom, the NASDAQ 100 hit its then all-time closing high on March 27, 2000. The broader market, as measured by the S&P 500, did not reach the bottom until October 9, 2002 with a peak to trough loss of -49%.[xi] As illustrated in the chart below, a lot of money was lost in different sectors and factors during this period while gold and consumer staples, which clients currently have exposure to, gained.
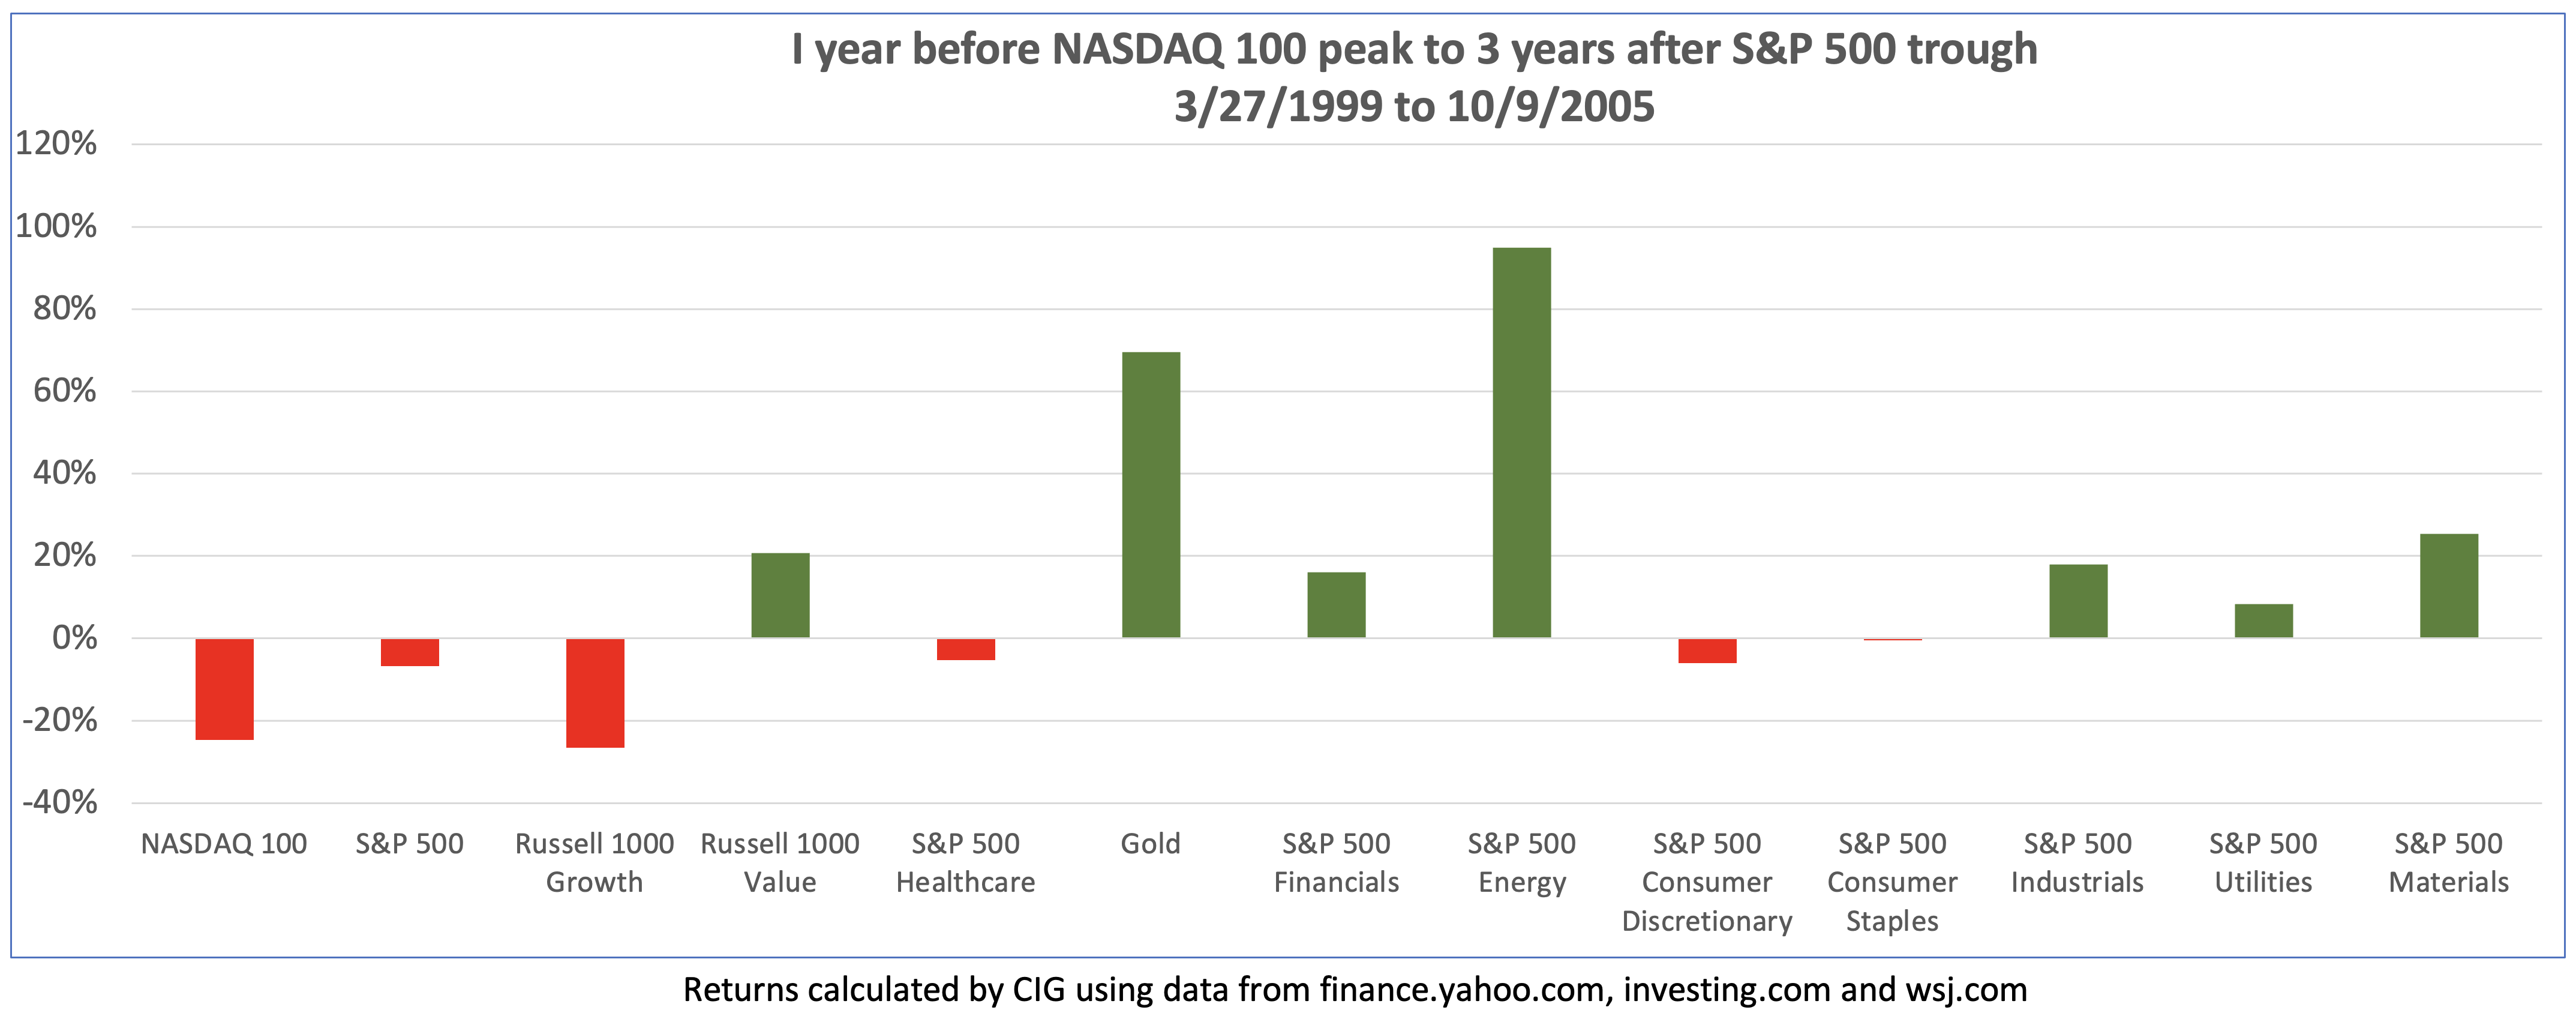
An investor would have to be extremely unlucky to buy at the top and sell at the bottom. What do returns look like if you bought one year before the top, on March 27, 1999 and held on for three years after the bottom, October 9, 2005? The S&P 500 was down -6.8%, and the NASDAQ 100 lost -24.7%. Notably, gold, energy, financials, industrials, utilities, materials, and value stocks were up.
As seen in the chart below, it took just over 7 years for the S&P 500 to get back to its March 27, 2000 high (from point (1) to point (2)). Just months after the market had recovered, the Great Financial Crisis began, and the market did not bottom out again until March of 2009. The S&P 500 did not fully recover until March 4, 2013 (point (3)). If you bought the S&P 500 on March 27, 2000, you had a very brief amount of time in 2007 to get out even, or you had to wait until March 2013 to recoup your losses, just under 13 years after the dot com peak![xii] “Do you have enough time?” was the title of a recent Asset Management Insight.
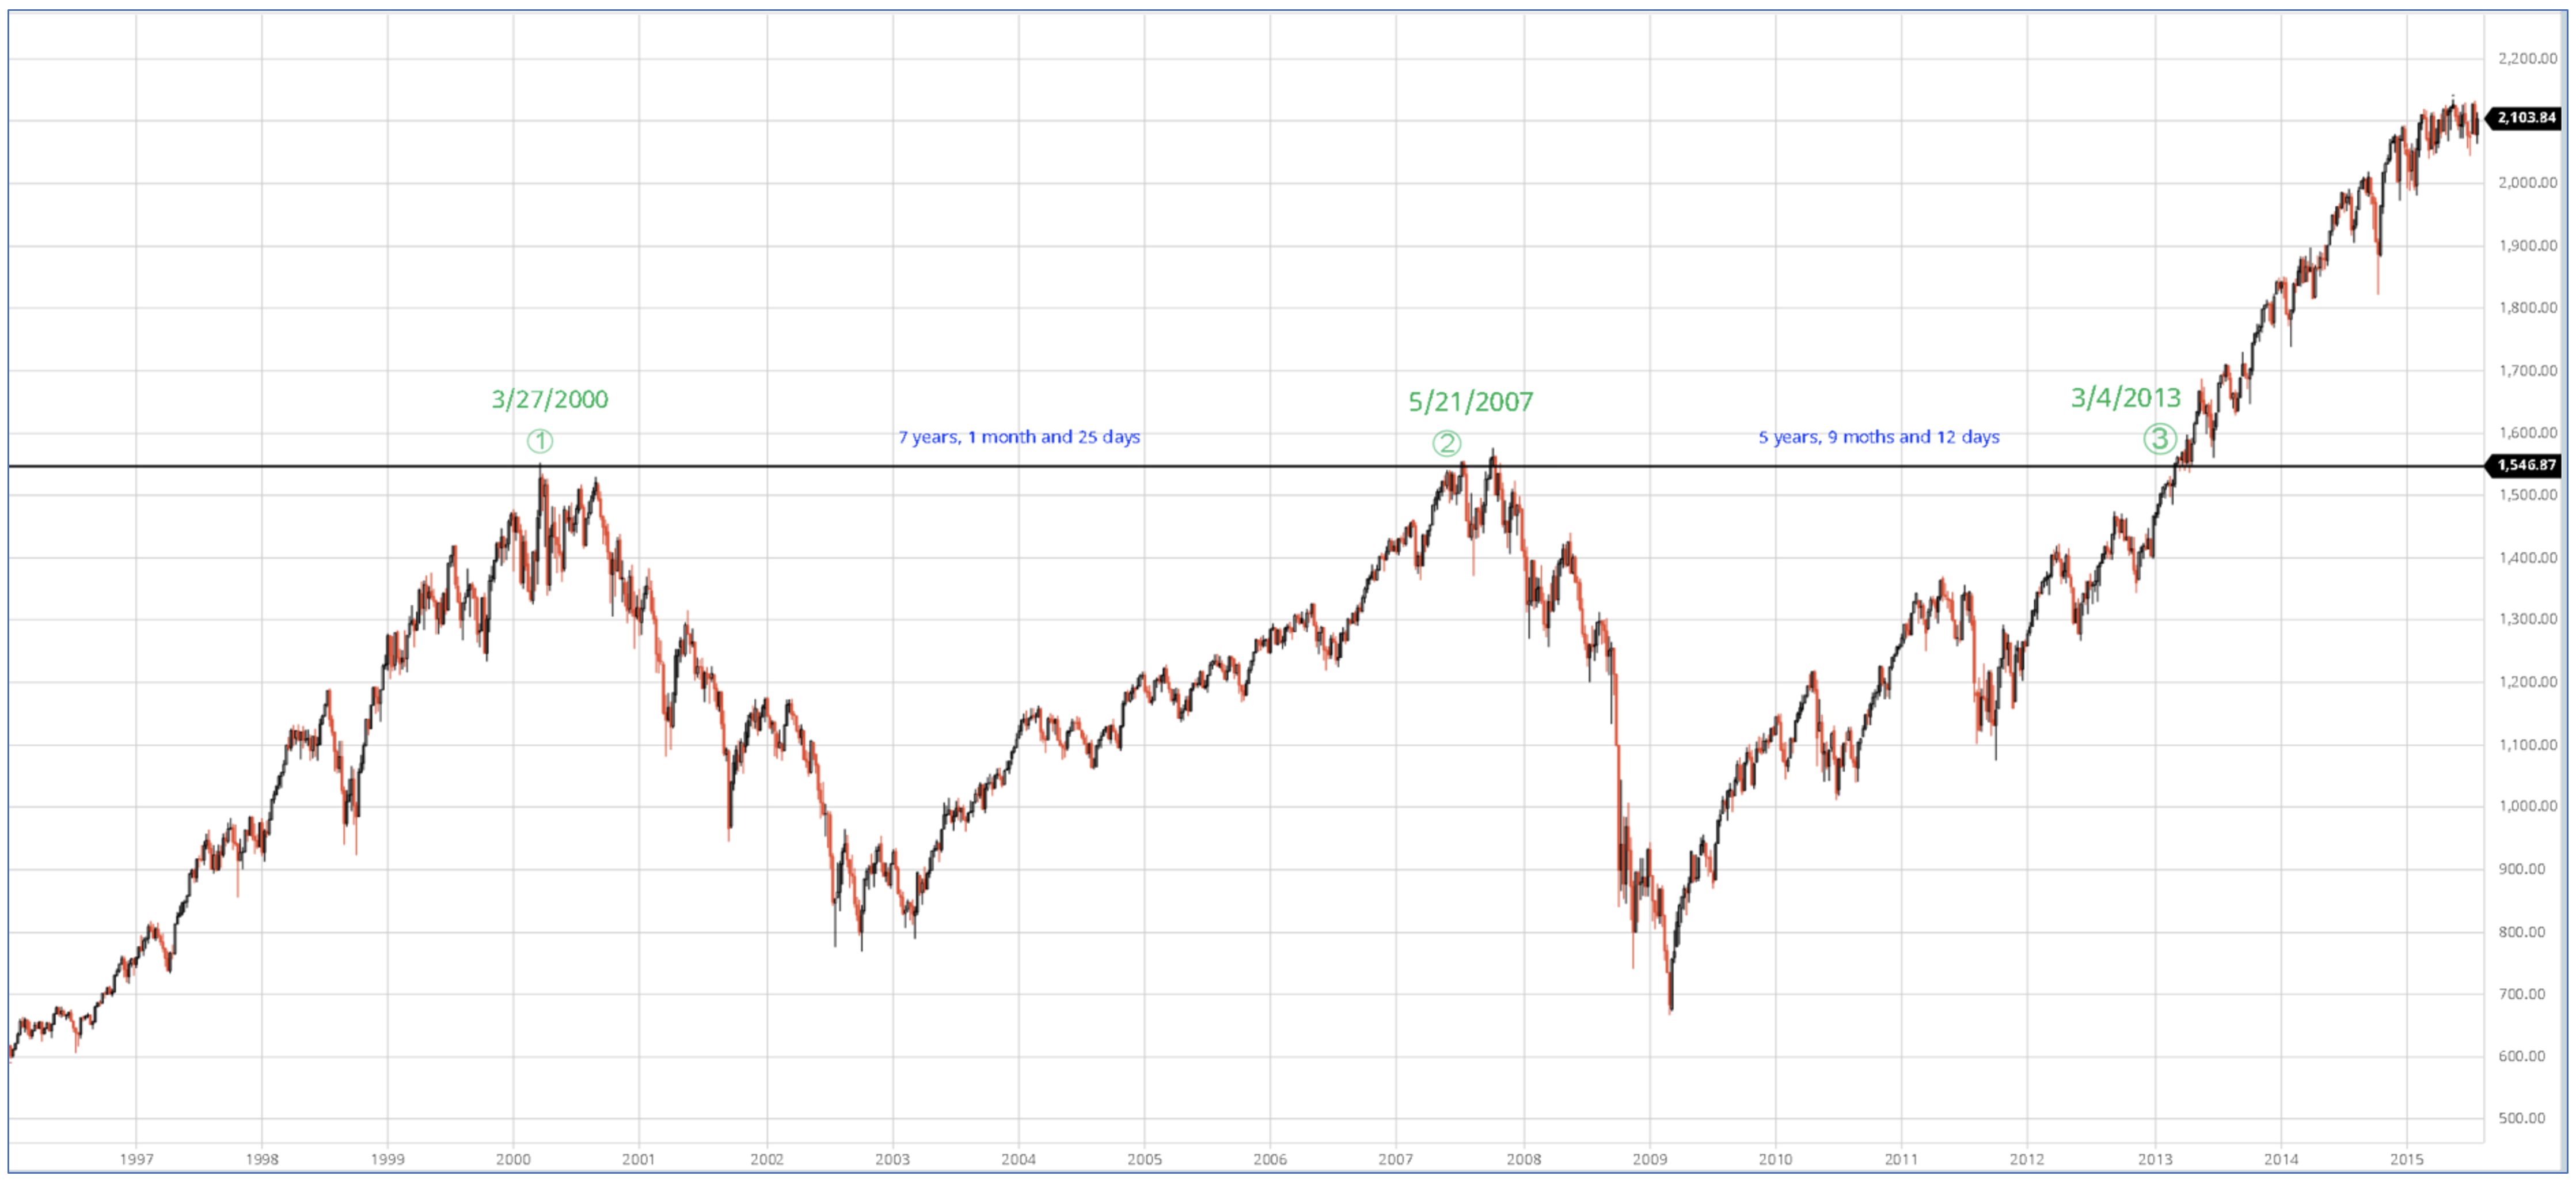
Source: barchart.com
During the dot com bubble in 1999 to 2000, many investors believed that traditional valuation metrics such as price to earnings and price to sales no longer mattered. “This time is different” was a phrase often used. During the pre-Great Financial Crisis housing bubble many believed again, “this time is different”, no money down mortgages and other financial innovations would forever change the way assets were valued, and residential real estate has never gone down on a country-wide basis. Ultimately, traditional valuation methods won out and both bubbles burst.
History has taught us to be very careful. We continue to stay the course of risk balanced investing – take enough risk to reach your goals but not much more. We remain focused on striking the right aggressiveness versus defensiveness in client portfolios given the evolving uncertainty in the markets and the economy.