Summary:
* Diverse stock market returns in July
* Watch FRONTLINE’s “The Power of the Fed”
* Is the market in a bubble?
Commentary:
Returns within stock markets varied during the month of July. The S&P 500 index rose +2.4%.[i] The Russell 1000 Growth Index was up +3.3%[ii] while the Russell 1000 Value Index only gained +0.8%.[iii] Small-capitalization stocks as measured by the Russell 2000 Index lost -7.0%.[iv] Overseas, developed stock markets as measured by MSCI EAFE net, gained a modest +0.7%.[v] Chinese stocks, as represented by the SSE Composite Index, fell -5.4%[vi] as China tightened regulatory policies over technology companies. MSCI Emerging Markets, which has a third of its weighting in China and exposure to under-vaccinated emerging countries, lost -7.0%.[vii]
As a follow-up to last month’s Asset Management Review, we encourage you to watch the recent FRONTLINE investigative episode called “The Power of the Fed.”[viii] While we do not agree with everything that the journalist and the interviewees say, this award-winning, long-form investigative journalism show does highlight how the Federal Reserve’s excessive money printing may lead to asset bubbles and exacerbate wealth inequality, which we believe could be damaging to the long-term health of the economy and the capital markets.
Given our belief that the market has become increasingly more fragile, which we talked about last month, we believe that investors may see single digit returns on a year-to-date basis in the short term before they see a return to the current mid-teens year-to-date return in the S&P 500 Index. The VIX, the measure of equity market volatility, in our opinion seems to be a coiled spring that continues to be tightened further and further. Right now, it seems like nothing bothers this market for long, e.g., Dr. Fauci worried about more deadly variants than Delta; computer chip shortages; or housing/ auto/ gas inflation. We expect more volatility later in the year.
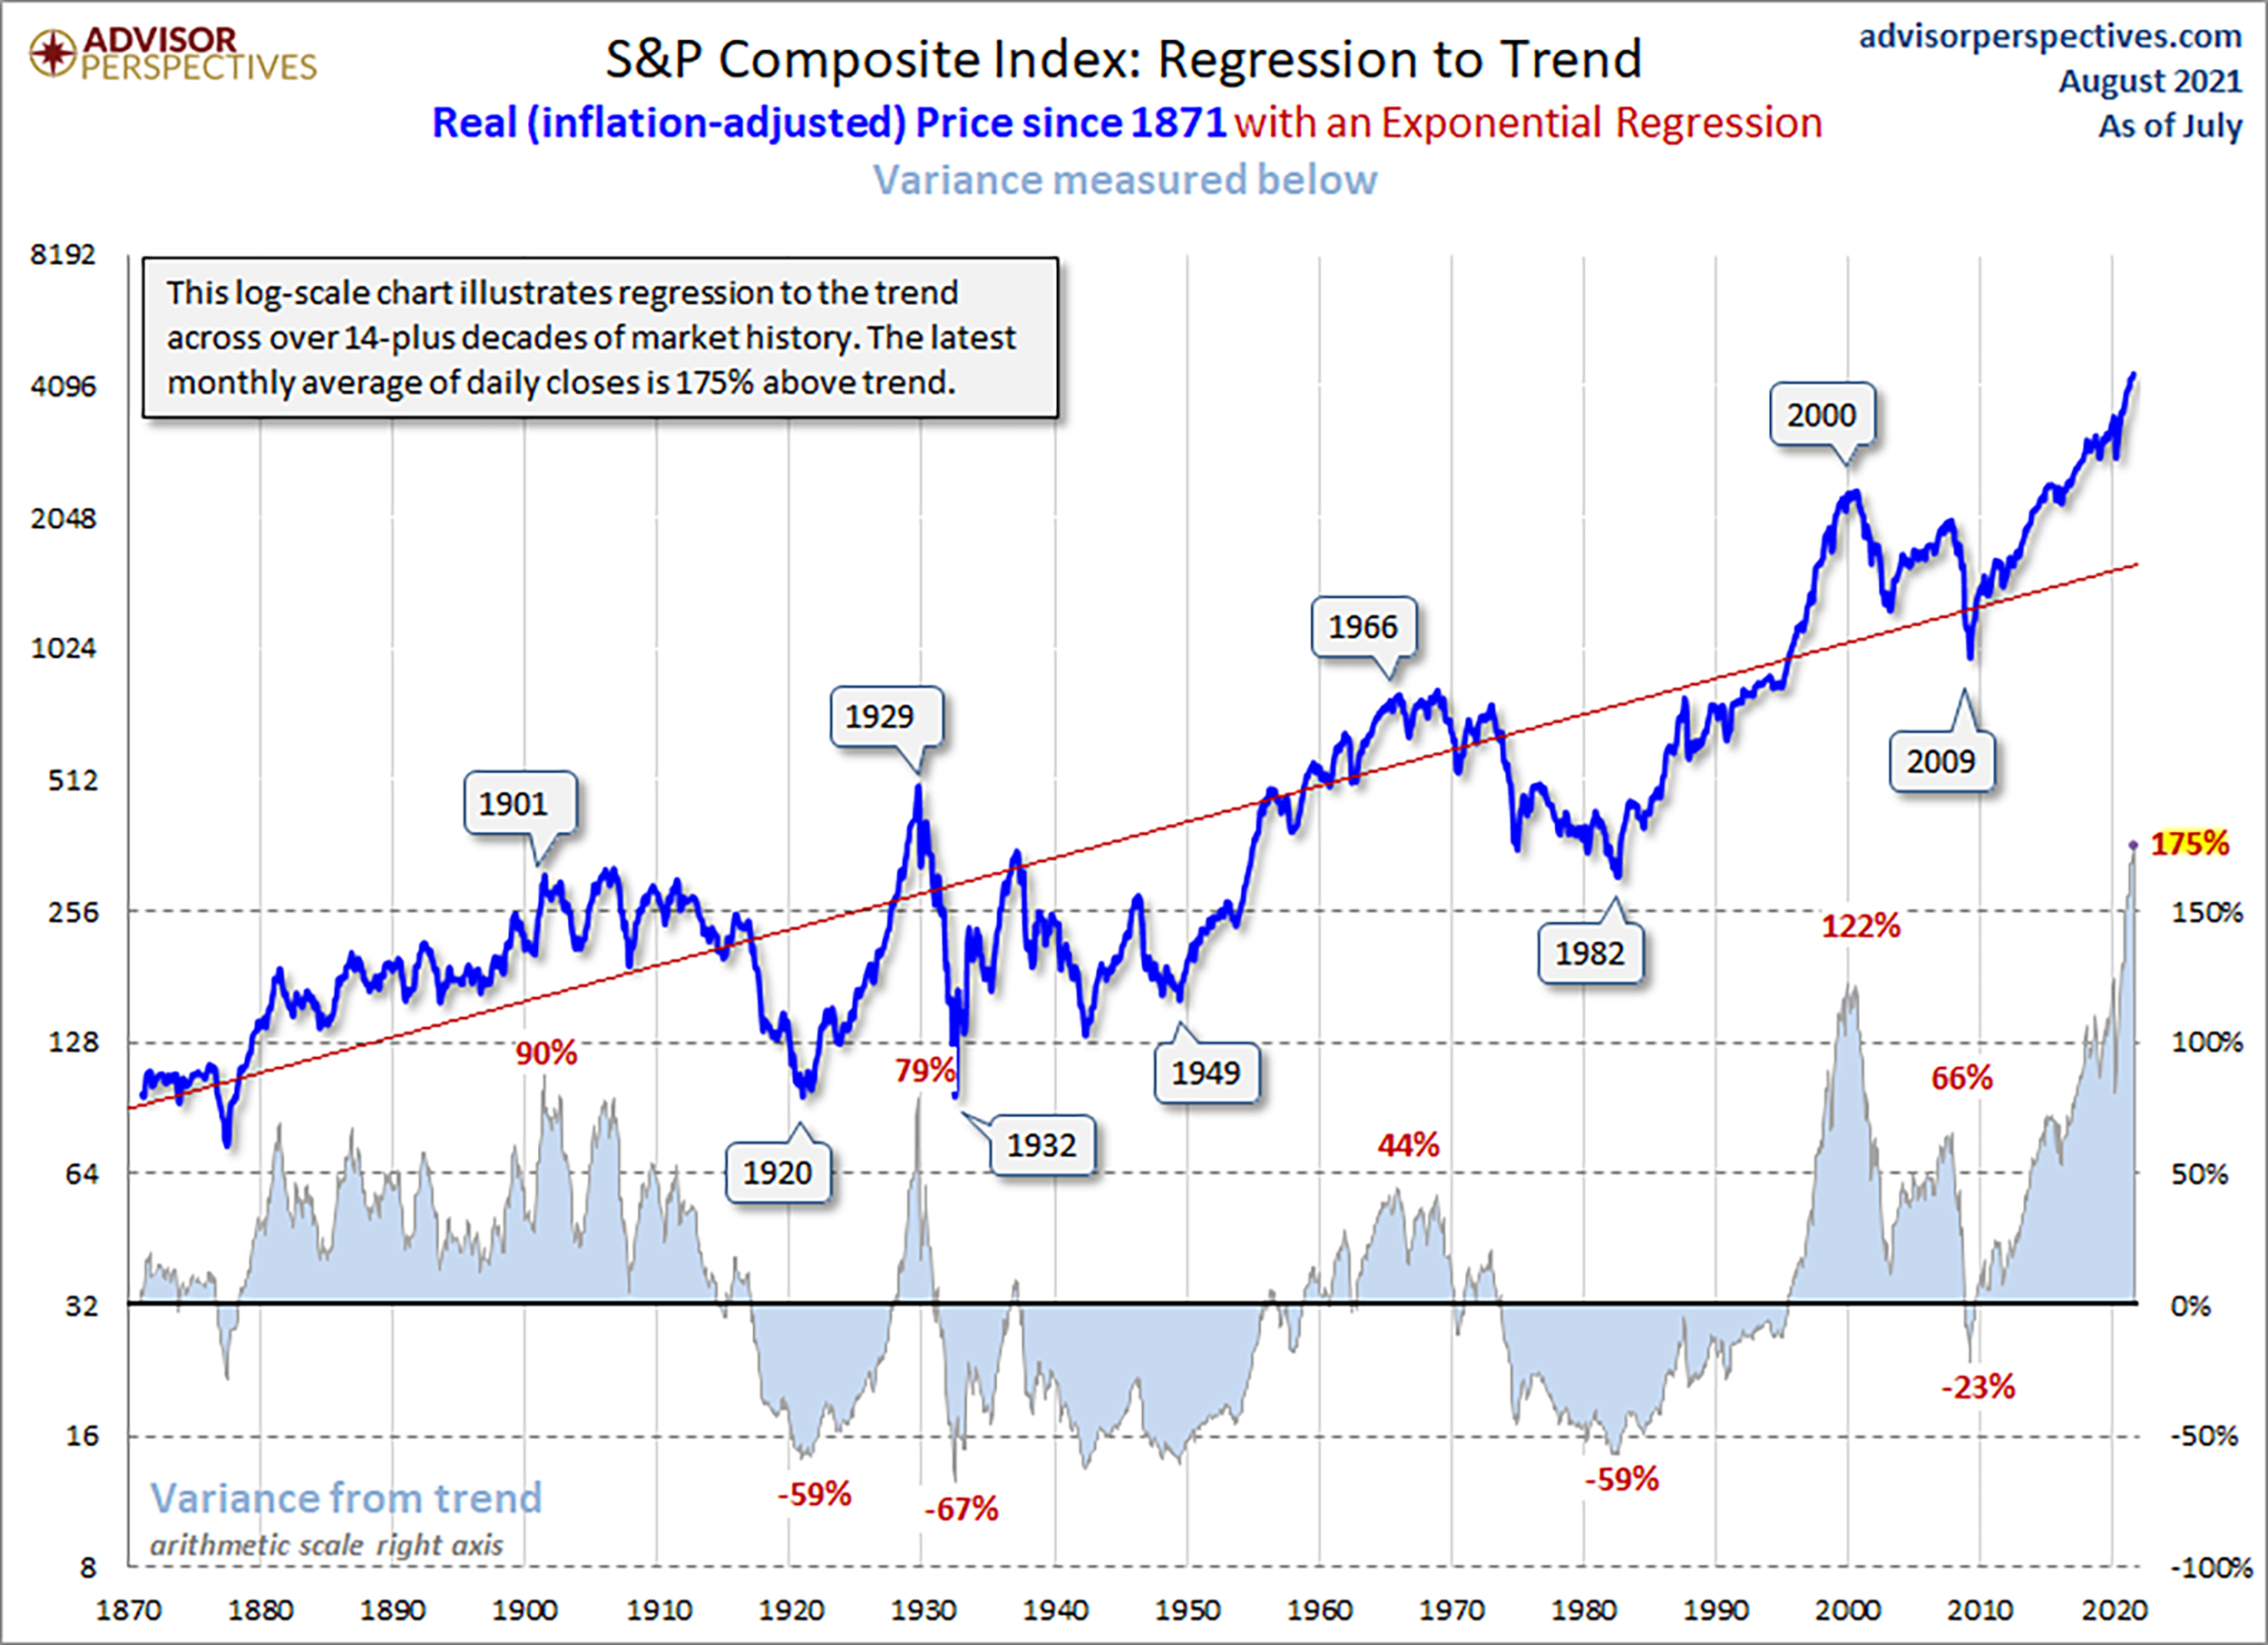
The chart below does concern us. As you can see, there is significant cyclicality to the S&P Composite when it is adjusted for inflation. “Over earning” in the stock market for many years often leads to underperformance and losses over long periods. We have written in the past about how anecdotally and qualitatively 2021 reminds us of 2000. Quantitatively, the market’s 175% above trendline performance dramatically tops the 122% in 2000 and the 79% in 1929.[ix] Historically, markets have reverted to the red long-term trend line. Will this time be different than the large market drawdowns subsequent to the 1901, 1929, 1966 or 2000 peaks?

Source: Advisor Perspectives
It is quite possible that we are in an asset bubble right now. It is hard to know for sure when you are in it. The only sure-fire way to know if there is a market bubble is after it pops. We agree with John Hussman, who recently wrote in The Folly of Ruling Out a Collapse, “The problem with a speculative bubble is that you can’t make the short-term outcomes better without making the long-term outcomes worse, and you can’t make the long-term outcomes better without making the short-term outcomes worse. Now it’s just an unfortunate situation.”[x]
Our approach to this possible market bubble? Stay the course of risk balanced investing – take enough risk to reach your goals but not much more. We continue to focus on striking the right aggressiveness versus defensiveness in client portfolios given the positives and negatives in the markets and the economy.


