Summary:
- From 2009 to 2018, the structural bull market conditioned many investors to believe that despite short-term pullbacks, the market will always head higher over the intermediate and long term thereby rewarding dip buying and passive investing.
- From 2009 to 2018, the structural bull market conditioned many investors to believe that despite short-term pullbacks, the market will always head higher over the intermediate and long term thereby rewarding dip buying and passive investing.
- Now, the markets are historically expensive, fragile, and disconnected from the real economy. A 60/40 Static Allocation portfolio4 has a 12-year projected return of -2.2%, the lowest in U.S. history[i]. CIG’s aim is to exceed client’s goals, which are higher, in a thoughtful way.
We held off providing our 2021 Outlook until now because of several known unknowns (e.g., the election) and some unknown unknowns (e.g., GameStop)[1]. With some resolution of these unknowns, we offer a historical perspective, an outlook, and a viewpoint on success.
A Historical Return Perspective:
We first need to look at the last four major corrections in the US stock market, as measured by the S&P 500 Index. The last two major corrections, the Fed Taper Tantrum and most recently the Covid-19 sell-off, have seen markets bounce back very quickly as governments added trillions of dollars in liquidity by adding trillions of dollars of debt and running an enormous trillion dollar budget deficit. Yes, over time stock markets go higher, but we will inevitably see corrections in future years. Will the next major market sell-off look similar to the most recent two, where markets rebound quickly, or will the experience be more like the Dot com and Great Financial Crisis sell-offs where it took years to recover losses? An investor who retired in March of 2000 or October 2007 likely suffered their share of sleepless nights as the stock market ground lower and took years to recover.[2]

Prior to October 2018, the market was supported by the Fed’s quantitative easing (i.e., money printing) and zero interest rate polices, companies buying back their shares, and some economic growth.
From 2009 to 2018, a 60/40 Static Allocation (60% S&P 500 Total Return Index / 40% Bloomberg Barclay Aggregate Bond Index) returned approximately 10.0%[3] on an annualized basis while an index approximating active management[4] returned about 4.4%[5]on an annualized basis. Please see the chart below showing the daily performance of a hypothetical $10,000 investment in the 60/40 Static Allocation, the Active Management Index, and the S&P 500 Index.

Source: Morningstar
That structural bull market ended in October 2018 when the Fed tried to raise interest rates and corporate share buybacks no longer worked. This event is known as the “Taper Tantrum”. Since
October 2018, it has been a much bumpier ride. Still, the 60/40 Static Allocation has returned 12.7%4 on an annualized basis while the gap has closed between it and the “Active Management” index’s5 annualized return of 9.0%6. Please see the chart below tracking this performance over this period.

Source: Morningstar
While we have come through this period, one estimate of average annual nominal total returns by John Hussman, a prominent market strategist, for a 60/40 static allocation has a 12-year projected return of -2.2%, the lowest in U.S. history, including the extreme low associated with the 1929
market peak1. Even if the markets remain at peak valuations and pre-pandemic margins are sustained into the future, the upside range of that forecast is about 3%1.

Source: Hussman Strategic Advisors
The Outlook:
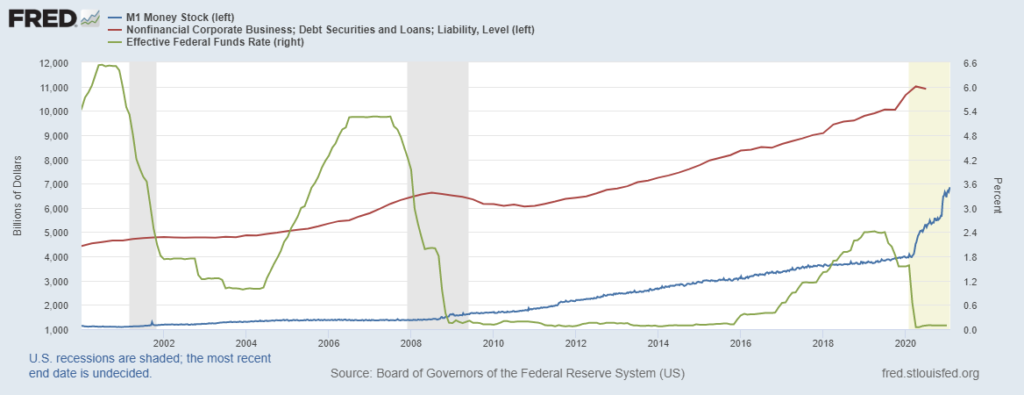
The smooth returns from 2008 to 2018 were aided by governments, businesses, and households taking on more and more debt. Companies started issuing more bonds in the late 1990’s, households took on too much debt in 2003-2008 to buy houses (remember the foreclosure crisis), and finally the US government post the 2008 crisis (all shown in the red line in the chart below) – all to maintain economic growth. When you have a large amount of debt, one cannot afford high interest rates and the Fed kept rates very low (green line below). The Fed also increased the money supply (blue line
below). Investors were conditioned to buy the dip (BTD) and that there were no alternatives (TINA) to stocks. Both instilled a fear of missing out (FOMO).

Source: Federal Reserve of St. Louis[6]
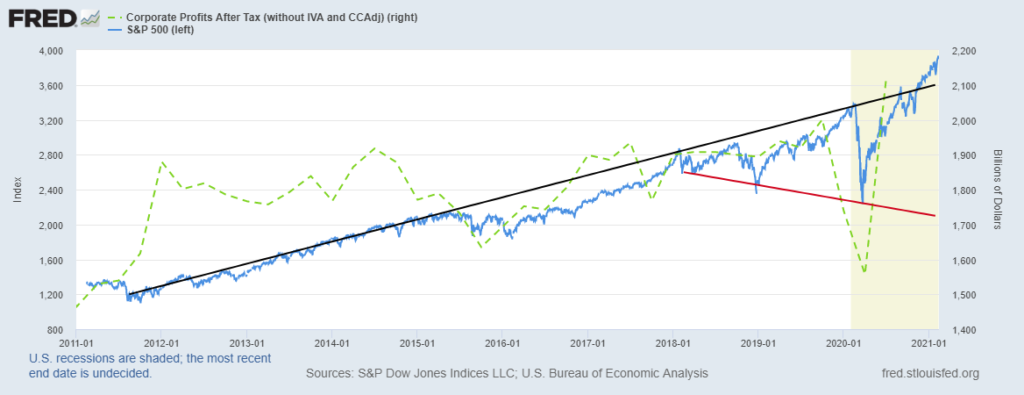
The S&P 500 broke its 2009 uptrend in December 2018. The Fed reacted by cutting interest rates and they started buying securities in the market. This led to not only to a massive rally in 2019, but easy money also produced the one of the greatest investment traps of all time which all came to a dramatic end in March 2020 when COVID hit the world economy and the S&P 500 Index declined by 34%. The structural problems that started long ago still have not been addressed, including the lack of corporate profit growth (the green line on this graph). Now we are left with potentially ever widening extremes in the market as shown below.

Source: Federal Reserve of St. Louis[7]
The stock market is back at all-time highs and is expensive on a valuation basis. In past similar
circumstances, a 60/40 Static Allocation likely did not meet your investment goals. From 12/31/1999 to 12/31/2012, the Static Allocation returned just 3.8%4 on an annualized basis versus 6.5%6 for “Active Management.5” In 1999, the market was similarly expensive and driven by a handful of
technology companies. A recent Gavekal Research report9 showed that if you had bought the 10 large-cap technology darlings back in January 2000 – after reinvesting all the dividends, you would have been left two decades later with one winner Microsoft – and a 1.4% compounded return[8].
Over the shorter period to 2012, an investor would have needed to diversify into other sectors and bonds to produce the low single digits return above.

Source: Morningstar
Central Banks and National governments seemed to have thrown everything that they could at the crash starting at the end of March 2020. It has made people chase distorted asset prices since April 2020, given a fear of missing out. Markets now appear completely disconnected from the economy – just look around. One in 8 Americans, more than 27 million adults, reported they sometimes or often didn’t have enough food to eat in the past week, according to Census Bureau survey data collected in late November and early December[9].
Unemployment skyrocketed in 2Q 2020 and continuing unemployment claims have remained high (see the red area in the chart below while the S&P 500 continues to rise).

Source: CIG using data from Yahoo Finance and the U.S. Department of Labor[10]
In our view, either the economy picks up and unemployment moderates or stocks decline. Economic pick-up suggests inflation while stock declines may indicate a deflationary event like more COVID. Active Management seeks to avoid risk to your financial plan while a static allocation to stocks could mean some sleepless nights. How do we do that: a proprietary volatility signal to proactively add or subtract risk; extensive market technical analysis on indices and individual securities; a consultant who uses Natural Language Processing (NPL) on media sources to understand investor Zeitgeist; and value-added positions featuring disparities in value by asset class, sector and geography. Our Investment Committee meets bi-weekly to discuss these inputs, model potential outcomes, and agree on future actions.
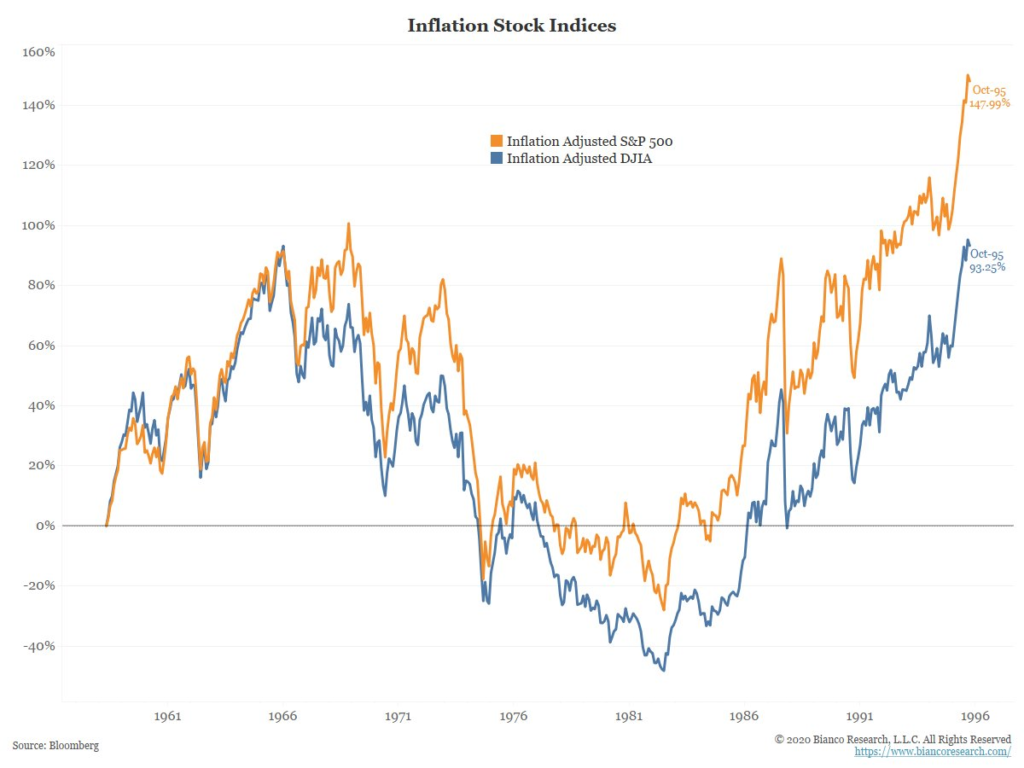
From our Investment Committee discussion, here are the extremes that are possible given the excesses of the current market. Below is the inflation-adjusted S&P 500 Index (SPX, orange line) and Dow Jones Industrial Average (DJIA, blue) from 1958 to 1995. From the 1968 peak to the 1982 low, the SPX lost 65% of its inflation-adjusted value. It was not until 1993 that the inflation-adjusted SPX exceeded its 1968 peak! 1995 for the DJIA!

Source: Bianco Research LLC
Below is the return of the Japanese stock market which experienced a long-term deflationary environment. Despite the stock market benefiting from the Bank of Japan’s huge stimulus drive, in which it has bought exchange traded funds (ETFs) and its monetary easing to drive down the yen, helping exporters, the annualized return is 1.30%[11] from 12/31/89 to 2/13/21. After 30 years, this market is only now reaching new highs.

We are always striving for a balanced view. From these discussions, striking the right aggressiveness
versus defensiveness incorporates the possibility that corporate profits could boom in 2021 based on some significant lifts to economic activity:
- Massive global monetary stimulus.
- Vaccine inspired economic recovery.
- The housing boom and higher consumer net
worth. - A declining US Dollar to support
multi-national companies.
Of course, risks to the outlook include:
- Inflation accelerates, bond yields surge, and the Fed hints at tapering sooner than expected.
- COVID gets out of control, vaccinations hit some bumps in the road, and the global economy is impacted, even China.
Success
Due to the above, now more important than ever is to have a professional fiduciary looking out with you for your monetary interest. It is so easy at this stage, to miss the disconnect between the real-world economy and the stock market and be tempted to chase stock valuations that as a whole,
are trading near all-time highs based on many historical measures. One could follow narratives like, “stocks only go up over the long term” while listening to CNBC and ever bullish Wall Street strategists and act against your best interest. The recent GameStop affair is the best example. If you are investing
based on this information, likely your maximum regret would be not participating in the last leg up in these markets.
In contrast, we’ve talked a lot about risk balancing. In practical terms, we do not want to fight the Federal Reserve, run for the hills, or make judgments on how others make money. Rather it is important to be in the market and have the proper intellectual and emotional distance to achieve client goals while avoiding scenarios and regimes that can damage your long-term success. We believe your true maximum regret would be not being able to retire, donate or spend when you choose.
In 2021, minimizing this maximum regret is of greatest importance to us at CIG. In our view, either the economy picks up or stocks decline. Economic pick-up suggests inflation while stock declines portend a deflationary event like more COVID. Our preference is for better economic growth without excess inflation. Continuing our theme for 2020 – “The Ride”[12], we will keep on actively managing the portfolios and applying the risk balancing framework to help clients achieve their goals and sleep well at night.
[1] https://www.hussmanfunds.com/comment/mc210201/
[2] https://en.wikipedia.org/wiki/There_are_known_knowns
[3] https://finance.yahoo.com/quote/%5EGSPC?p=%5EGSPC
[4] Source: Morningstar as calculated by CIG
[5] https://lab.credit-suisse.com/#/en/index/CSLAB/CSLAB/overview
[6] Source: Morningstar
[7] https://fred.stlouisfed.org/graph/?g=B6jj
[8] https://fred.stlouisfed.org/graph/?g=B6mv
[9] Gavekal Research/ Macrobond
[10] https://www.washingtonpost.com/business/2020/12/31/stock-market-record-2020/
[11] https://www.dol.gov/sites/dolgov/files/OPA/newsreleases/ui-claims/20210261.pdf
[12] Source: Morningstar
[13] https://cigcapitaladvisors.com/june-2020-asset-management-update-the-ride/
This report was prepared by CIG Asset Management and reflects the current opinion of the authors. It is based upon sources and data believed to be accurate and reliable. Opinions and forward-looking statements expressed are subject to change without notice. This information does not constitute a solicitation or an offer to buy or sell any security.


