
What a difference a year makes. Last December, equity markets plunged almost into bear market territory driven by fears that the Federal Reserve and their rate hikes would throw the economy into a recession. Today, the Federal Reserve is buying more treasury bills than they ever bought in prior Quantitative Easing (QE) periods and have pushed the markets to new all-time highs[1]. QT, or “Quantitation Tightening” – increasing short term rates and a shrinking Federal Reserve balance sheet – is but a vague memory now. So, just as last year’s pessimism clearly was overdone, today’s optimism is likely outpacing the economic evidence that the economy is moving to higher growth.
A measure of that is the CNN Fear & Greed Index- below reaching the “Extreme Greed” level as we started trading for 2020 versus 1 Year Ago[2].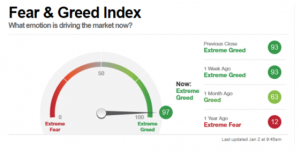
2019 was a stellar year for the equity and bond markets. Nearly every major asset class had significant outperformance versus the rate of inflation. That said, it is important to recognize 2019’s good returns were primarily driven by what investors are willing to pay for a dollar of company earnings (the “earnings multiple”), as annual earnings growth is likely to be only single digits when companies complete announcing their 2019 Fourth Quarter results this month. 2018’s disappointing equity market returns were the result of the exact opposite situation: 22% earnings growth but declining earnings multiples. You may recall from our January 2019 letter that almost no asset classes beat inflation in 2018. While such a dichotomy between the years is not unheard of, it was historically extreme as noted by Morgan Stanley[3].
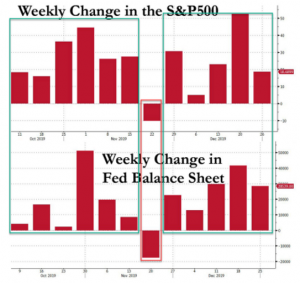
Central Banks, including the Federal Reserve, can have a large impact on earnings multiples. According to economic theory, when money growth is faster than the growth of the economy, the excess money goes into financial assets driving even expensive stocks and bonds higher. Ever since the start of October when the Fed launched QE4 in response to the September stealth banking crisis, the Federal Reserve balance sheet rose 11 of 12 weeks starting October 9, and declined just 1 of 12, and magically, the S&P did just that as well[4].
We remain concerned that the New York Federal Reserve continues to inject reserves into the banking system to keep some short-term rates from rising. This system, the overnight repo market, is where the interest rates that central banks set meet the interest rates that real economic actors use. You may recall the unrest in September in the money markets, when short-term interest rates got out of the Federal Reserve’s control and briefly spiked to 9%[5]. This could signal that something’s potentially wrong with the financial system, especially as it relates to banks and liquidity.
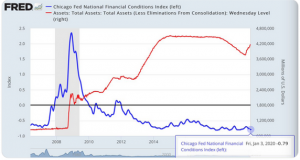
During 2019, we counted over 50 Central Bank easing actions, and global short term rates declined about -0.6%[6]. The aggressiveness of the Central Banks has been a surprise to many with the Federal Reserve, in particular, adding almost $400 billion dollars to the markets in just four months! (Note dramatic upturn in the graph below[7].)
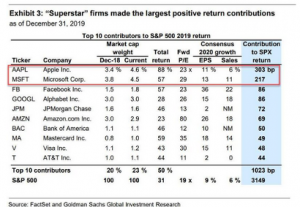
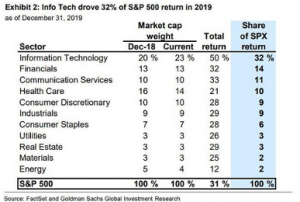
It is also remarkable how skewed the S&P 500’s 2019 return is toward a small handful of larger-cap firms and sectors. Apple (+88% return) and Microsoft (+57% return) accounted for almost one-fifth, and Information Technology was 50% of the S&P 500 index’s return. The largest source of stock buying was the companies themselves, with Information Technology buying back the most stock of any sector.
Companies buying back their own shares has been a major contributor to the rally since 2009. A Goldman Sachs analysis warns that they anticipate 2019 stock buybacks will drop 15% in 2019 to $710 billion and continue to drop in 2020. Corporate buybacks currently provide more demand for stocks than any other individual source, including households, mutual funds or exchange-traded funds. Buybacks as a percentage of trailing annual free cash flow has historically peaked near the highs of the market, i.e.: 2000, 2008, and 2016[8]. A slower pace of buybacks should not only drag on companies’ earnings per share, but also lead to increased market volatility as corporations provide less support to the equity markets.
The last time that we saw such dynamics in the market was the late 1990s, with “insurance” rate cuts, skewed returns and political risks. We remember what happened in 2000: a severe market downturn.
All of this is in the background of an investment market that wants to find a narrative to support driving asset prices higher. In December, the narrative was that the three biggest worries of 2019 have been solved during the week of December 9. On trade, the U.S. and China agreed to a “Phase One” deal and additional tariffs scheduled for December 15 were delayed. In the UK, Prime Minister Boris Johnson won a landslide victory, ensuring that “Brexit” would finally take place. Lastly, the Federal Reserve said that interest rates should remain steady through 2020. As we entered 2020, markets started off slow but now have begun to make some new highs. Given recent events in the Middle East, it feels like anything could happen.
Where does this leave the investment markets? One of the best indicators of the fair value of the stock market in the U.S. is the total market value relative to the total economy, or GDP. At this point, an argument could be made that the market is significantly overvalued, given that the total market value is almost 155% of the last reported GDP. The last time that this happened was the Dot Com Boom of the late 1990s.
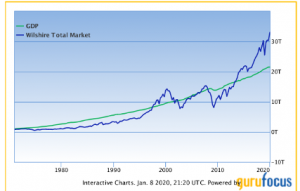
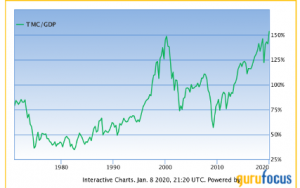
While some may argue that low interest rates and the amount of company sales overseas have impacted this ratio, on the face of it, the U.S. stock market would likely need to return about -3% per year in the next eight years to get back to the long term trend for the economy.
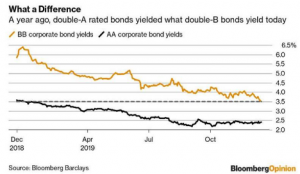
The corporate bond market has also benefited from declining interest rates over the last 18 months. As interest rates and bond yields have fallen in Europe and Japan into negative territory, investors there have bought more corporate bonds in the U.S[9]. As a result, the current market requires investors to increase risk in order to maintain the interest payments that they received in previous years. As of mid-December, the average junk bond (BB rated) yielded just 3.5%, an all-time low, including a credit premium or “spread” of just 1.64% more than risk-free Treasuries. A year before, the average high quality corporate bond (AA rated), such as those issued by Berkshire Hathaway, Apple and Exxon, was yielding 3.6%, more than the yield one now gets for bonds whose rating is some nine credit rating levels lower, in deep junk territory[10]. Meanwhile, cracks are starting to show in the lowest rated bonds[11].
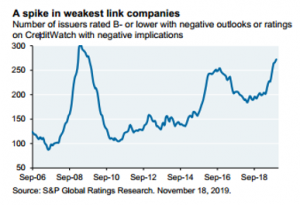
Consequently, our objective in 2019 was to generate returns ahead of client financial plan targets by taking restrained risk in relation to client general risk preferences. We accomplished that by being:
- Slightly less invested in stocks and 25% less invested in bonds versus our benchmarks.
- Invested in shorter-term bonds to avoid the risk of rising interest rates.
- Diversified internationally and in alternatives investments like Gold.
- Underweight expensive corporate bonds and loans with deteriorating protections for investors like those mentioned above.
In 2020, the CIG team will continue to weigh the potential risks in the markets and plan for a wide range of scenarios, both positive and negative, while steadily reevaluating and managing the appropriate level of risk so that clients can achieve their financial plan goals. Specifically, our strategy remains consistent with prior years and will encompass:
- A core portfolio which focuses on stock and bond characteristics – Factors – that are a persistent source of investment return. We will attempt to limit the Momentum Factor in our portfolios. Momentum manifests itself in investors simply buying what has been making money (i.e., high growth names and consumer staples stocks) and selling what hasn’t (i.e., energy). The problem is that it leads to crowding into the same stocks. As soon as those stocks stop making money, these investors rush for the exits and the stocks fall significantly, which is what happened in the first two weeks of September.
- Meaningful diversification. After a 10-year equity bull market in the United States, the prudent approach for client portfolios is to have some investments in different geographies, fixed income and alternatives. We seek to deliver a nuanced, material understanding of diversification, which typically means carefully buying assets that have not appreciated and selling investors’ favorites. Diversification remains our best defense.
- A long-term approach. This methodology is particularly true in clients’ variable annuity and educational accounts, which generally do not have as extensive Factor or diversification exposure as the main portfolios.
- Tactical risk management. When the markets become, in our estimation, too volatile, we take risk management action in CIG’s Dynamic portfolios.
The bottom line is that we expect 2020’s market returns to be much lower than those of 2019 and less uniform. We continue to seek out “value-additive” investments to take advantage of market opportunities and be more contrarian and tactical to enhance portfolio returns in 2020. Markets are expensive and likely to get more expensive as a result of “easy money” from Central Banks. The risk of policymakers losing control is rising along with geopolitical risks. In this late cycle environment, CIG has taken a defensive stance and is prepared to take further action as the market direction dictates; we continue to focus on our clients’ risk-adjusted returns in support of their financial objectives and goals. In the words of Warren Buffet, the “Oracle of Omaha” and legendary investor, we will be “fearful when others are greedy and greedy when others are fearful.”
This report was prepared by CIG Asset Management and reflects the current opinion of the authors. It is based upon sources and data believed to be accurate and reliable. Opinions and forward-looking statements expressed are subject to change without notice. This information does not constitute a solicitation or an offer to buy or sell any security.
[1] Yahoo Finance
[2] https://money.cnn.com/data/fear-and-greed/ as of 1/2/20 at 9:45AM
[3] “On the Markets,” Morgan Stanley, January 2020
[4] “Market Your Calendar: Next Week The Fed’s Liquidity Drain Begins,” ZeroHedge.com, January 2020
[5] https://www.chicagofed.org/publications/chicago-fed-letter/2019/423
[6] Cornerstone Macro, November 3, 2019
[7] https://fred.stlouisfed.org/series/WALCL
[8] Goldman Sachs 10/21/2019
[9] “Even Goldman Bristles As Junk Bond Rally Smashers All Records,” Zerohedge.com, December 2019
[10] Bloomberg Opinion and Bloomberg Barclays
[11] “Eye on the Market,” J.P. Morgan


