The pandemic-infused markets have been a roller coaster ride during the first half of 2020. After a short climb in January and February, the S&P 500 Index fell by 35% in just over one month and then staggered back up the lift hill[i]. What twists and turns the market roller coaster will offer next is difficult to know.
Going forward, the best possible outcome in our opinion would be a widely available vaccine by year-end and everyone goes back to work. The U.S. would just need to figure out servicing trillions of additional government debt. Many worse outcomes would likely include no effective vaccine like most viruses, millions of permanent job losses, and enduring changes to business models in multiple industries.
When the market reached its high on June 8, our view was investors seemed to be focused predominantly on the best possible outcome. It is our opinion that the massive rally from the March 23 low was largely driven by “Stimulus” winning the tug-of-war over “COVID-19.” According to Cornerstone Macro, until last week when the European Union agreed to a unified stimulus fund which brought them in line, the U.S. has led the world in fiscal and monetary stimulus.[ii] But the U.S. has continued to lag the world in COVID-19 response. Only some emerging markets now have infection rate trends worse than those of the United States.[iii]
Regardless of any value judgment about the present situation, one could theoretically pull out the playbook for a traditional recession, review the history books, assess the probabilities/outcomes and lock in a portfolio for the next two years and perhaps experience a ride like Cedar Point’s kiddie coaster Woodstock Express.
If only more of us were alive back in the 1918 global pandemic and the structure of the economy, technology and banking had more resemblance to today’s world; if only probability theory could be easily be applied to a pandemic occurring in a non-ergodic, uncertain time, maybe we could do that. A non-ergodic system, such as this time, has no real long-term properties i.e., history is no help to predicting the future. It is prone to path dependency – which is just a fancy statistical way of saying that “THE RIDE is everything”.
Months like March keep us up at night. When we think about the markets, we are thinking about our goals, dreams, fears, and hopes. These long-term goals end up in the financial plan and are embedded in the portfolio strategy that our clients may select. Given a choice between being down -35% or losing -15% in March, many of us would choose -15%. At the same time, we try to stay focused on the long-term goals.
Now that we may be again back at the metaphorical top of the coaster’s lift hill, it is important to consider the next moves both prudently and imaginatively. Since June 8, the S&P 500 Index has been alternating between gains and losses around a 250-point range[iv]. There have been several 2%+ declines, including June 11’s -6% loss when Federal Reserve Chairman Powell said, “We’re not even thinking about raising rates” any time soon. Investors were distressed that the dovish Fed does not expect to raise rates until 2023. With almost 40 +/-2% days this year, the markets are on pace for the most swings since 1933[v]. For the month of June, the S&P 500 index returned just 1.8% while gaining 20.5% during the quarter (the best quarter since 1998)[vi].
For now, the stunning market rally from the March 23 low appears to have come to a pause in the U.S. Investors are back to that nervous feeling when checking the market each morning as if looking over the precipice of the rollercoaster’s first hill. What investors see is a stock market that is at peak valuations, as measured by total market capitalization / GDP (which we have talked about in the past)[vii]:

As the chart above clearly illustrates, there is no history that shows valuations over 150% to GDP are sustainable, even for brief periods of time. Yesterday, GDP for the second quarter was announced and the -33% annualized decrease was its worst quarterly hit since the Great Depression[viii]. With GDP falling from approximately $21.5 trillion to $19.4 trillion, valuations are now over 170% to GDP.
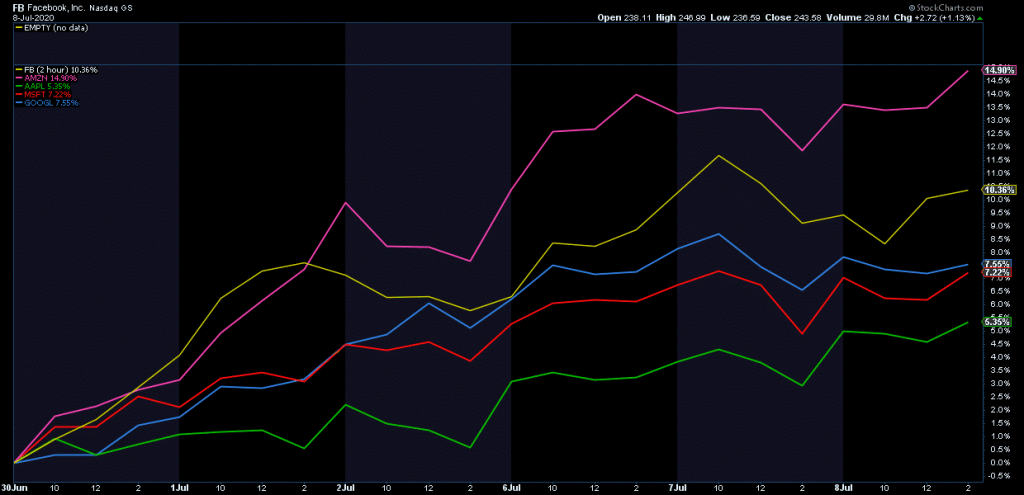
The S&P5, the so called FAAMG[ix] stocks, earlier this month added over a half a trillion in market cap in just 6 days. (Please see the chart[x] below showing the percentage return of these five stocks from June 29 to July 8.) In 2020, these stocks have added over $1.6 trillion in market cap[xi], a striking feat during any bull market with excellent growth, not a historic recession. Sure, some of these companies may have grabbed market share and pulled some sales forward during the shutdown but they all face anti-trust concerns which seem to be bi-partisan and international concerns. These stocks are disproportionately driving the market.

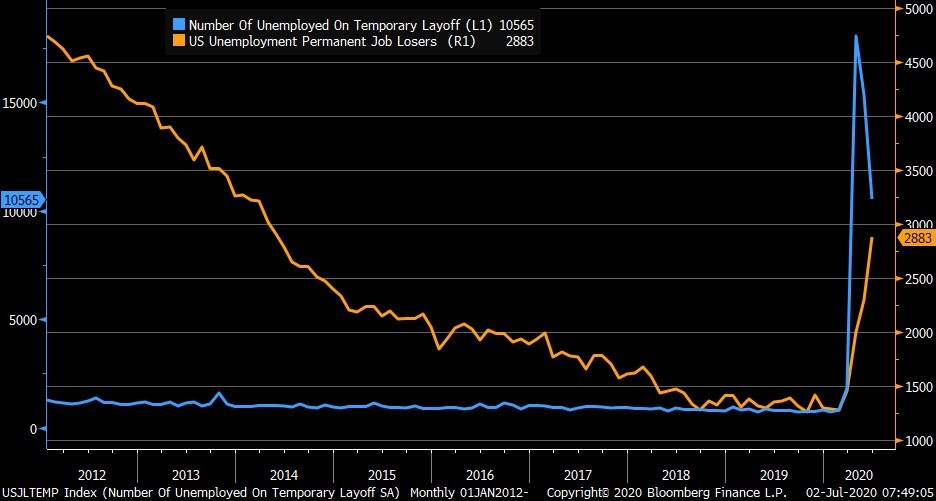
Certainly, economic data has seen a massive improvement from the recent historic collapses. However, it important to keep focused on year-over-year data and especially permanent job losses, which keep mounting. The chart[xii] below shows data from the US Department of Labor with the blue line indicating the number of temporarily laid off workers in the US and the yellow line displaying the number of permanently laid off workers.

Today, past experience is not unworkable, but if relied on thoughtlessly it can be hazardous. Some events will play out in the future as they have in the preceding times, but many will not. As indicated above, markets are rich and driven by a few stocks and simultaneously, the U.S. is experiencing some of the worst economic conditions in a long time.
Based upon CIG’s investment process and what we saw in the markets, we had fortunately already started to get more conservative in 2019 in the Strategic and Dynamic portfolios. Fast forward to 2020, at the beginning of February when the markets became more volatile, we acted within the Dynamic portfolios to reduce risk further, primarily by reducing the portfolios’ exposures to equities and adding to diversifying assets generally believed to be protective in a downdraft. We continued to act in March to attempt to dial-in the appropriate market exposure in the Dynamic portfolios, increasing risk, primarily by adding equities, after the market bottomed on March 23.
Hopefully, our strategic and tactical actions have allowed our clients to sleep better at night. CIG attempts in its client portfolios to get closer to the kiddie coaster experience versus the full rollercoaster ride of the S&P 500 index. The most important job is to strike the appropriate balance between offense and defense, i.e., the risk of losing money and the risk of missing opportunity. There will continue to be twists and turns along the ride but so far, all the previous scary rollercoaster rides in the market have concluded the same way: eventually, they stopped.
We will see in the coming months how the tug-of-war between Stimulus and COVID-19 plays out. There is probably nothing more path dependent than re-opening an economy in a pandemic. Let us hope for the best – a confidence-inspiring Goldilocks-style “not-too-fast / not-too-slow” opening, while also considering the myriad of possible economic and financial outcomes. Of course, never ignore the extreme risks which do not appear to be going away, especially as positive COVID-19 cases trend higher. We continue to be thoughtful, adaptable and at your service.
[i] Calculated from data obtained from Yahoo Finance, as of July 27, 2020
[ii] Cornerstone Macro, CSM Weekly Narrative, July 26, 2020, page 2.
[iii] Coronavirus.jhu.edu/map.html, as of July 30, 2020.
[iv] Calculated from data obtained from Yahoo Finance, as of July 27, 2020
[v] Bespoke Investment Group, July 2020
[vi] Calculated from data obtained from Yahoo Finance, as of July 27, 2020
[vii] Bloomberg as of July 30, 2020
[viii] Source: U.S. Bureau of Economic Analysis
[ix] Facebook, Apple, Amazon, Microsoft, Google
[x] StockCharts.com via NorthmanTrader on July 9, 2020
[xi] “Warning”, NorthmanTrader, July 9, 2020
[xii] U.S. Department of Labor via Bloomberg as of July 6, 2020.


