Summary:
* Equities bounced in October following September’s drawdown.
* Zooming out: The journey from where we were to where we are versus where we hope to be
* Defining Bear Market rallies
October 2022 Returns:
Commentary:
Domestic stocks bounced in October, with the S&P 500 gaining +8.1% after September’s -9.2% drawdown.[ix] Fixed income lost -1.3% as measured by the Bloomberg U.S. Aggregate Index.[x] International Equities in developed markets gained +5.4%[xi], while Emerging Market Equities lost -3.1%.[xii]
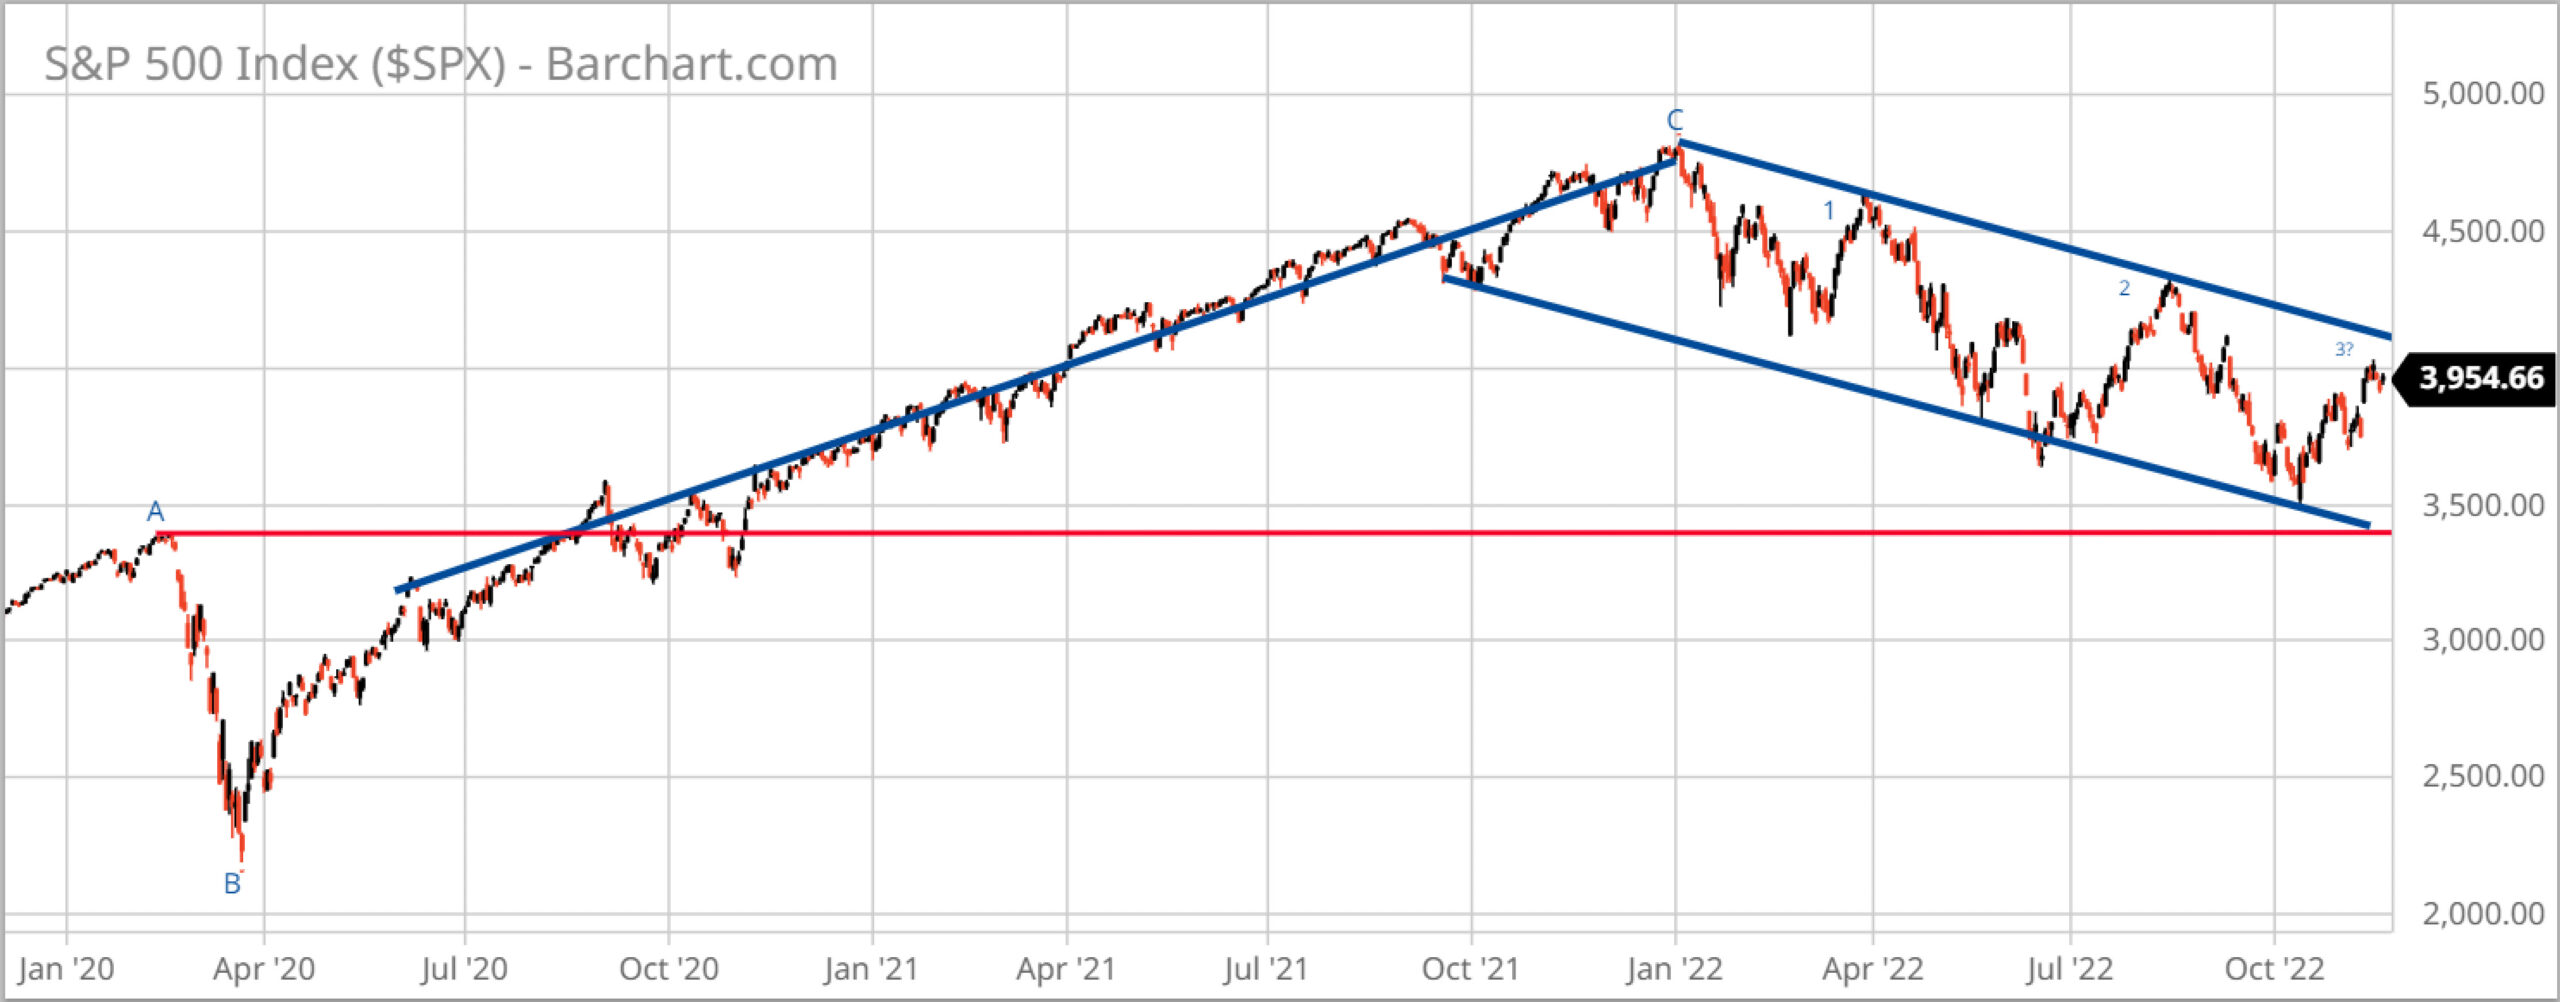
We believe it is important to zoom out to gain a greater perspective and look at the journey the stock market, as measured by the S&P 500, has taken since early-2020 through to early-November 2022, focusing on several timeframes in the chart below. The market was at an all-time high in February 2020, (A), just before Covid-19 lockdowns shook the global economy. The market then fell 33% until it bottomed out on March 23, 2020, (B). The market then steadily rallied to a new all-time high from the Covid-19 low to January 3, 2022, (C), as central banks worldwide intervened and provided massive liquidity through quantitative easing and low interest rates. Ever since the market hit its all-time high in early-January of this year, it has traded in a channel of successively lower highs and lower lows.[xiii]
Is it possible we are currently experiencing the third Bear Market rally since the all-time high in January 2022? Bear Market rallies have been defined as significant counter trend recoveries that can last as briefly as a few weeks to as long as several months before the market reverses course to a new low. The chart below serves to illustrate the concept of a Bear Market rally.
 Source: Barchart.com
While we are encouraged by the stock market’s resilience seen from October into early-November, equities are historically expensive. The total market capitalization of U.S. stocks currently is 153% of U.S. gross domestic product (GDP), almost the same level as the 157% dot-com peak in March 2000, which was right before that bubble burst.[xiv] One overvalued stock, for example, is Apple, Inc. (AAPL). Apple’s stock soared +8% after it reported its recent quarterly earnings results as being slightly better than expected. Apple beat Wall Street analysts’ earnings expectations because of its iMac sales while both its services and iPhone sales disappointed. Apple CEO Tim Cook explained that “silicon-related wafer supply constraints were not significant in the quarter” (microchip shortages ended), and it allowed the company to satisfy back orders and “fill the channel” at resellers and retailers. Between 2008 and 2016, Apple’s price-to-earnings ratio was in a range of 10 to 17 and its compounded annual earnings per share growth rate over that same period was 30%.[xv] Now, it trades at more than 24 times earnings, with analysts expecting only 3% growth in 2023![xvi] Many other technology stocks are similarly overvalued on a historic basis.
We reduced exposure to technology stocks in October in our actively managed strategies before earnings were announced and just recently added back technology exposure in three targeted areas that are all down significantly from their highs: cloud computing, semiconductors, and cyber security.
Year-to-date (through to 10/31/2022), our CIG Dynamic Growth Strategy composite has avoided approximately 44% of the losses of the growth benchmark, and the CIG Dynamic Balanced Strategy has avoided approximately 59% of the losses of the balanced benchmark.[xvii]
We would welcome the opportunity to engage with you — via voice or email — to discuss your questions, and market challenges and opportunities, as well as the benefits of active investment management.


