Summary:
* Re-openings and even MOAR stimulus
* We may have to wait a long time
* A not so typical market recovery
- Commentary:
- In March 2021, equity markets continued to rally as Texas eased all business restrictions and lifted its mask mandate and the $1.9 trillion COVID-19 relief bill was passed by Congress and signed by President Biden, sending $1,400 payments directly to many Americans. Almost immediately after the bill signing, the Biden administration turned its attention to a $2 trillion infrastructure bill. Federal Reserve Chairman Powell reassured investors after the March FOMC meeting that the Fed is not planning on raising interest rates until 2022-2023 at the earliest. March went out with a bang, with the collapse of over leveraged hedge fund Archegos Capital which lost $20 billion in two days.[i]
- For the month, the S&P 500 Index was up +4.4%[ii] while the international stocks in developed economies, as measured by the MSCI EAFE Index Net, gained +1.8%[iii]. Emerging Market stocks (MSCI EM) were down -1.7%[iv]. Value stocks, measured by the Russell 1000 Value Index, added +5.9% and the Russell 1000 Growth Index, a measure of growth stocks, was up +1.7%[v]. Small-cap stocks, represented by the Russell 2000 Index were up +1.0%[vi]. Crude oil fell -3.8% for the month and Gold fell -0.8% [vii].
- Recently, we found a 2017 study by S&P Global[viii] that is informative for the current environment. As you may know, every investment is a claim on future cash flows that can be anticipated to be delivered to the investor over time. While the concept of “duration” is most used for bonds, it’s actually applicable to any investment and can be defined in two ways: i) the weighted average number of years it takes for the investment to deliver its payments[ix] and ii) the percentage change in the investment’s value in response to a change in the underlying gross rate of return. The second definition allows us, with some math, to convert a stock’s dividend yield to duration.
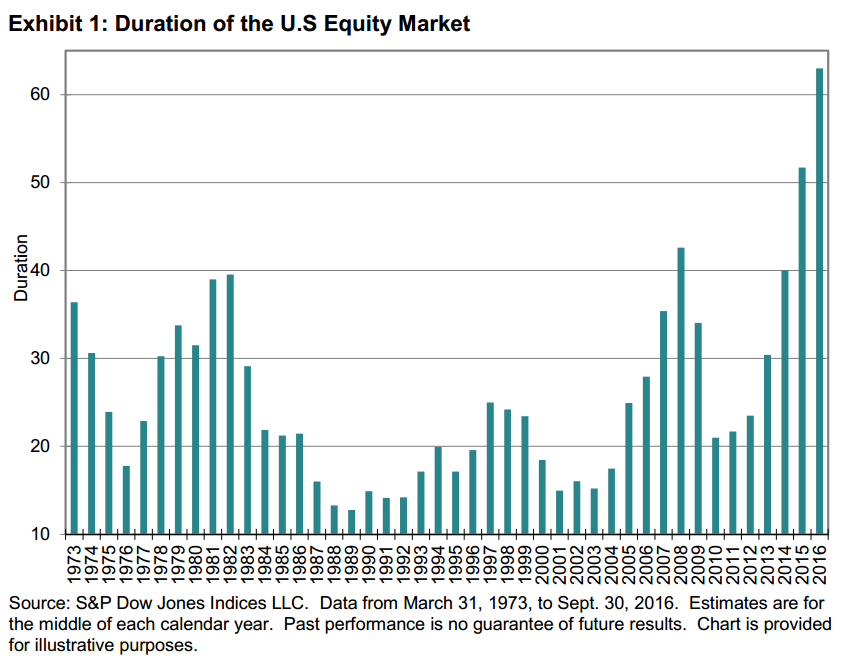
- As shown in the chart below by S&P Global, the duration for equities (i.e., the S&P 500 Index) over the past 149 years ending September 2016 has ranged from 13 to 63 years.

We have calculated the average duration for equities (i.e., the S&P 500 Index) over the past 149 years ending September 2016 to be approximately 23.2 years[x]. In a balanced portfolio like what we frequently structure at CIG, the historical average duration of a 60% equity/40% bond allocation is 16 years during that 149-year timeframe. Meaning if the markets decline significantly and do not recover, investors could reasonably expect that if they could stay invested (i.e., not sell at depressed prices), over time they may recover their investment via dividends or other cashflows.

Source: CIG Asset Management using data from S&P Global, www.multpl.com and www.ishares.com
Currently as shown in the table above, we calculate the equity duration at 67 years. The average duration for a balanced 60/40 portfolio is now 43 years, over 2.5 times the historical average!
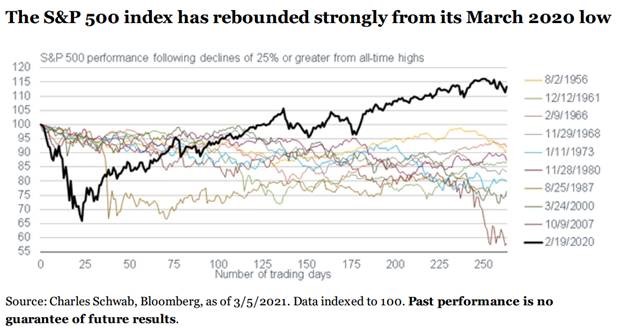
Meanwhile, the risk of a significant pullback continues to increase given that the current market recovery is unlike any in recent history. In the prior nine greater-than-25% declines in the S&P 500 Index over the past 64 years as shown in the chart below, none of those occurrences saw markets fully recover to their previous high in the one year following, let alone hit new highs.

This time is different because the Federal Reserve has printed enormous amounts of money and the US Government has plans to spend it. We have argued and still believe i) this “Fed backstop” is largely psychological and quite fragile and ii) the underlying economy remains in bad shape with for example, 18 million people receiving some kind of unemployment assistance. We suspect that any sustained downturn will occur just when the entire economy, including client businesses and medical practices are starting to suffer – a double whammy to everyone’s psyches.
At CIG, we define risk as “how bad could it be” and “how likely is this bad outcome.” Given high stock and bond valuations, investors could have to wait multiple decades for their portfolios to recover versus much shorter time periods like in 1989 or 2001. While it is quite possible that we are in an asset bubble right now, it is hard to know for sure when you are in it and, more importantly, when it will end. As you may recall from previous blogs, we have warned that risks are building in the market and this bad outcome is becoming more likely. So, we are staying the course of risk balanced investing – attempting to strike the right aggressiveness versus defensiveness in client portfolios in uncertain times.
Do you have enough time?
This report was prepared by CIG Asset Management and reflects the current opinion of the authors. It is based upon sources and data believed to be accurate and reliable. Opinions and forward-looking statements expressed are subject to change without notice. This information does not constitute a solicitation or an offer to buy or sell any security.
[i] www.bloomberg.com
[ii] Morningstar
[iii] https://www.msci.com/end-of-day-data-search
[iv] https://www.msci.com/end-of-day-data-search
[v] https://www.ftserussell.com
[vi] https://www.ftserussell.com
[vii] https://finance.yahoo.com/
[viii] “Applying Equity Duration to Pension Fund Asset Allocation: A Review of S&P 500® Duration” https://www.spglobal.com/spdji/en/documents/research/research-applying-equity-duration-to-pension-fund-asset-allocation.pdf
[ix] Intuitively, if one buys the S&P 500 Index for a price of 22 times its annual earnings. Assuming the S&P 500 Index companies pay the investor all their earnings, absent a sale, it will take the investor 22 years to get paid back.
[x] Source: CIG Asset Management using data from S&P Global, www.multpl.com and www.ishares.com
