In an era of consolidation in the wealth management industry, an annual check-up of who is managing your assets is important. With firms like LPL, Wealth Enhancement Group, Stratos Wealth Partners, it raises the question: Who is actually managing your money? Do you know the individuals on the company’s website?
We suggest that you conduct an Asset Manager checkup.
Annual Asset Manager Check Up List
Basics
ü Have you ever talked to the people who directly manage your hard-earned life savings?
ü If so, how often could/do you meet with them?
ü If not, how do they determine my risk tolerance and investment objectives and get to know you?
ü Is your advisor really doing the trades and asset allocation for your portfolio?
Advanced – Is the asset management offering compelling in regard to the following?
ü Performance- How does the strategy perform during up and down periods?
ü Selection- Do they actively manage the portfolio or is it invested in big technology companies all the time?
ü Insight- Is there common sense anchored in factual data, without rosy forecasts like we may often hear on TV?
ü New Ideas- Is there delivery of unique value through compelling theses? For example, Gold or Energy Sector investments at the right time.
ü Diversification- Do they utilize a variety of investments which complement existing illiquid holdings?
ü Trust- Are you going to trust this group to help you through the inevitable difficulties in the market? When risk appetites are high, are they good at restraining your exuberant actions? When risk appetites are low, will you feel comfortable restraining fearful activities and buying low?
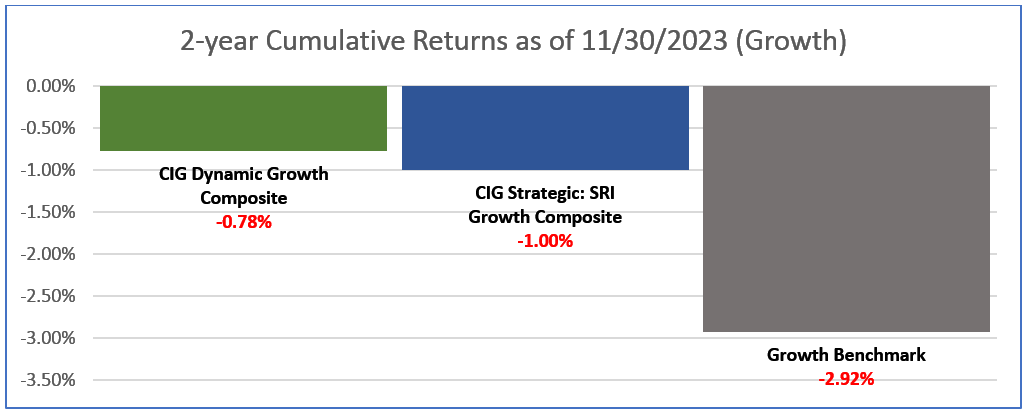
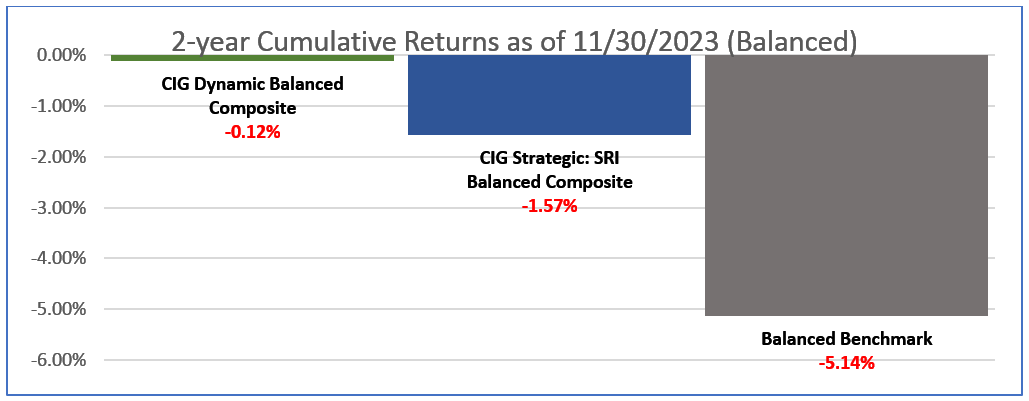
At the end of the day, what kind of “ride” or investment experience are they offering you? People don’t retire on %’s but on actual dollars. How did you do in 2022? If you were down, are you back to even with stocks soaring this year?
In our last letter, What’s Your Benchmark, we talked about comparing your investment portfolio to an appropriate benchmark and comparing your investment portfolio’s 3-year risk and return. As of November 30, 2023, our analysis revealed that the CIG Dynamic Balanced Composite achieved a trailing 3-Year annualized return of +2.30%, net of fees. This performance surpassed the Balanced Benchmark’s +1.95% return, all while assuming only half the risk of the benchmark, as indicated by the standard deviation of returns that 3-year timeframe. [i]
In 2023, U.S. stock performance has been largely dominated by the Technology sector and Communication Services sector. [ii]
We believe that many investors are currently experiencing recency bias – the tendency to place too much emphasis on experiences that are freshest in their memory – even if they are not the most relevant or reliable. How quickly investors have forgotten about the very negative returns in 2022!
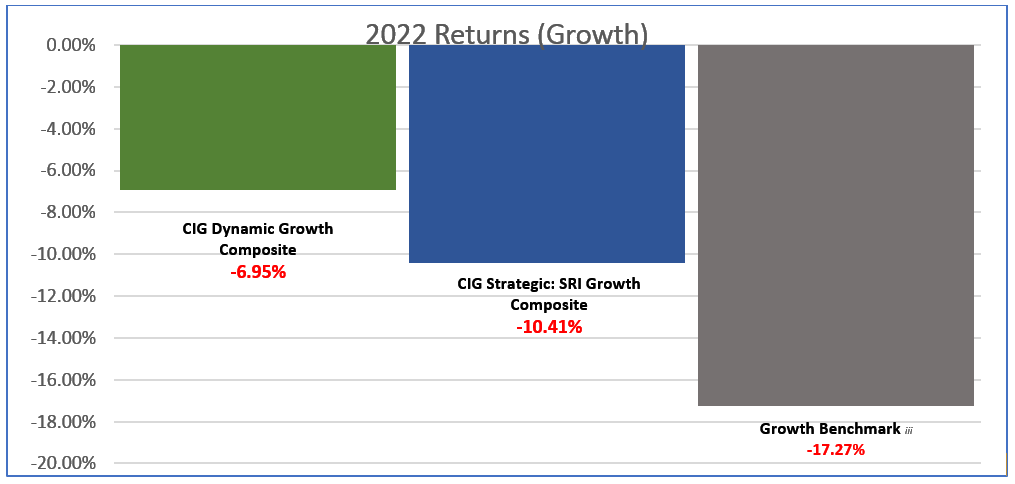
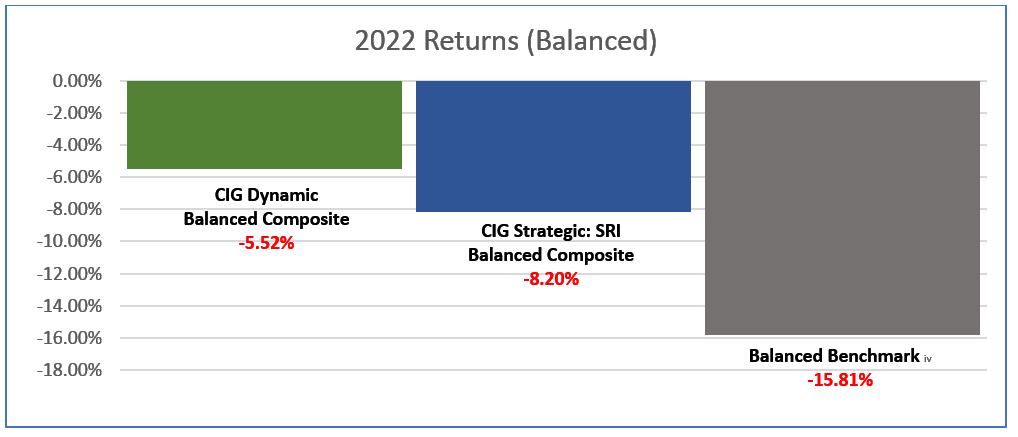
As seen in the two following bar charts, in 2022 at CIG, the CIG Dynamic Growth Composite avoided 60% and the CIG Strategic: SRI Growth Composite avoided 40% of the growth benchmark’s -17.27% loss. Net of fees.[iii] The CIG Dynamic Balanced Composite avoided 65% and the CIG Strategic: SRI Balanced Composite avoided 48% of the balanced benchmark’s -15.81% loss. Net of fees. [iv]
Calculated by CIG Asset Management using data from Tamarac. Represents performance from January 1, 2022, through December 31, 2022. Past performance is not indicative of future results. [v]
Calculated by CIG Asset Management using data from Tamarac. Represents performance from January 1, 2022, through December 31, 2022. Past performance is not indicative of future results.[vi]


