
Summary:
* US Equities surge while international equities lag
* Tesla and the growing stock market bubble
* What happens when a bubble eventually bursts?
Commentary:
The S&P 500 index gained +7.01% in October, bouncing back from its September decline and closing at an all-time high.[i] Overseas markets were up, but much less so versus the U.S., with the MSCI EAFE net index up +2.38% and the MSCI Emerging markets up +0.93%.[ii] Fixed income did not offer much in the way of returns for the month with the Bloomberg US Agg Bond Index falling -0.03%.[iii] Crude oil added to September’s gains, increasing +11.38% and closing at $83.57/barrel, a 7-year high[iv], despite global growth forecasts being revised lower.[v]
We continue to be concerned that U.S. equity markets may be in a bubble. Tesla, for example, gained +44% in October.[vi] In just 2 weeks, the company gained $310 billion in market capitalization. That gain is more than the market cap of 482 companies in the S&P 500 Index.[vii] Tesla’s current market cap is over $1.2 trillion, greater than the market capitalization of Toyota, VW, Daimler, GM, Ford, BMW, Honda and Hyundai combined![viii] Tesla isn’t the only stock that may currently be overvalued.
When we look at the market using several different measuring sticks, we find more extreme valuations. The Buffet Ratio, which we have talked about before and measures total market capitalization to U.S. GDP, is at 215.5%, double the 107.5% seen in May 2007, right before the Great Financial Crisis and 50% higher than the March 2000 dot com boom high of 142.9%.[ix] The current Shiller PE ratio for the S&P 500 is 40.09. The only other time that we saw the market trade at such a high price to earnings ratio was during the dot com bubble, when the S&P 500 traded above 40x from January 1999 through September 2000.[x] No one can predict with any degree of certainty just how much larger the current bubble can get or how long it may last, but we must take note of what has happened when previous bubbles finally burst.
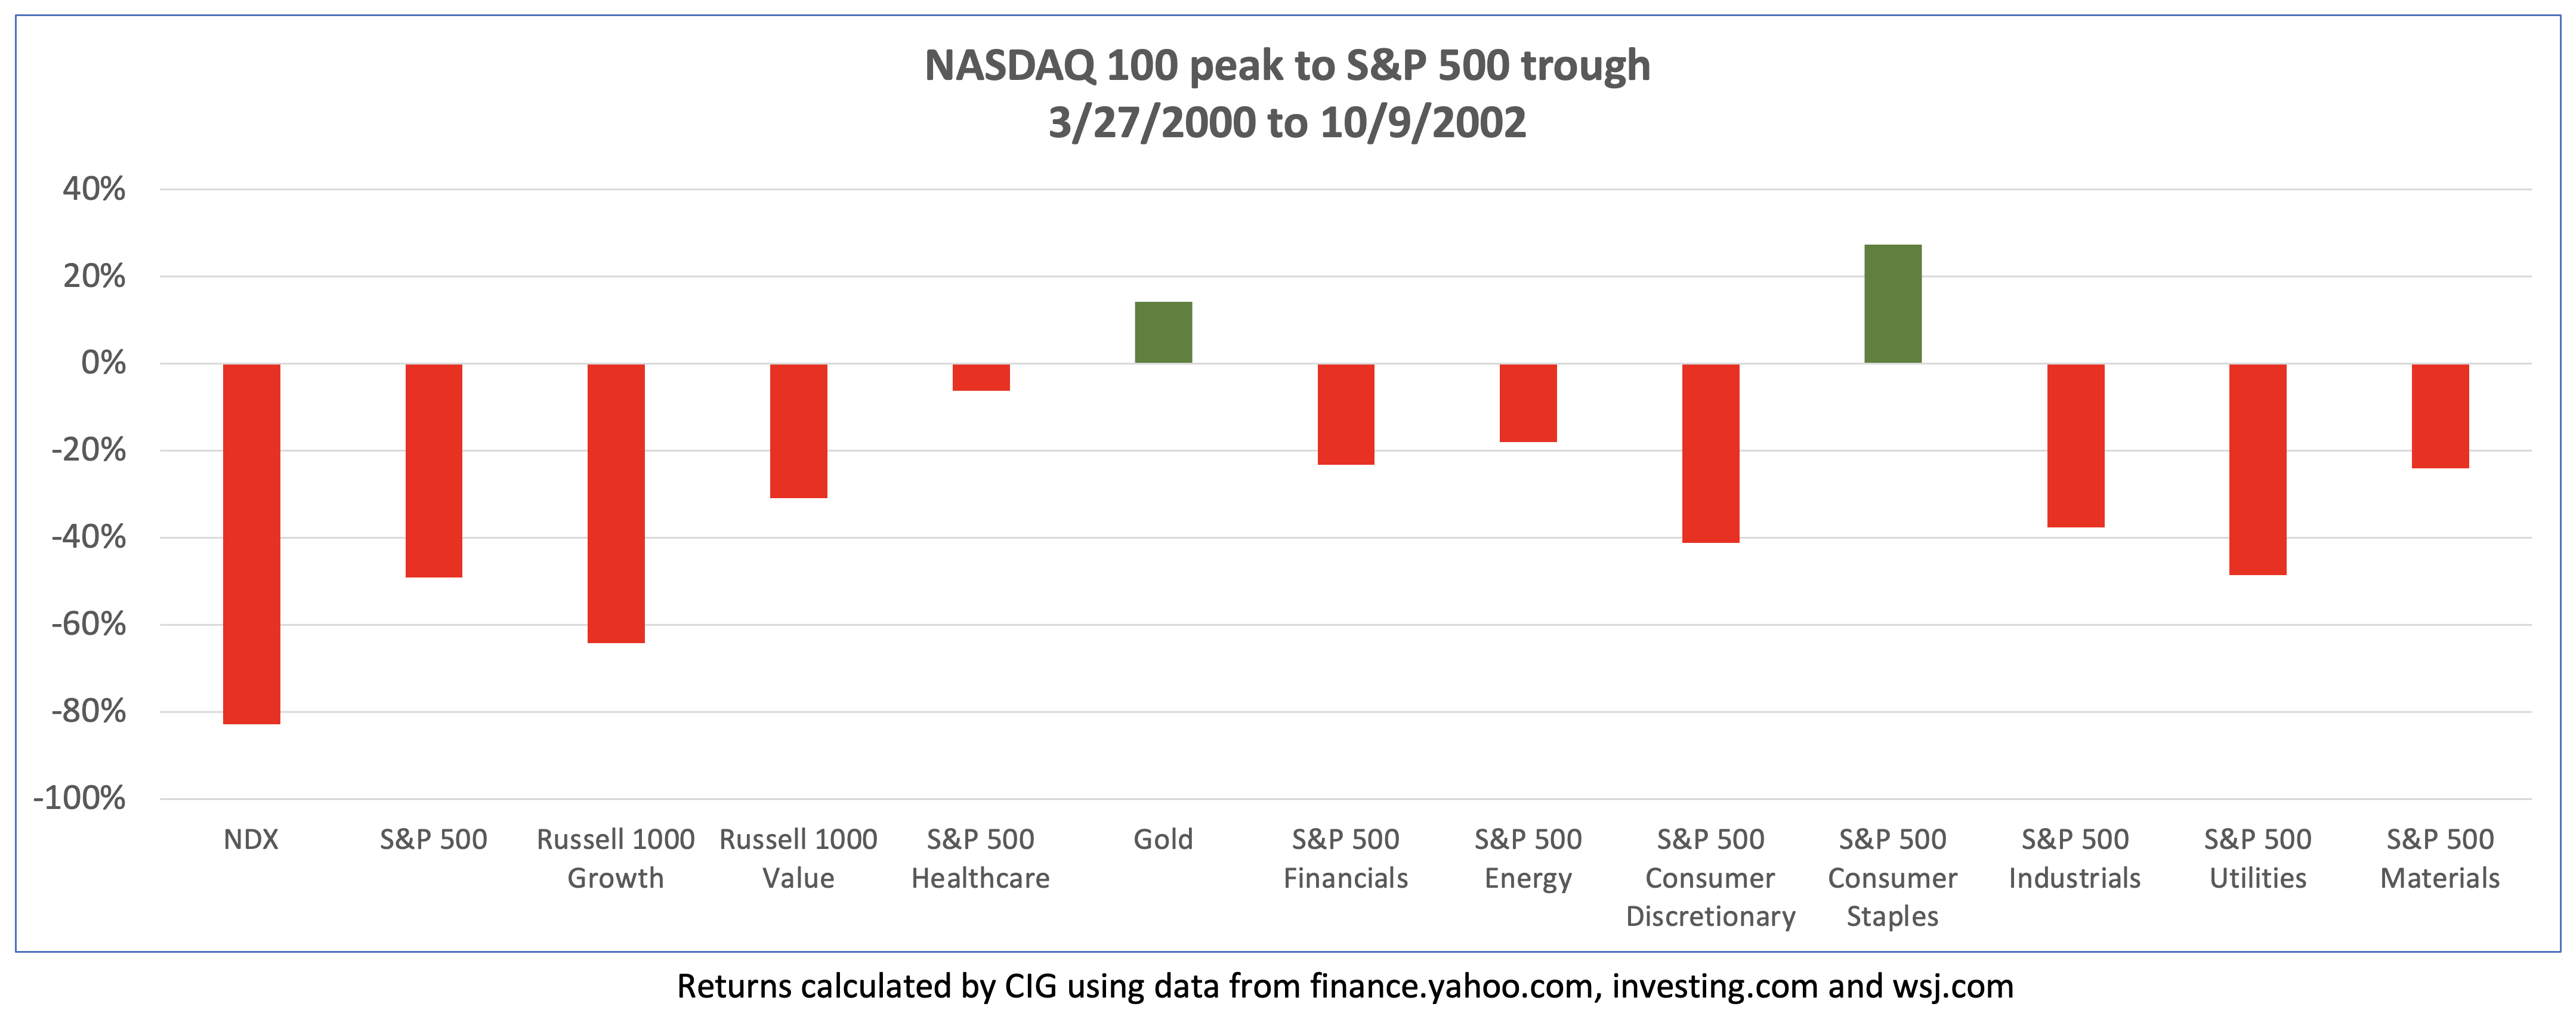
How bad can things get when a stock market bubble bursts? During what was, prior to now, the largest stock market bubble, the dot com boom, the NASDAQ 100 hit its then all-time closing high on March 27, 2000. The broader market, as measured by the S&P 500, did not reach the bottom until October 9, 2002 with a peak to trough loss of -49%.[xi] As illustrated in the chart below, a lot of money was lost in different sectors and factors during this period while gold and consumer staples, which clients currently have exposure to, gained.
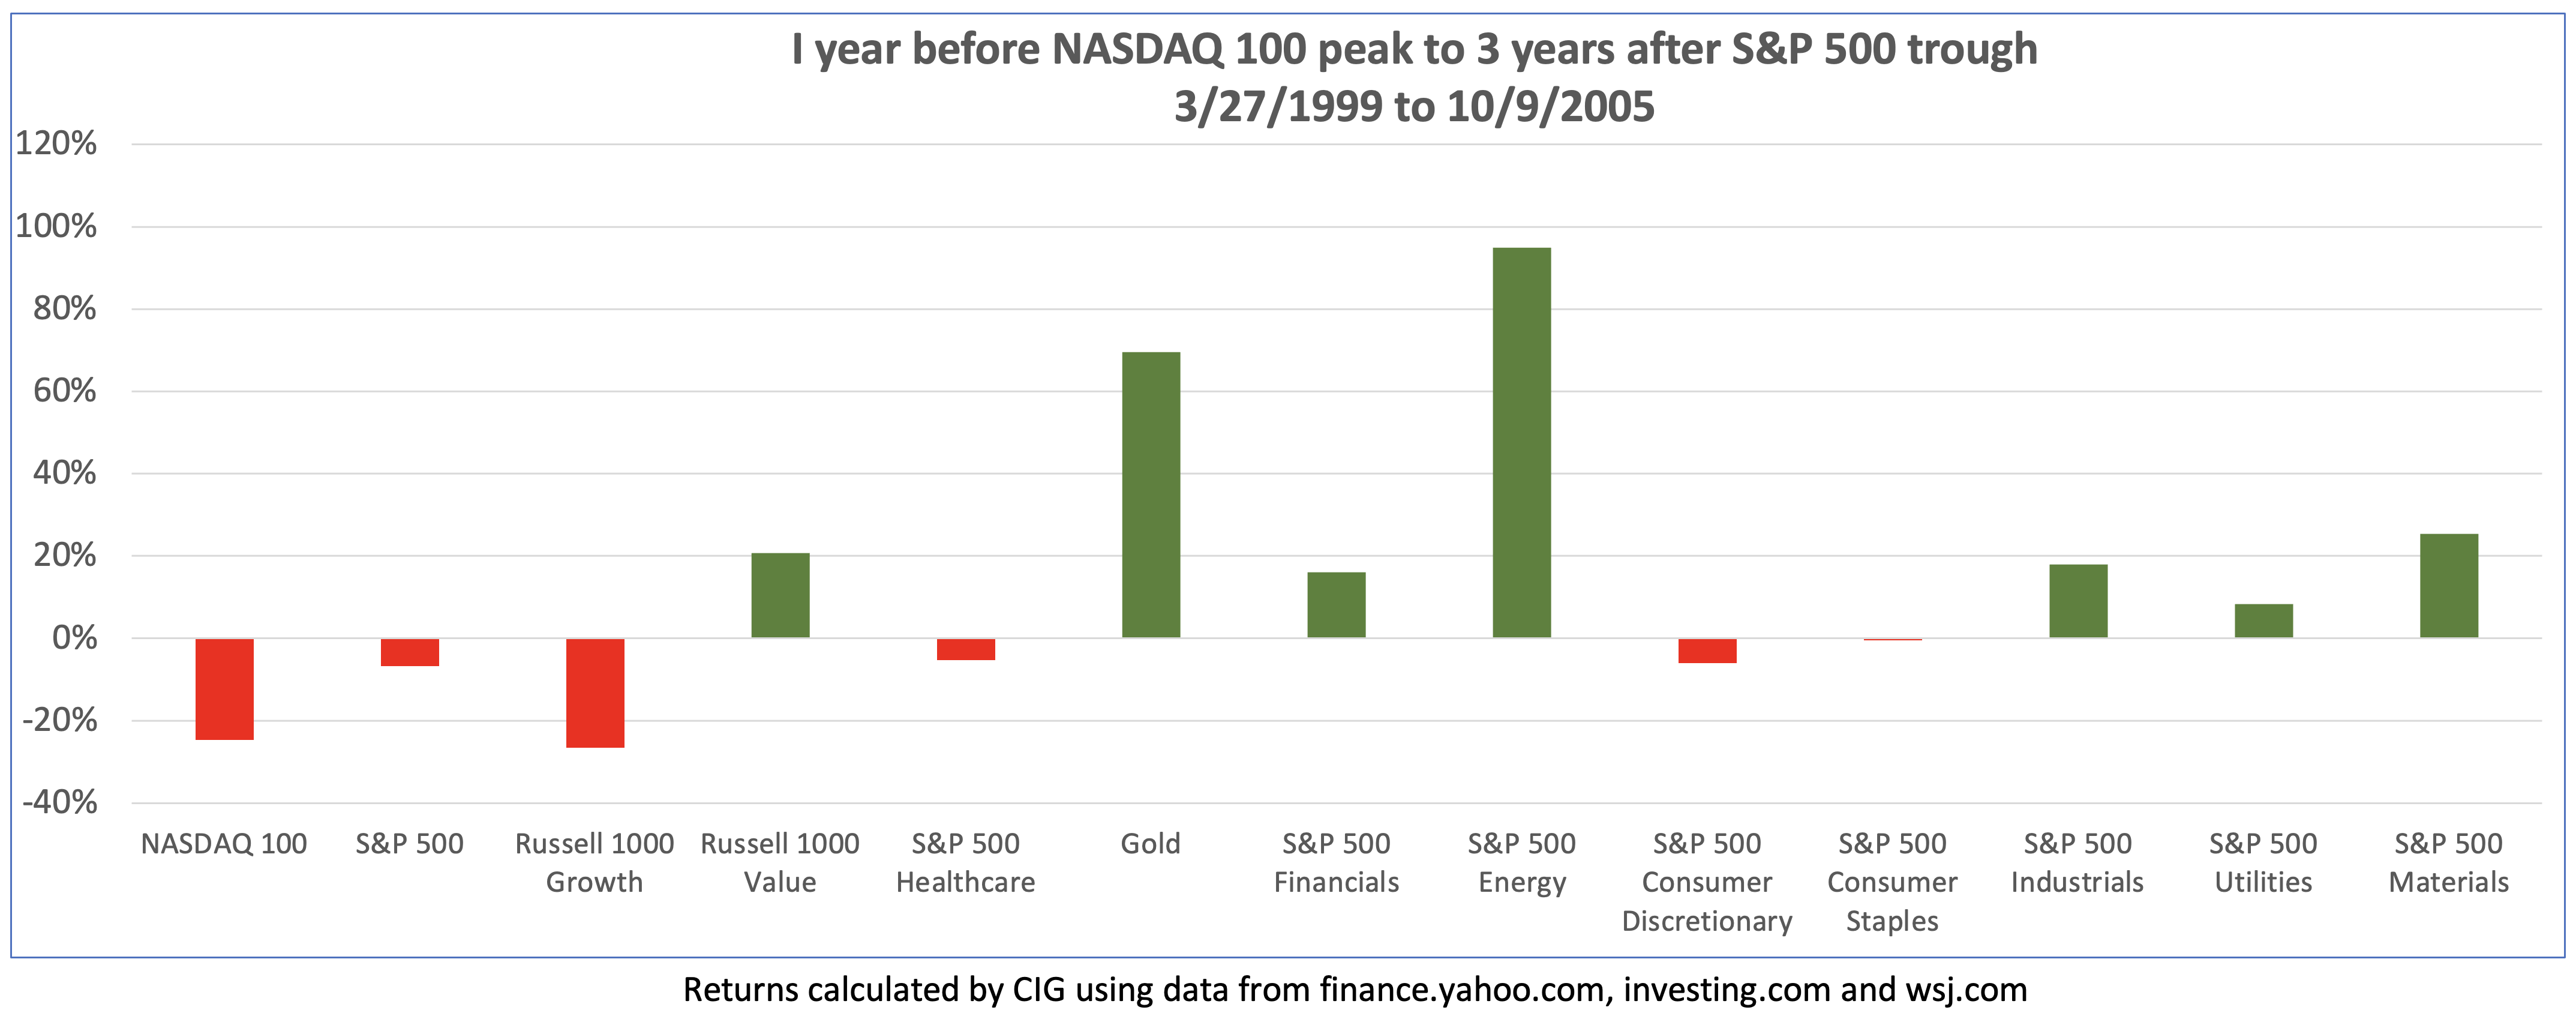
An investor would have to be extremely unlucky to buy at the top and sell at the bottom. What do returns look like if you bought one year before the top, on March 27, 1999 and held on for three years after the bottom, October 9, 2005? The S&P 500 was down -6.8%, and the NASDAQ 100 lost -24.7%. Notably, gold, energy, financials, industrials, utilities, materials, and value stocks were up.
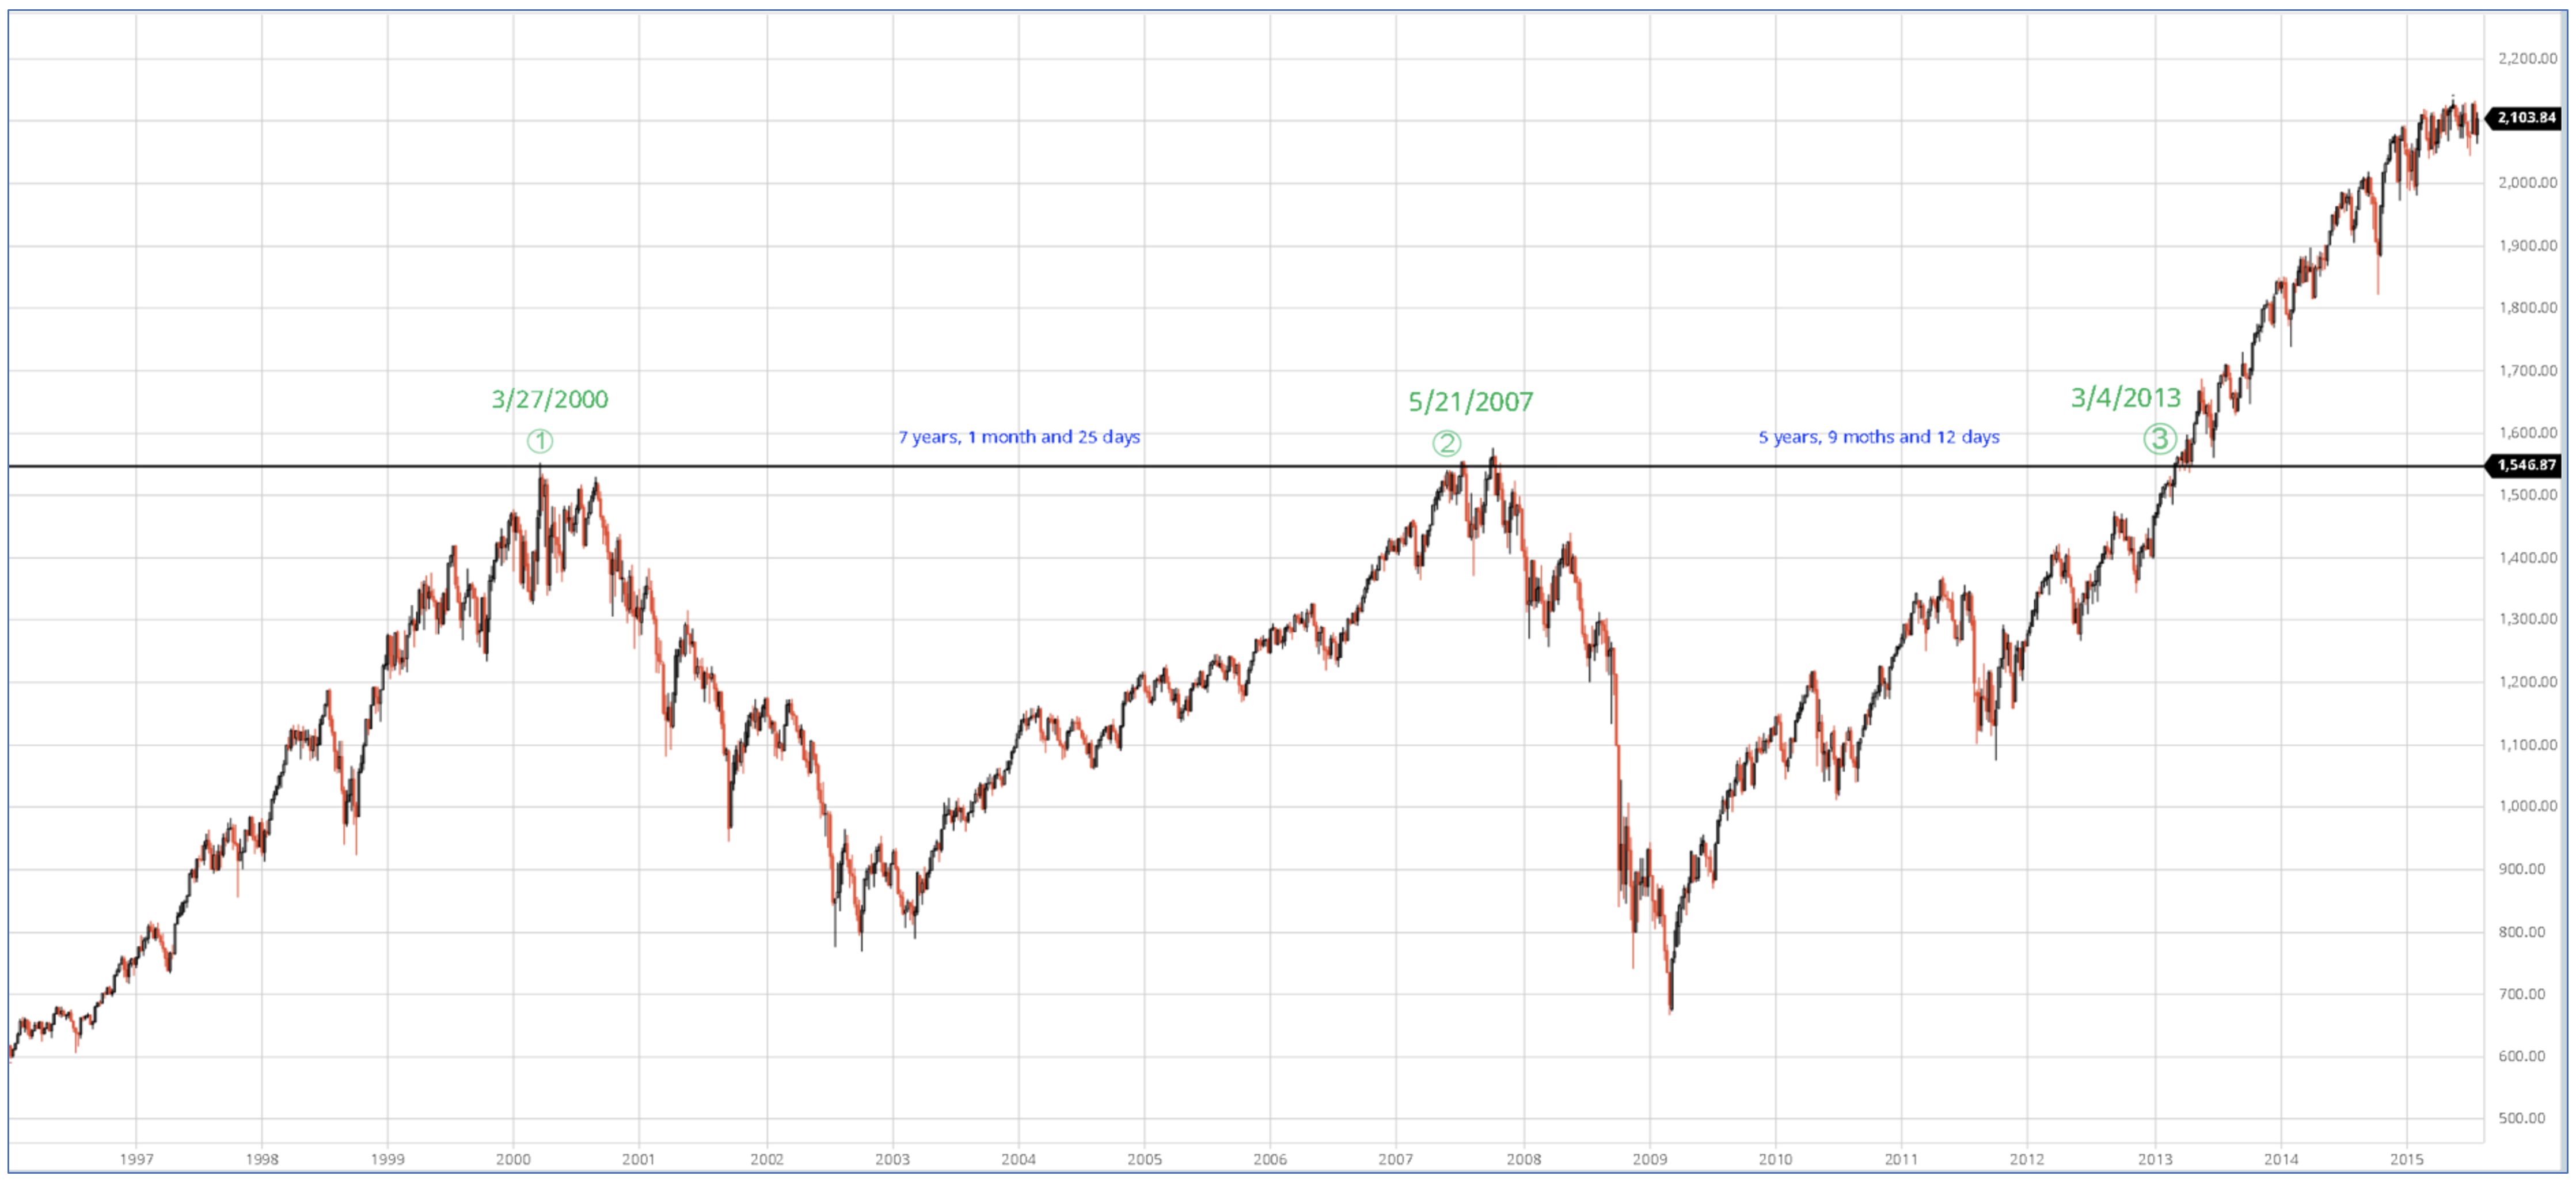
As seen in the chart below, it took just over 7 years for the S&P 500 to get back to its March 27, 2000 high (from point (1) to point (2)). Just months after the market had recovered, the Great Financial Crisis began, and the market did not bottom out again until March of 2009. The S&P 500 did not fully recover until March 4, 2013 (point (3)). If you bought the S&P 500 on March 27, 2000, you had a very brief amount of time in 2007 to get out even, or you had to wait until March 2013 to recoup your losses, just under 13 years after the dot com peak![xii] “Do you have enough time?” was the title of a recent Asset Management Insight.
Source: barchart.com
During the dot com bubble in 1999 to 2000, many investors believed that traditional valuation metrics such as price to earnings and price to sales no longer mattered. “This time is different” was a phrase often used. During the pre-Great Financial Crisis housing bubble many believed again, “this time is different”, no money down mortgages and other financial innovations would forever change the way assets were valued, and residential real estate has never gone down on a country-wide basis. Ultimately, traditional valuation methods won out and both bubbles burst.
History has taught us to be very careful. We continue to stay the course of risk balanced investing – take enough risk to reach your goals but not much more. We remain focused on striking the right aggressiveness versus defensiveness in client portfolios given the evolving uncertainty in the markets and the economy.


