In our October 2023 CIG Asset Management Update: Year-to-Date U.S. Stock Performance in Pictures, we discussed our theme of Clean Transition Investing as a possible alternative way to participate in the stock market without chasing the Magnificent 7 stocks. [i] This theme focuses on the 2015 Paris Agreement, which outlined the long-term goal of reaching net zero emissions by the year 2050. However, global spending fell short in 2023, reaching an estimated $1.8 trillion out of the necessary $5 trillion annually. [ii]
We initially bought First Trust RBA American Industrial Renaissance ETF (AIRR) to participate in Clean Transition Investing for our CIG Dynamic Growth Strategy and CIG Dynamic Balanced Strategy in September 2023. We then added more AIRR in December 2023. Most recently, we added an additional investment in the Global X U.S. Infrastructure Development ETF (PAVE). How are these investments doing?
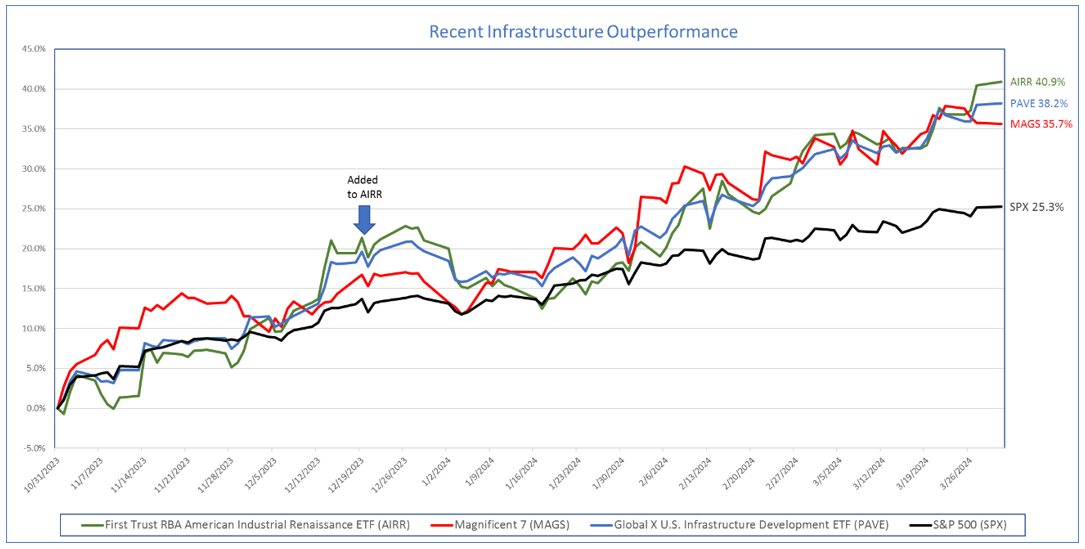
As seen in the chart below these infrastructure investments, (AIRR) and (PAVE) outperformed the Magnificent 7 stocks (MAGS) and the S&P 500 (SPX) for the period October 31, 2023, through March 31, 2024.[iii]

Data from Barchart.com for the period 10/31/2023 to 3/31/2024
Past performance is not indicative of and not a guarantee of future results, but we are encouraged that it it may be possible to enjoy positive market outperformance without chasing the Magnificent 7 stocks which, in our opinion, are in a bubble.
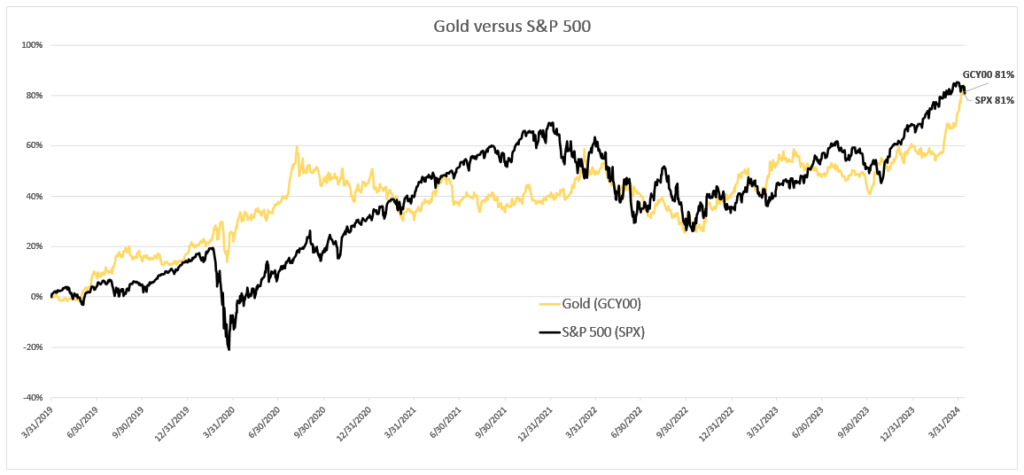
Moving on to another asset class, as of April 19, 2024, Gold futures closed at an all-time high of $2,398.40 / ounce on the COMEX exchange. [iv]As illustrated in the chart below, for the period March 31, 2019, to April 12, 2024 – just over five years – Gold, (symbol GCY00) has captured 100% of the S&P 500’s return! [v]

Data from Barchart.com for the period 3/31/2019 to 4/12/2024
Perhaps more impressively, from the peak of the dot-com boom in March 2000 through April 10, 2024, The S&P 500 has gained +244%, but Gold gained +738% – triple the return! [vi] Gold and miners continue to be a part of many of our client’s managed portfolios.
Why has Gold enjoyed such a stellar performance?
According to the latest budget update from the Congressional Budget Office (CBO), the U.S. government ran a staggering budget deficit of $1.7 trillion in fiscal year 2023. This deficit represents 6.3% of the country’s gross domestic product (GDP), significantly surpassing the 3.7% average observed over the past 50 years. Notably, excluding the Great Financial Crisis and the COVID-19 pandemic, this deficit-to-GDP ratio is the highest since World War II. [vii]
In 2023, the government’s net interest costs reached a staggering $659 billion, marking an 87% increase compared to the amount in 2021. [viii] The CBO’s latest projections also raise concerns: total U.S. federal government debt is projected to climb from 97% of GDP last year to 116% by 2034—surpassing the debt levels seen during World War II. Bloomberg Economics conducted extensive simulations to assess the fragility of the debt outlook. Alarmingly, in 88% of these simulations, the results indicate that the debt-to-GDP ratio is on an unsustainable trajectory, signifying an increase over the next decade.[ix] These unwieldly debt obligations and large budget deficits could potentially weaken the U.S. dollar relative to other currencies.
The weaponization of the U.S. dollar became evident following Russia’s invasion of Ukraine, leading to unprecedented financial repercussions for Putin’s regime. World leaders are now actively reducing their reliance on the U.S. dollar.[x]
On April 8, 2024, U.S. Treasury Secretary Janet Yellen issued a stern warning in Beijing: “Banks facilitating significant transactions related to Russia’s defense industry risk U.S. sanctions.”[xi] Russia’s Foreign Minister Sergey Lavrov met in Beijing to counter mounting pressure from the U.S. and its allies.[xii] Simultaneously, central banks worldwide are diversifying away from U.S. dollar reserves. They’ve been accumulating gold reserves at an astonishing pace—over a thousand tons in 2022 and 2023.[xiii] As other countries grow wary of holding U.S. assets due to potential reprisals, gold emerges as an increasingly attractive investment. The question remains: How will the United States manage its debt if global confidence in dollar-based assets wanes? Of note, as the dollar weakens, investments outside of the U.S. become more attractive to investors. At CIG, we are keenly focused on exploring international investment opportunities to capitalize on this trend.
America’s debt-to-GDP ratio is regaining the heights last seen post WWII. Past periods of sacrifice tended to be followed by burden-sharing and higher taxes. In 1932, as the Great Depression raged, America’s top marginal tax rate rose to 63% and continued higher through 1944 when it hit 94% on incomes over $200,000 (equivalent to $2.9mm in today’s dollars). The post-war economy boomed as America rebuilt the world. The top marginal rate remained above 90% until 1964 when we lowered it to 70%. [xiv] But today, we’re unsure whether we’ll make similar choices to raise taxes and share the burden. Nor do we know the societal consequences that come from refusing to equitably share our burdens.
In light of current conditions, our investment strategy remains nimble. We are encouraged by the recent performance of our new infrastructure investments. Equally noteworthy is our commitment to gold as a long-term asset, which has yielded productive results. The recent surge in gold prices, reaching an all-time high, underscores its resilience and attractiveness over the past five years-mirroring its performance since the Dot Com bust.
As we navigate the financial landscape, we maintain a cautious optimism, leveraging our insights and strategic positioning to potentially capitalize on opportunities while attempting to prudently manage risks. Our commitment to making prudent investment choices continues to drive results for out clients.
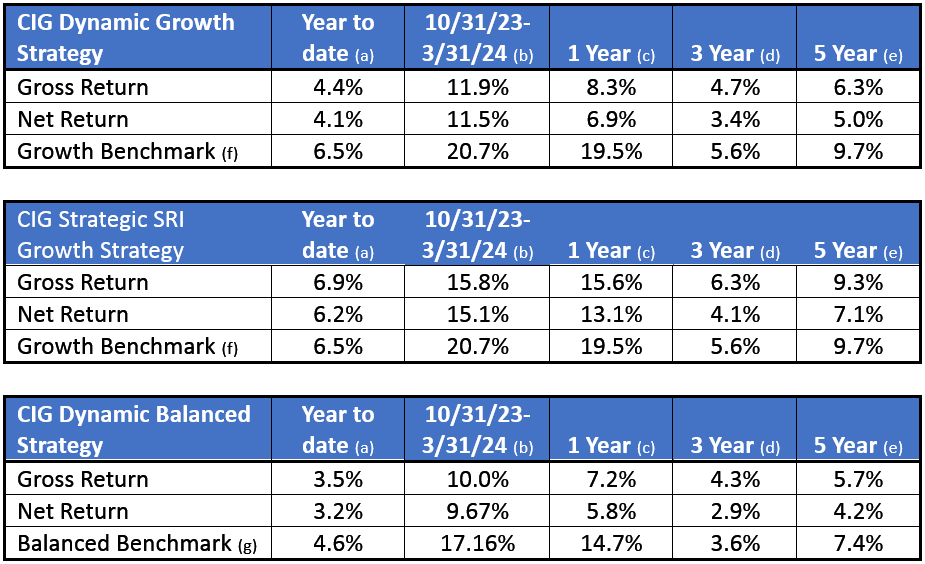
Strategy Returns as of 3/31/2024:

Performance has been attested to by ACA Group for the period August 1, 2018, through December 31, 2022.
Strategy returns are calculated independently on a daily basis and linked geometrically to produce a monthly return. Total investment performance includes realized and unrealized gains and losses, dividends, and interest. Accrual accounting is used to record interest income while dividends are recorded on a cash basis. Trade date accounting is used for calculation and valuation purposes.
Past performance is not indicative of future results.
(a) Represents performance from January 1, 2024, through March 31, 2024.
(b) Represents performance from October 31, 2023, through March 31, 2024.
(c) Represents performance from April 1, 2023, through March 31, 2024.
(d) Represents annualized performance from April 1, 2021, through March 31, 2024.
(e) Represents annualized performance from April 1, 2019, through March 31, 2024.
(f) The Growth Benchmark is a blend of 60% Russell 3000, 25% MSCI All-Country World ex US and 15% Bloomberg US Aggregate Bond indices.
(g) The Balanced Benchmark is a blend of 45% Russell 3000, 10% MSCI All-Country World ex US and 45% Bloomberg US Aggregate Bond indices.
[i] The ”Magnificent 7” stocks are Apple (AAPL), Microsoft (MSFT), Nvidia (NVDA), Alphabet (GOOG), Meta Platforms (META), Amazon (AMZN) and Tesla (TSLA). https://www.nasdaq.com/articles/the-easiest-way-to-remember-the-magnificent-7-stocks-and-why-you-should-care
[ii] GlobalX – Why Should You Consider Investing in U.S. Infrastructure Development?
[iii] Calculated by CIG Asset Management for using data from Barchart.com for the period 10/31/2023 to 3/31/2024
[iv] Data from finance.yahoo.com
[v] Calculated by CIG Asset Management for using data from Barchart.com for the period 3/31/2019 to 4/12/2024
[vi] Calculated by CIG Asset Management for using data from Barchart.com for the period 3/31/2000 to 4/12/2024
[vii] Data from https://www.cbo.gov/publication/60053 https://fred.stlouisfed.org/series/FYFSDFYGDP
[viii] Data from https://www.cbo.gov/publication/60053 https://fred.stlouisfed.org/series/FYFSDFYGDP
[ix] https://www.fastbull.com/news-detail/a-million-simulations-one-verdict-for-us-economy-3825714_0
[x] https://www.bloomberg.com/news/articles/2023-06-02/putin-s-war-ignites-backlash-against-dollar-across-the-world
[xi] https://www.bloomberg.com/news/articles/2024-04-08/yellen-threatens-sanctions-for-china-banks-that-aid-russia-s-war
[xii] https://www.nytimes.com/2024/04/09/world/asia/xi-lavrov-russia-china.html
[xiii] The High-Tech Strategist April 2, 2024
[xiv] Data from https://taxfoundation.org/data/all/federal/historical-income-tax-rates-brackets/


