
Update From CIG Asset Management: Time to Reconsider Regret
When you or your advisor make changes to your investment portfolio, it’s natural to feel regret. When you buy investments, there’s always a chance you’ll regret it later. More importantly, if you sell some of your investments and the market keeps rising, you might regret selling too soon—especially if you must pay taxes on the gains. On the other hand, if you sell and the market drops dramatically, you may regret not selling more.
In 2021, we discussed the concept of regret [i], and it turned out to be an important moment for many of our clients. By making timely adjustments to their portfolios, in 2022 our CIG Dynamic Growth Strategy avoided 60% of the growth benchmark’s -17.3% loss and our CIG Dynamic Balanced Strategy avoided 65% of the balanced benchmark’s -15.8% loss. [ii] Here’s what we highlighted:
“It is so easy at this stage, to miss the disconnect between the real-world economy and the stock market and be tempted to chase stock valuations that as a whole are trading near all-time highs based on many historical measures. One could follow narratives like, “stocks only go up over the long term” while listening to CNBC and ever bullish Wall Street strategists and act against your best interest.” [iii]
Today, we’re witnessing and hearing about a continuous stream of almost daily market records, based on the extreme concentration in the passive indices. Meanwhile, Wall Street strategists emphasize that survival in the evolving business landscape very well may hinge on embracing AI-driven innovations. [iv]
If you invest based on this information, your maximum regret may be missing out on the current surge in these markets.
Our perspective diverges from the consensus. The economic landscape remains challenging for everyday consumers. During the COVID crisis, consumers saved more money than usual. However, the Federal Reserve now reports that these “excess savings” have been fully spent. [v] Consumers drive nearly two-thirds of the U.S. economy. Unfortunately, many are financially strained – credit card delinquencies are at their highest level in over a decade and auto loan delinquencies are also soaring. [vi] No surprise – May retail sales were weaker than expected. When adjusted for inflation, they’ve been negative year-over-year throughout 2024. [vii]
While Wall Street remains bullish on AI, some companies are taking a different stance. Lucidworks, in a survey of over 2,500 business leaders, found that only 63% of companies surveyed plan to increase AI spending versus 93% in 2023. [viii] AI investments, once hyped as the next big thing, are now facing company scrutiny. AI’s trajectory resembles that of the Internet in 2000. Back then, the Internet was a long-term success story, but many companies struggled to turn it into a profitable investment. We wonder if Nvidia – whose sales of its advanced AI platform is driving enormous sales growth and its market capitalization to over $3 trillion [ix] – will suffer the same fate as Cisco Systems. Cisco’s routers were an integral part of connecting to the internet in the late 1990s. While Cisco soared to great heights during the dot-com boom, its long-term stock chart reveals that it lost 87% of its March 2000 value when the bubble burst and it has never fully recovered to those highs. [x]
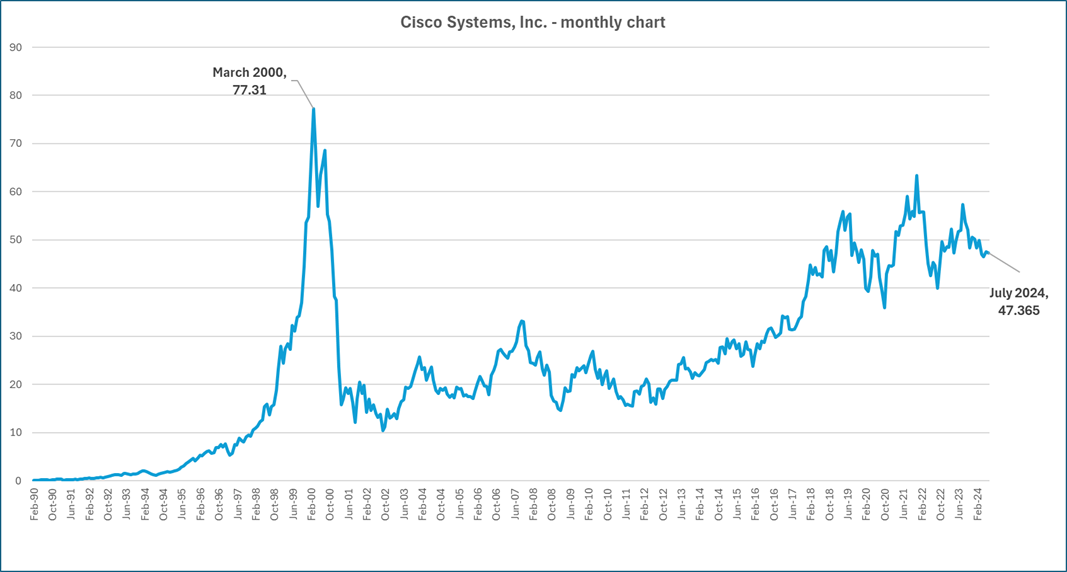
Chart by CIG Asset Management using data from Barchart.com
Given the current market conditions—where we see extreme valuations, unusual market indicators, and daily anomalies abound—we’ve increased our vigilance and are adjusting as needed. Our primary goal is to align risk with our clients’ financial plan targets. We’re cautious, and strive to avoid unnecessary risks. We don’t want to fight against the Federal Reserve or make hasty judgments. The Federal Reserve plays a significant role in stabilizing the economy. However, recent poorly received Treasury auctions raise questions about its effectiveness in a market slump this time.
If you invest and ignore this information, and stocks fall, your maximum regret could be not being able to retire, donate or spend when you choose or create your desired legacy.
Balancing risk and reward is at the heart of successful investing. Our primary goal is safeguarding our clients’ financial health. We achieve this by maintaining both intellectual and emotional distance. Drawing from game theory, we consider “mini-max regret” to guide our decisions. This means minimizing the maximum potential regret while pursuing client goals. Since 2020, we’ve emphasized that the journey matters as much as the destination. Even during speculative peaks, immediate significant market losses aren’t guaranteed. Historical examples reveal that markets can recover and even surpass previous highs for a time.
Given the inevitable twists and turns, we don’t attempt to make crystal ball forecasts; instead, we observe and endeavor to adapt. Flexibility is our compass in ever-changing market conditions. If you’re a passive or do-it-yourself investor, you may want to brace yourself for potential portfolio roller coasters. Wild market swings can lead to substantial losses of greater than 25%. History reminds us that the S&P 500 can lag Treasury bill returns for a decade or more. [xi] Regardless of your investment style, we suggest you analyze your risk exposure carefully and understand your maximum regret threshold.
We continue to believe that there are other ways to potentially make money in the stock market outside of the Magnificent 7 stocks. On July 11, 2024, the June CPI release showed inflation fell -0.1% – the first month to month drop since May 2020. [xii] On this same day, the Magnificent 7 stocks, as measured by the Roundhill Magnificent Seven ETF (MAGS), fell -4.5%. The Russell 2000 small-cap index, which year-to-date was only up +1.2% the day before, gained +3.6%! Three of our clean transition investments which we own in our dynamic growth and dynamic balanced strategies – all gained over +2.0% on this day. [xiii] The small-cap outperformance on July 11 was historical. The Russell 2000 ETF (IWM) outperformed the S&P 500 ETF (SPY) by 4.5% – the second largest outperformance on record. The only day that saw larger small-cap outperformance was October 10, 2008, in the throes of the Great Financial Crisis and right before the Fed’s Quantitative Easing program began. [xiv] One day does not make a trend, but we are encouraged that market participation may broaden out to investments outside of the Magnificent 7.
Now, more than ever, having a professional fiduciary by your side is crucial. If you would like to explore ways to safeguard your financial interests during this wild ride, please contact Brian Lasher (blasher@cigcapitaladvisors.com) or Eric T. Pratt (epratt@cigcapitaladvisors.com).
[i] CIG Asset Management Review: Outlook 2021
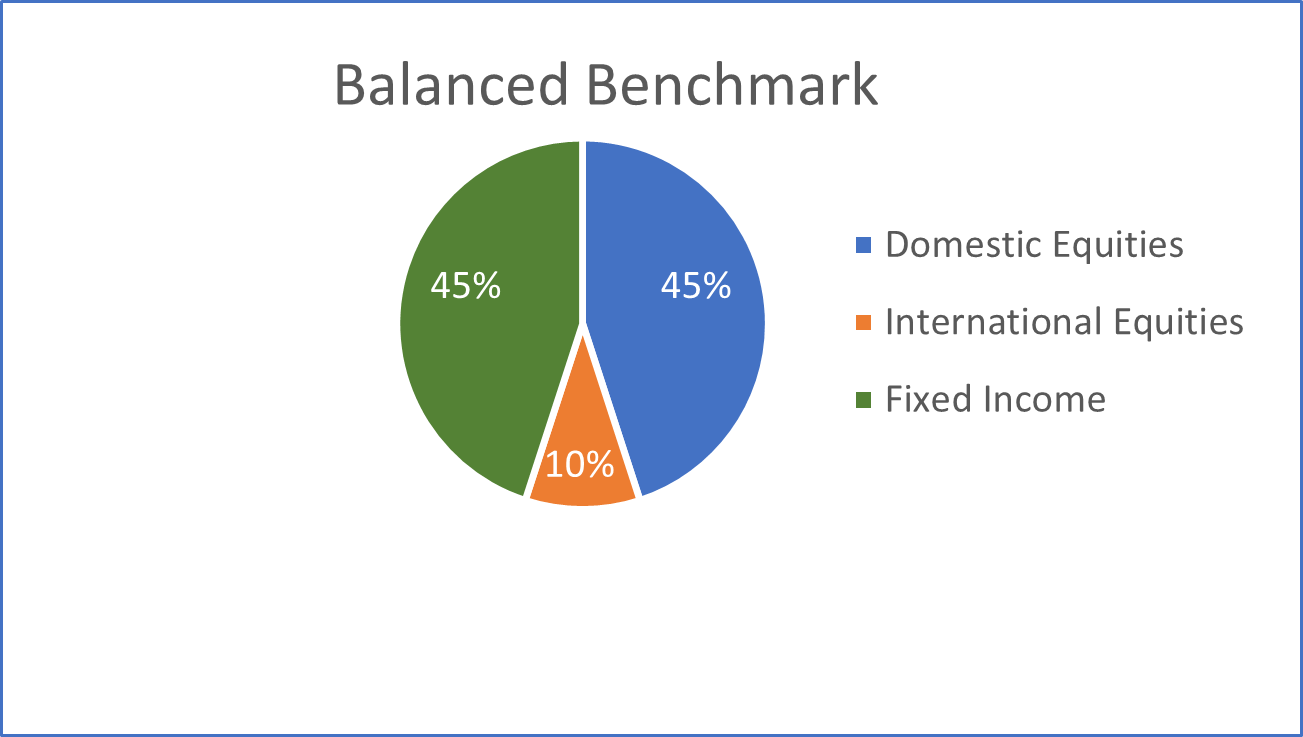
[ii] Figures calculated based on CIG Composite returns. Full composite returns are available upon request. Performance has been attested to by ACA Group for the period August 1, 2018, through December 31, 2022. Strategy returns are calculated independently on a daily basis and linked geometrically to produce a monthly return. Total investment performance includes realized and unrealized gains and losses, dividends, and interest. Accrual accounting is used to record interest income while dividends are recorded on a cash basis. Trade date accounting is used for calculation and valuation purposes. Past performance is not indicative of future results.) The Growth Benchmark is a blend of 60% Russell 3000, 25% MSCI All-Country World ex US and 15% Bloomberg US Aggregate Bond indices. The Balanced Benchmark is a blend of 45% Russell 3000, 10% MSCI All-Country World ex US and 45% Bloomberg US Aggregate Bond indices.
[iii] https://cigcapitaladvisors.com/cig-asset-management-review-outlook-2021/
[iv] Merrill Lynch report: Artificial intelligence: The next great tech wave?
[v] Federal Reserve Bank of San Francisco: Pandemic Savings Are Gone: What’s Next for U.S. Consumers? May 3, 2024
[vi] Federal Reserve Bank of New York: Household Debt and Credit Report. Q1 2024.
[vii] https://www.advisorperspectives.com/dshort/updates/2024/06/18/the-big-four-recession-indicators-real-retail-sales-up-0-1-in-may
[viii] https://lucidworks.com/ebooks/2024-ai-benchmark-survey/
[ix] Nvidia market capitalization as of July 15, 2024 – finance.yahoo.com
[x] Calculated by CIG Asset Management using data from Barchart.com
[xi] Hussman Market Comment – “Cluster of Woe” February 2024
[xii] John Hancock weekly market recap 7/12/2024.
[xiii] Calculated by CIG Asset Management using data from finance.yahoo.com
[xiv] https://bilello.blog/2024/the-great-reversal-chart-of-the-day-7-11-24

Update from CIG Asset Management – What’s Your Benchmark?
Do you compare your investment portfolio’s performance to a popular stock that you hear about on CNBC?
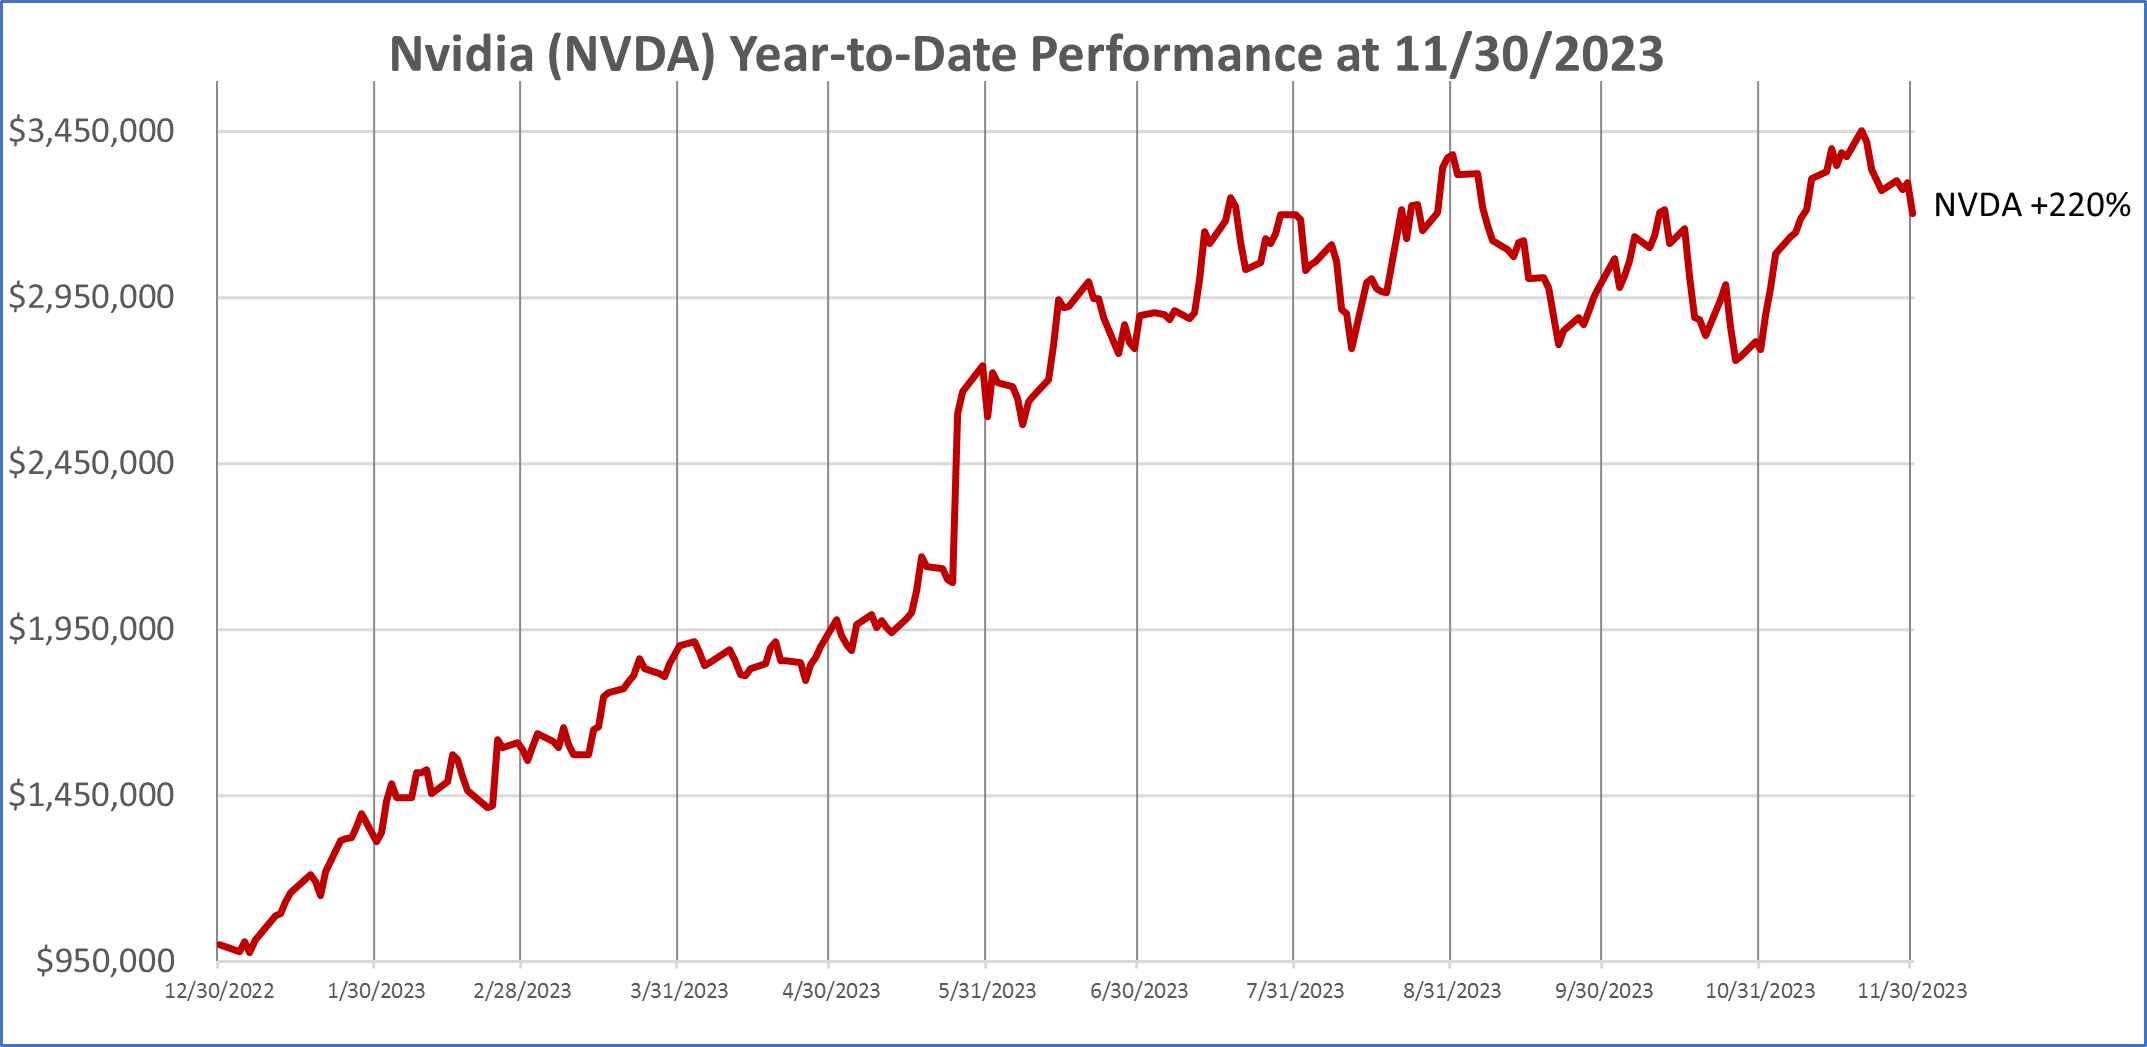
This is the daily chart for Nvidia, a single stock that soared +220% year-to-date through November 30, 2023. [i]
Maybe you compare your portfolio to the S&P 500.
Year-to-date through November 30, 2023, the S&P 500, represented by the SPDR S&P 500 ETF (SPY), is up +20.7%. [ii] It might be appropriate to use the S&P 500 as your benchmark if you invest all your money in large and mid-sized companies that are domiciled in the United States. However, if you are using an important tool like many investors in managing investment risk – diversification – that is, spreading your investments among and within different asset classes, then comparing your performance to the S&P 500 is likely to leave you disappointed.
This year, that disappointment is likely to be WORSE because as we discussed last month in Year-to-Date U.S. Stock Performance in Pictures, the S&P 500 performance thus far this year had been dominated by just 7 stocks – the Magnificent 7 – which Torsten Slok, Chief Economist at Apollo Asset Management said were becoming more and more overvalued and, in our view, more dangerous to invest in. [iii] Are we headed toward a big loss like post the year 2000, when the dot com stocks fell and the S&P 500 had fallen -49% from its peak on March 27, 2000, to its low On October 9, 2022? [iv]
At CIG, we believe in the adage, “Don’t put all your eggs in one basket”. We employ active asset allocation to employ varying levels of exposure to various sectors of domestic and international stocks, fixed income, and alternatives, such as gold and commodities, in an attempt to manage risk throughout market cycles.
How do we compare our strategies’ performance?
At CIG, we utilize benchmarks that are invested in a blend of three major asset classes- domestic equities, international equities, and fixed income.
- Domestic equities are represented by the Russell 3000 Index, a market capitalization-weighted index which measures the performance of the 3,000 largest U.S. companies and representing approximately 96% of the investible U.S. equity market. [v]
- International equities are represented by the MSCI ACWI ex USA Index, an index covering approximately 85% of the global equity opportunity set outside of the United States. [vi]
- Fixed income is represented by the Bloomberg U.S. Aggregate Index, an index composed of investment-grade government and corporate bonds. [vii]
The pie chart below illustrates the weightings of the three major asset classes in our balanced benchmark. We compare the performance of our clients whom we generally describe as balanced investors to the performance of this balanced benchmark.
In the following bar chart, we compare year-to-date performance of the components of our balanced benchmark to the S&P 500 and Equal-Weighted S&P 500 as of November 30, 2023.

Year-to-date, the Russell 3000 – the domestic equity index we use in our benchmarks – gained +17.8%. The Russell 3000 has a similar issue to Magnificent 7 stock dominance, with 24% of the index invested in these seven stocks but not to the same extent as the S&P 500, with 28%. [viii] Over the same period, the MSCI ACWI ex USA index (ACWX) gained +10.1%, less than half of the S&P 500, and the Bloomberg U.S. Aggregate Index (AGG) was only up +1.9%. [ix] This year, if you employed diversification – spreading your investments among and within different asset classes in the chart above instead of only investing in the S&P 500, you clearly experienced lower returns than the S&P 500.
Now that we have told you about our balanced benchmark, what is the appropriate period to assess how one has done versus the benchmarks? Should you look at it every day? How should we be looking at returns and the amount of risk you are taking?
We prefer to look at returns and risk over a trailing 3-year period. We measure risk using the standard deviation of returns. The CIG Dynamic Balanced Composite trailing 3-Year annualized return as of November 30, 2023, is +2.30%, net of fees, and the 3-year standard deviation is 6.6%. [x] The Balanced Benchmark’s trailing 3-year annualized return as of November 30, 2023, is +1.95% and the 3-year standard deviation is 14.2%. [xi]
You can see in the chart below that the CIG Dynamic Balanced Composite is taking less than half (46%) of the risk, as measured by the standard deviation of annualized three year returns, of the balanced benchmark [xii] and is returning 118% of the balanced benchmark’s return on a trailing 3-year annualized basis. [xiii]

At CIG, we believe in risk-balanced investing. We believe investors should consider how much risk they are taking to achieve returns. We think that we should be striving to reach the return necessary to meet the various needs of our client’s financial plans while, at this point in the market cycle, taking as little risk as possible to meet that goal. We want you to sleep at night.
Speaking of risk, let’s go back to the first chart on page one, Nvidia (NVDA). Nvidia has experienced many booms and busts over the years. The stock is currently booming, up +220% year-to-date through November 30, 2023, due to surging sales of its artificial intelligence chip. [xiv] As of December 31st, 2023, we own a small amount of Nvidia in our dynamic and strategic balanced and growth models [xv] via our iShares Semiconductor ETF SOXX holding.
We are very cautious regarding NVDA, the company has experienced two large losses in the past five years. In the fourth quarter of 2018, NVDA stock suffered a -56% drawdown in 82 days [xvi] due to the company warning about excess inventory of graphic chips for gaming. [xvii] In 2022, NVDA stock suffered a -66% drawdown in 329 days [xviii] as cancelled orders from personal computer makers and weakness in crypto mining orders negatively impacted sales and earnings. [xix]
So, what is your benchmark, an individual stock like Nvidia that fell -66% in 329 days in 2022, or an index like the S&P 500 that fell -49% from its peak on March 27, 2000, to its low On October 9, 2022?
We counsel investors to understand what they are invested in – typically a diversified portfolio – and measure their results with the appropriate diversified, blended benchmark. Life is too short to be frustrated.
If you are not a client, we are happy to review how much risk that you are taking to achieve your returns. Please reach out to Brian Lasher (blasher@cigcapitaladvisors.com), Eric T. Pratt (epratt@cigcapitaladvisors.com) or the rest of the CIG team.
This report was prepared by CIG Asset Management and reflects the current opinion of the authors. It is based upon sources and data believed to be accurate and reliable. Opinions and forward-looking statements expressed are subject to change without notice. This information does not constitute a solicitation or an offer to buy or sell any security.
[i] calculated by CIG using data from finance.yahoo.com
[ii] Calculated by CIG Asset Management using data from finance.yahoo.com
[iii] The Daily Spark, published by Apollo 10/18/2023
[iv] Calculated by CIG Asset Management using data from finance.yahoo.com
[v] https://www.lseg.com/en/ftse-russell/indices/russell-us
[vi] https://www.msci.com/documents/10199/86494e1f-914e-4aa5-82a9-2e29ed5adbbf
[vii] https://www.investopedia.com/terms/l/lehmanaggregatebondindex.asp
[viii] The Magnificent 7 is a term coined by Bank of America analyst Michael Hartnett. The seven stocks are Alphabet, Amazon, Apple, Meta Platforms, Microsoft, Nvidia and Tesla. Calculated by CIG Asset Management as of 01/02/2024 using data from State Street Global Advisors and iShares. The S&P 500 index is represented by the SPDR S&P 500 Trust and the Russell 3000 index is represented by the iShares Russell 3000 ETF.
[ix] Calculated by CIG Asset Management using data from finance.yahoo.com
[x] Calculated by CIG Asset Management using data from Zephyr and Tamarac.
[xi] Calculated by CIG Asset Management using data from Tamarac and Zephyr
[xii] The Balanced Benchmark is a blend of 45% Russell 3000, 10% MSCI All-Country World ex US and 45% Bloomberg US Aggregate Bond indices.
[xiii] Calculated by CIG Asset Management using data from Zephyr and Tamarac
[xiv] CFRA research report dated December 8, 2023.
[xv] CIG Dynamic Growth Strategy, CIG Dynamic Balanced Strategy, CIG Strategic Growth Strategy, CIG Strategic Balanced Strategy.
[xvi] Calculated by CIG Asset Management using data from barchart.com
[xvii] https://www.cnbc.com/2018/11/16/nvidia-stock-falls-on-revenue-and-guidance-miss.html
[xviii] Calculated by CIG Asset Management using data from barchart.com
[xix] https://finance.yahoo.com/news/nvidia-stock-dropped-11-rough-231731668.html
agreement
Image: Canva

Safeguarding Your Wealth with Proper Asset Protection Planning
Protecting accumulated wealth should be a cornerstone of your financial plan. A solid financial plan will address who or what poses the threat of taking away what you have earned and puts measures in place to limit the severity of those threats. These threats are often unseen and not easily predictable and therefore may cause a derailment from the path to your goals if your plan is not properly structured. Do you understand what your plan has put in place for asset protection?
Risk Management
It is not easy to think about, but just imagine that today was your last day alive. Who will be there tomorrow to protect your family and the assets you leave behind? Who will replace the high amount of income that you provide? Will your current savings be enough to provide for the day-to-day basics, let alone the big expenses of the future such as college tuition? Proper planning aims to assess the capital needs of an individual and his or her family to ensure that given any unfortunate event, the family will be taken care of first. A less often considered, but nonetheless important, scenario is disability due to injury or sickness. Will you still be able to pay your mortgage, car loan or other payments? What if this disability is for an extended period of time? You must, again, ask what your financial plan has in place for the future of your family and goals.
Personal and Business Liabilities
For physicians and other highly visible professionals, the possibility of becoming the defendant in a lawsuit based on work performed or expertise given is not out of the question. How is your medical practice structured? Which of your personal assets will be exposed to liabilities? There are particular are strategies to help protect and separate your business assets from your personal assets (Domestic Asset Protection Trusts).
Estate Planning & Titling
Do your estate planning documents match your intentions? Your estate plan may be designed to leave assets to your children; however, if your accounts and assets are not titled properly, your children may not receive those assets as intended. For example, accounts titled as Joint Tenants with Rights of Survivorship, all assets will remain in the account under control of the surviving owner, regardless of the estate plan documents. It is critical that your account titling matches your estate plan documents to avoid unintended consequences.
Mistakes and Unforeseen Problems
Without proper planning, your accumulated wealth could be exposed to numerous risks. With proper planning, those risks can be mitigated. CIG Capital Advisors Wealth Management team can make sure your wealth plan accounts for unforeseen personal events (death, disability or lawsuit) as well as financial hazards that could jeopardize the assets you’ve built over a lifetime. It can take many years, often decades, of hard work to accumulate significant assets. Unfortunately, it can only take one event to erase your progress. Contact a CIG Capital Advisors professional to prepare for the unexpected.
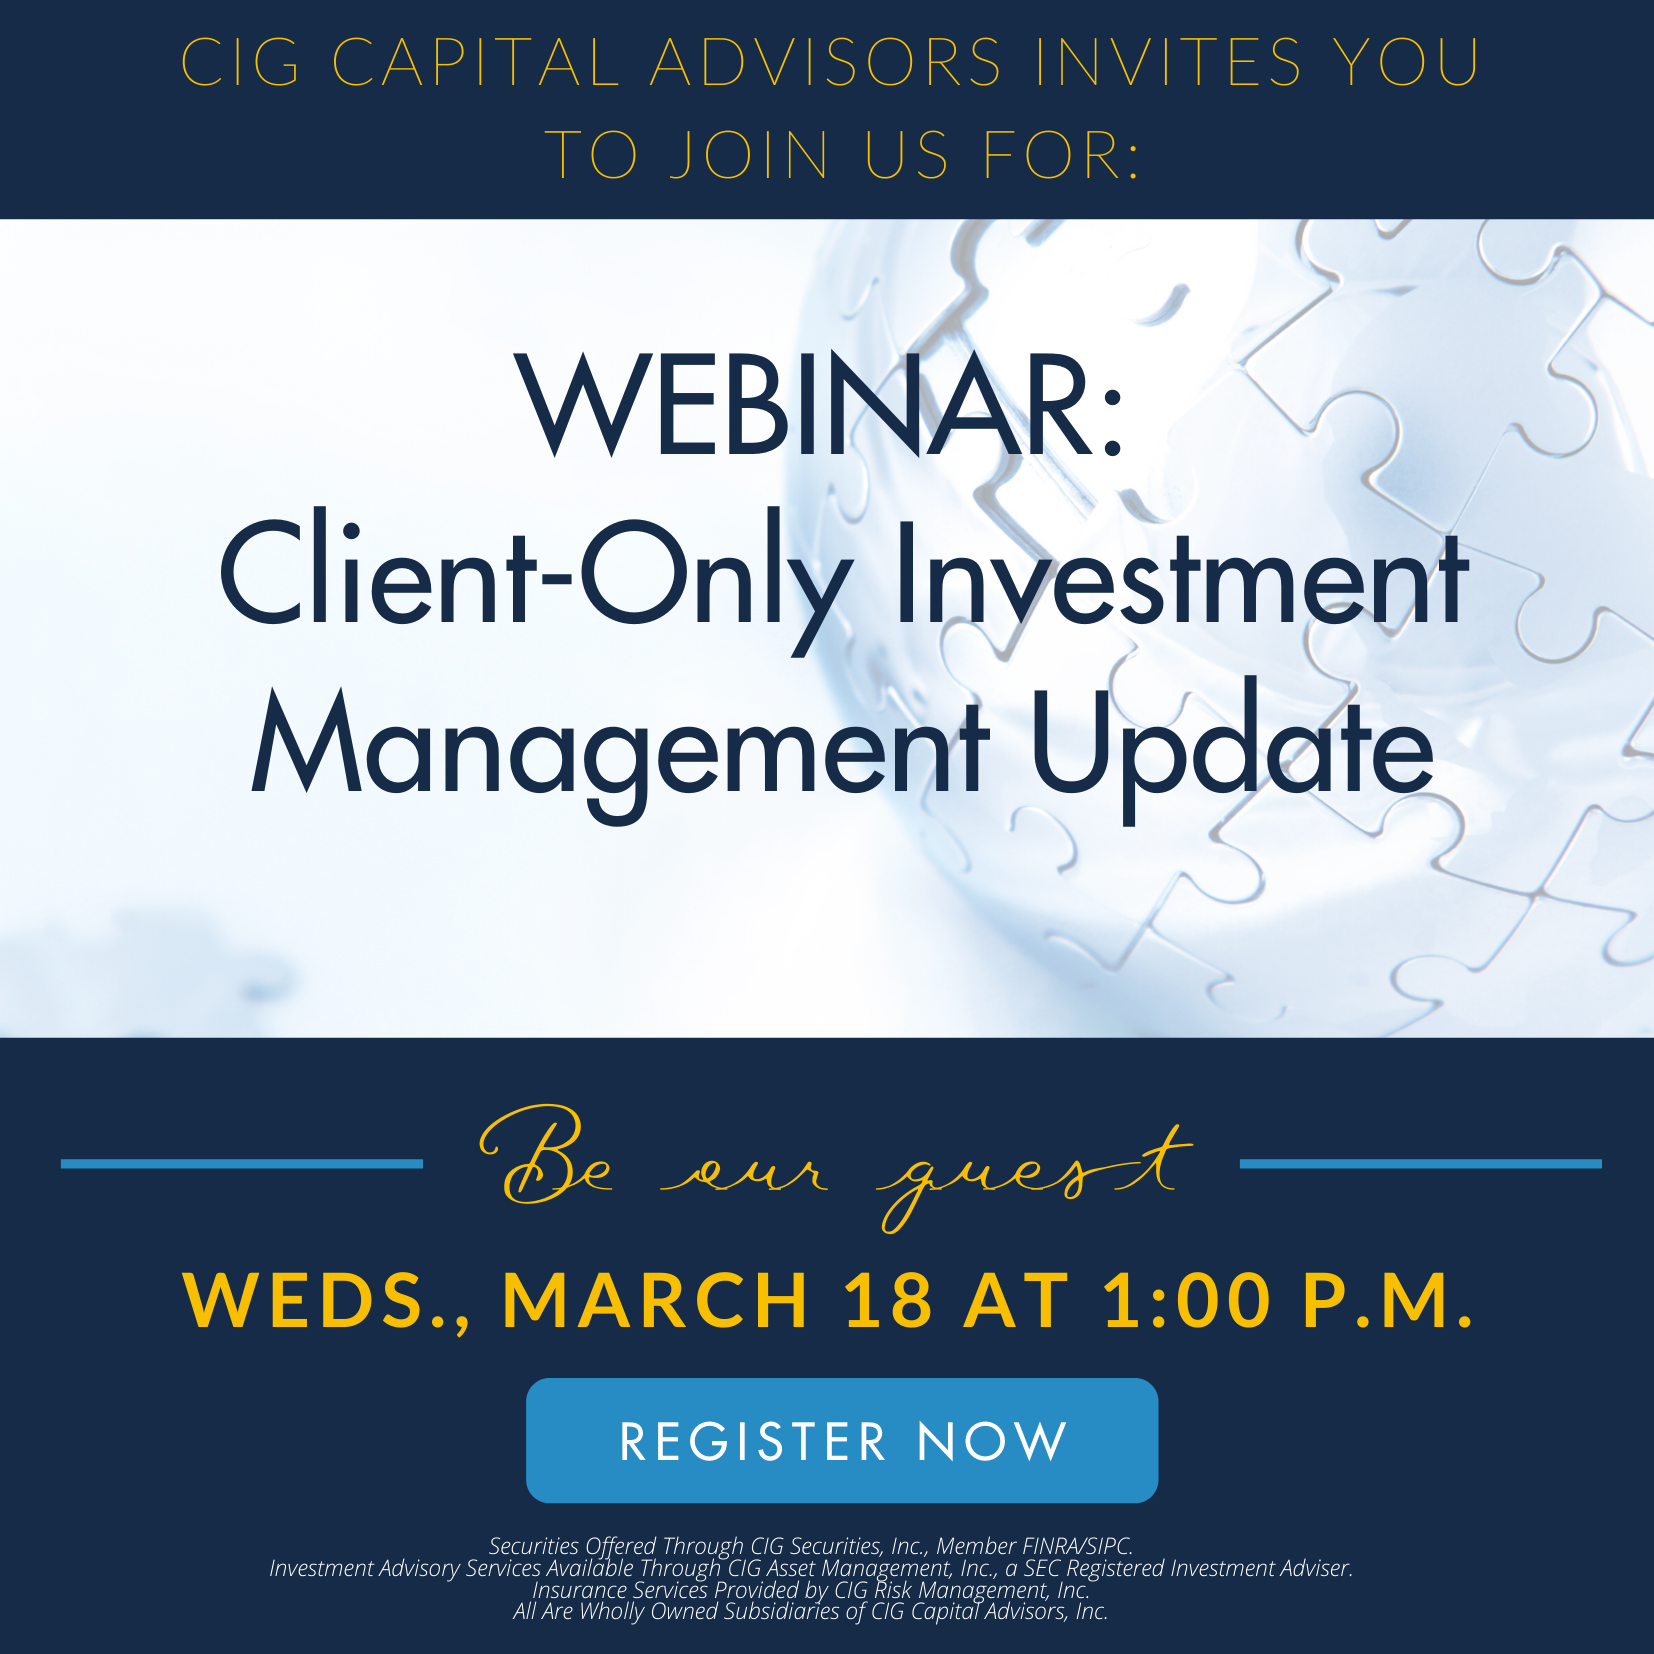
Important Client Announcement Related to COVID-19
| At CIG Capital Advisors, the health and safety of our clients, business partners and team is our first priority. Amid the growing concerns around COVID-19, we are taking substantial measures to ensure the welfare of our clients and employees is protected: Moving In-Person Meetings to Virtual Meetings: In an effort to minimize any potential exposure, we are taking the highest level of precaution and are strongly encouraging all client service meetings be conducted in a virtual format. Should you agree to change your in-person meeting to a virtual meeting via either our secure video conference system or telephone, please contact your CIG Capital Advisors senior wealth manager. Social Distancing and our Business Continuity Plan: The Centers for Disease Control and Prevention (CDC) recommends social distancing as a measure that can help prevent the spread of COVID-19. This could eventually extend to our office environment, so in an abundance of caution, CIG Capital Advisors will conduct a trial run of a full-staff remote work day on Tuesday, March 17. Should you need to contact a CIG Capital Advisors staff member on Tuesday, the usual channels of communication like email and phone will be available per our Business Continuity Plan. Our leadership team is monitoring the situation daily, taking into account guidance from the CDC, public health agencies and state officials. We will adapt our protocols as necessary and keep you apprised of all updates and changes. Investment Management: While health and wellness must be our priority, the financial health of your portfolio is a fiduciary responsibility we take seriously every day, no matter the macro-economic conditions. However, during times of economic instability like we have seen in recent weeks, it’s natural to seek information about how your asset manager is reacting amidst the turmoil. To discuss our prudent response to the uncertainty in the global markets, we’ve scheduled a special client-only webinar on Wednesday, March 18 at 1 p.m. The webinar will last approximately 30-45 minutes. All clients are invited to register for the webinar, hosted by CIG Capital Advisors Managing Principal Osman Minkara and Vice President of Asset Management Brian Lasher; you may also want to refer to our monthly Asset Management updates and recent 2019 Asset Management Year in Review letter, all of which were previously emailed to you and can also be found on our website here. REGISTER FOR THE WEBINAR HERE: https://zoom.us/webinar/register/WN_BSWP4BA_Q-yxk9J68wm2cA Please reach out to the CIG Capital Advisors team with any questions in the meantime, and we look forward to “seeing” you virtually in the webinar on Wednesday. |

CIG Asset Management Update February 2020: The Unknown Unknowns and Our Thoughts on COVID-19
| Market volatility spiked starting at the end of February and continues today at extreme levels. Long time readers of our updates know that we have been warning about asset bubble and Central Banks’ recent actions since last year. On March 3rd, The Federal Open Market Committee (FOMC) cut the federal funds rate by 0.5 percentage points to a 1 to 1.25% range. An emergency interest rate cut between regular meetings is very rare. The last such cut was during the Great Financial Crisis (GFC) in October 2008. In fact, there have only been 7 emergency actions since October 1998. Interestingly, the FOMC took this action after only a -8.2% decline in February for the S&P 500 Total Return Index(1). Similarly other markets around the world showed “orderly” selling – the MSCI EAFE Net index of Developed Markets was down only -9.0% while Emerging Markets, as measured by the MSCI Emerging Markets Net Index, lost only -5.3% during the month(2). How have stocks performed in the past after the FOMC cuts rates unexpectedly? The answer in the table below(3) is that they tend to go lower the following 12 months. The average one year return on the S&P 500 following an emergency cut is -7.3%. The October 15, 1998 emergency cut was in reaction to a hedge fund, Long Term Capital Management (LTCM), imploding. Excluding the LTCM cut, the average one year return after the other six actions was much worse, -12.5%. 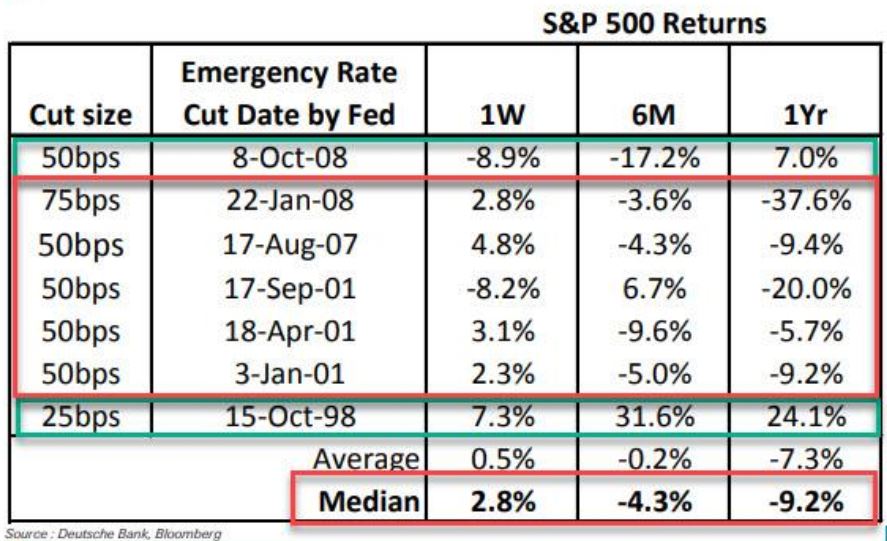 On February 20 and 21, FOMC speakers were cheerleading the market and saying that no rate cuts were necessary. We must ask ourselves, why did the Federal Reserve deem it necessary to act so suddenly? Ultimately, fears intensified over the new coronavirus (COVID-19) turning into a pandemic given that the number of new cases appearing outside of China were outpacing those within China, all this without adequate testing in many places. However, we remain skeptical that monetary policy can solve the global economic issues. Amazon, Google, Facebook and Microsoft are now pushing working from home(6). All, in addition to Apple, JP Morgan, Proctor & Gamble and others, have limited employee travel(6). Major events such as the St. Patrick’s Day Parade in Dublin have been cancelled, and forthcoming cancellations will be likely, too. Corporate management teams know that they will be forgiven if they lump as much bad news as possible into the first half of 2020 whether it is COVID-19-related or not. The bad news is likely to keep coming and the economic damage may be significant. It is possible that that Central Banks can regain control as Central Banks have managed to restrain volatility for the six previous times issues arose since the GFC. However, with the VIX at 60+, they appear to be more challenged than ever post-2008. Already, Treasury yields have reached record lows in February. Accordingly, the Barclays U.S. Long Treasury Index increased 6.7% during the month(4). Market participants are now anticipating three interest rate cuts to occur in 2020(5) and in March, Treasury yields have reached unprecedented low levels! The 30-year Treasury is below 1% as we write(1). In this high volatility environment, anything is possible and we are watching the markets and economy like a hawk. The CIG-managed portfolios have benefited from being positioned for late cycle volatility since October, with the Dynamic portfolios even more so since late February. There is massive risk to the downside as well as the upside. On the plus side, we may get a global fiscal stimulus package which would in turn boost markets. In that case, markets are very oversold, meaning assets that have traded lower/ gotten cheaper have the potential for a price bounce. On the other hand, the constant subsidy of the markets and the economy has led us to a large bond and stock market bubble and very high debt levels while the Federal Reserve has left themselves with way fewer tools. We have plans for both scenarios. CIG has a robust business continuity plan to lessen any interruption to service and allow us to remain fully operational at all times. We can accommodate a fully remote staff if necessary. We believe the communication procedures that we have in place will help ensure that there is no disruption to your service. We remain committed to meeting your expectations regarding meeting attendance and recognize that some clients may prefer conference calls or videoconferencing in lieu of in-person gatherings. Finally, we are persistently following the investment markets and repercussions of COVID-19 and will continue to communicate with you when appropriate about the portfolio impact and opportunities that are created. Until then, please stay well and support your friends and neighbors. The elderly who are deeply concerned now and neighbors without alternative childcare will need our help. As long as it is advisable, please visit your service vendors like restaurants and tip generously. We also ask that you generously give to local organizations who support the needs of lower-income families who might rely on travel, retail and hospitality sources of income. They will suffer disproportionately. Even if COVID-19 burns out in the coming months, as we hope it will, the economic issues could possibly linger for some time. This report was prepared by CIG Asset Management and reflects the current opinion of the authors. It is based upon sources and data believed to be accurate and reliable. Opinions and forward-looking statements expressed are subject to change without notice. This information does not constitute a solicitation or an offer to buy or sell any security. SOURCES: 1. Calculated from data obtained from Yahoo Finance, as of February 28, 2020. 2. MSCI, as of February 28, 2020 3. Deutsche Bank report using Bloomberg Data 4. NEPC 5. https://www.cmegroup.com/trading/interest-rates/countdown-to-fomc.html as of March 9, 2020. 6. https://www.businessinsider.com/companies-asking-employees-to-work-from-home-due-to-coronavirus-2020 |
CIG Asset Management Update January 2020: How Much to Dance?


| Meanwhile, the worsening of the coronavirus appears to have caused a plunge in bond yields in January as investors seek additional safe havens and the VIX Index(2) (the CBOE Volatility Index® which measures U.S. equity market volatility) has also risen. Consequently, we have acted in client portfolios to adjust to our perception of the ongoing exaggeration of the market environment that we talked about above and in the recent year-end letter (we highly encourage you to read it if you have not done so already.) Given these risks in the market, we continue to proceed with caution and feel that portfolio discipline remains paramount. While recessionary concerns remain low given the massive central bank stimulus around the globe, CIG’s outlook can rapidly adjust as a result of a material change in economic indicators or a dramatic shift in central bank policy. Accordingly, we ask ourselves, “How and how much do we want to dance with this market today?” |

The act of adding medical practice value through an administrator’s eyes
CIG Capital Advisors authored a recent article for Fierce Healthcare where we discuss how physician-owners can assess growth metrics in their medical practice and make adjustments that may affect the practice’s value with an eye toward a future sale:
“The act of adding medical practice value through an administrator’s eyes”
The average primary care physician sees more than 20 patients a day, according to a 2018 survey of nearly 9,000 doctors by the Physicians Foundation.
That, along with the 11 hours they devote every week, on average, to paperwork, helps explain why 78% of those same physicians told surveyors they feel burned out at least some of the time.
Oftentimes, this adds up to physicians being too busy with day-to-day responsibilities to have time left over for running the business end of their medical practice, let alone for crafting strategies to drive long-term practice growth, or to consider their legacy as they chart a course toward future retirement.
Ask most physicians about their hopes for the future and they might say that, of course, they want to grow their practice and increase revenue.
It’s one thing to set that as a goal. It’s quite another to determine how and what kind
of growth—and how much—will best suit a particular medical practice and its individual members.
Difficult as it may be, the reality is that growth won’t just result from hard work and hopes. Physicians who are truly serious about strategic growth or maximizing the practice’s value with an eye toward a future sale have
to invest in the process—possibly even setting aside an entire day or more for business building.
Either way, the process always begins with something already familiar to doctors: diagnostics.
Rather than X-rays or blood tests, doctors who want to grow their practice must begin with a panel of financial indicators: tax returns, productivity reports, an evaluation of their payer mix and more. It’s important to examine outlays, too. If a practice is spending more on equipment or staffing, or real estate, than peers of comparable size, bringing those expenditures in line with benchmarks may be the most effective treatment.
It also helps to examine the market. If your practice is in an area with an aging population, your approach to growth is oftentimes different than it would be in a location teeming with young families.
It sounds obvious, but just having the time to find those sorts of data may be well beyond the reach of the average overworked physician. That also explains why achieving growth by simply adding more patients isn’t practical.
This acknowledgment of limitations leads to questions about how best to grow. Is it more advantageous to acquire new locations and the physicians that come with them? Or does it better suit your goals to grow organically with more patients and a handpicked crop of new colleagues?
Finding colleagues who share your treatment philosophy and practice goals is vital, whether planning expansion or an exit strategy. As doctors well know, it’s not a given that those goals and philosophies will be shared. Culture fit is far more art than science, so while acquisitions or mergers may seem like an easy shortcut to growth and the added value that comes with it, they also require due diligence that goes well beyond spreadsheets.
For physicians who anticipate handing off their medical practice, the first step is also diagnostic, although in this case it is an honest valuation of the practice. This isn’t just a matter of placing a price tag on equipment or real estate, though that is part of it. Intangibles play a role, too: your reputation, and your practice’s reputation, have value as well.
For any medical practice contemplating a growth strategy, and for any physician planning a career exit, the most important thing to remember is that, just like patients, no two practices are identical. Consequently, there is no single prescription that will work for every practice.
And that is why a careful, individualized strategy is key to building and maintaining growth, whether for the purposes of seeing a practice through for the next two decades or for the next two years until a buyer arrives.
To schedule an initial complementary consultation to discuss how you can add value to your medical or dental pratice, email Brian Lasher.

Easing into Retirement
Given the physical and emotional demands of their profession, it’s little wonder that some physicians look forward to retirement. However, many other doctors nearing retirement age are reluctant to turn their backs completely on their profession and would rather find a way to ease into retirement.
What should you do if retirement is on the horizon but you would prefer to transition gradually into retirement by working part-time? Here are some things to consider if you are thinking of cutting back on your work hours:
1. Review Your Finances
First off, determine if you can afford the reduction in earnings that reducing your work hours will entail. Pay particular attention to any debt you are carrying (mortgages, etc.). Ideally, you don’t want to be overly burdened with debt once you are no longer practicing full-time.
A review of your current net worth can give you a clearer picture of your overall financial standing. Net worth takes into account the value of all your assets as well as your outstanding liabilities.
If you’ve been funding a tax-favored retirement plan, hopefully you have accumulated sufficient assets to provide a steady stream of income for all the years you may be retired. If you still haven’t met your goal, you’ll want to determine if your earnings from part-time work will allow you to comfortably continue adding contributions to your retirement plan. You’ll also want to determine when you can start taking penalty-free withdrawals from your plan(s) and project what your tax situation will look like. These are all issues we can help you assess.
2. Look at Your Options
If you are part of a multi-physician practice, talk to your colleagues about what arrangements can be made for you to start cutting back your hours. You may need to revise your practice agreement to incorporate a new compensation arrangement. Typically, such arrangements are based on the productivity of the part-time physician less a share of practice overhead expenses.
If you are a solo practitioner, you may find it hard to practice part-time without creating problems with your current patient base. Patients may feel that you can’t deliver the type of patient care they expect if you are practicing part-time. Bringing in a physician assistant may be helpful. However, recruiting another physician who would eventually take over the practice may be the most effective route for solo practitioners.
Give careful consideration to the financial arrangements you make with the new physician. When it comes time to sell, you’ll want to have a formal purchase agreement that outlines all of the rights, obligations, and responsibilities of the buyer(s) and the seller. It should also include a valuation of the practice.
3. Consider Malpractice Insurance
Don’t ignore the issue of malpractice insurance when you are weighing the pros and cons of going part-time. You need to be certain you will be covered during your part-time years and after you stop practicing completely. “Tail coverage” can protect you against any malpractice claims that may be filed against you after you retire.
CIG Capital Advisors Can Help with Retirement Planning
Whether you are serious about transitioning to part-time work or are simply exploring your options, be sure to consult with us. We can help evaluate your personal financial preparedness for retirement and assess the need for other steps, like medical practice valuation or a partnership exit strategy. Schedule a complimentary consultation with a CIG Capital Advisors professional to discuss your specific situation.

2019 Asset Management Year in Review and Look Ahead to 2020
What a difference a year makes. Last December, equity markets plunged almost into bear market territory driven by fears that the Federal Reserve and their rate hikes would throw the economy into a recession. Today, the Federal Reserve is buying more treasury bills than they ever bought in prior Quantitative Easing (QE) periods and have pushed the markets to new all-time highs[1]. QT, or “Quantitation Tightening” – increasing short term rates and a shrinking Federal Reserve balance sheet – is but a vague memory now. So, just as last year’s pessimism clearly was overdone, today’s optimism is likely outpacing the economic evidence that the economy is moving to higher growth.
A measure of that is the CNN Fear & Greed Index- below reaching the “Extreme Greed” level as we started trading for 2020 versus 1 Year Ago[2].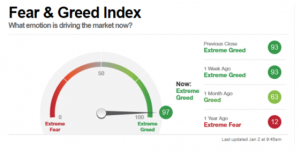
2019 was a stellar year for the equity and bond markets. Nearly every major asset class had significant outperformance versus the rate of inflation. That said, it is important to recognize 2019’s good returns were primarily driven by what investors are willing to pay for a dollar of company earnings (the “earnings multiple”), as annual earnings growth is likely to be only single digits when companies complete announcing their 2019 Fourth Quarter results this month. 2018’s disappointing equity market returns were the result of the exact opposite situation: 22% earnings growth but declining earnings multiples. You may recall from our January 2019 letter that almost no asset classes beat inflation in 2018. While such a dichotomy between the years is not unheard of, it was historically extreme as noted by Morgan Stanley[3].
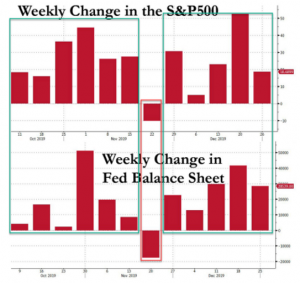
Central Banks, including the Federal Reserve, can have a large impact on earnings multiples. According to economic theory, when money growth is faster than the growth of the economy, the excess money goes into financial assets driving even expensive stocks and bonds higher. Ever since the start of October when the Fed launched QE4 in response to the September stealth banking crisis, the Federal Reserve balance sheet rose 11 of 12 weeks starting October 9, and declined just 1 of 12, and magically, the S&P did just that as well[4].
We remain concerned that the New York Federal Reserve continues to inject reserves into the banking system to keep some short-term rates from rising. This system, the overnight repo market, is where the interest rates that central banks set meet the interest rates that real economic actors use. You may recall the unrest in September in the money markets, when short-term interest rates got out of the Federal Reserve’s control and briefly spiked to 9%[5]. This could signal that something’s potentially wrong with the financial system, especially as it relates to banks and liquidity.
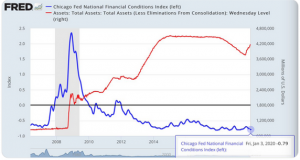
During 2019, we counted over 50 Central Bank easing actions, and global short term rates declined about -0.6%[6]. The aggressiveness of the Central Banks has been a surprise to many with the Federal Reserve, in particular, adding almost $400 billion dollars to the markets in just four months! (Note dramatic upturn in the graph below[7].)
It is also remarkable how skewed the S&P 500’s 2019 return is toward a small handful of larger-cap firms and sectors. Apple (+88% return) and Microsoft (+57% return) accounted for almost one-fifth, and Information Technology was 50% of the S&P 500 index’s return. The largest source of stock buying was the companies themselves, with Information Technology buying back the most stock of any sector.
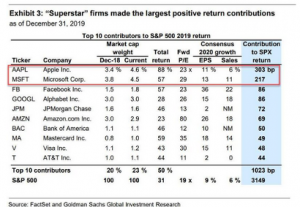
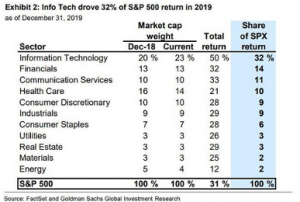
Companies buying back their own shares has been a major contributor to the rally since 2009. A Goldman Sachs analysis warns that they anticipate 2019 stock buybacks will drop 15% in 2019 to $710 billion and continue to drop in 2020. Corporate buybacks currently provide more demand for stocks than any other individual source, including households, mutual funds or exchange-traded funds. Buybacks as a percentage of trailing annual free cash flow has historically peaked near the highs of the market, i.e.: 2000, 2008, and 2016[8]. A slower pace of buybacks should not only drag on companies’ earnings per share, but also lead to increased market volatility as corporations provide less support to the equity markets.
The last time that we saw such dynamics in the market was the late 1990s, with “insurance” rate cuts, skewed returns and political risks. We remember what happened in 2000: a severe market downturn.
All of this is in the background of an investment market that wants to find a narrative to support driving asset prices higher. In December, the narrative was that the three biggest worries of 2019 have been solved during the week of December 9. On trade, the U.S. and China agreed to a “Phase One” deal and additional tariffs scheduled for December 15 were delayed. In the UK, Prime Minister Boris Johnson won a landslide victory, ensuring that “Brexit” would finally take place. Lastly, the Federal Reserve said that interest rates should remain steady through 2020. As we entered 2020, markets started off slow but now have begun to make some new highs. Given recent events in the Middle East, it feels like anything could happen.
Where does this leave the investment markets? One of the best indicators of the fair value of the stock market in the U.S. is the total market value relative to the total economy, or GDP. At this point, an argument could be made that the market is significantly overvalued, given that the total market value is almost 155% of the last reported GDP. The last time that this happened was the Dot Com Boom of the late 1990s.
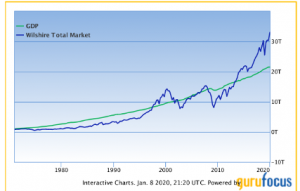
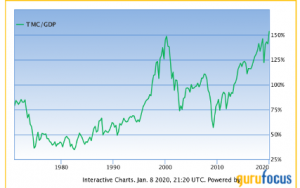
While some may argue that low interest rates and the amount of company sales overseas have impacted this ratio, on the face of it, the U.S. stock market would likely need to return about -3% per year in the next eight years to get back to the long term trend for the economy.
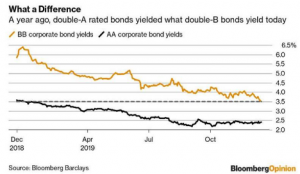
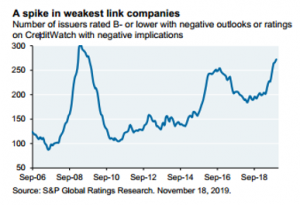
The corporate bond market has also benefited from declining interest rates over the last 18 months. As interest rates and bond yields have fallen in Europe and Japan into negative territory, investors there have bought more corporate bonds in the U.S[9]. As a result, the current market requires investors to increase risk in order to maintain the interest payments that they received in previous years. As of mid-December, the average junk bond (BB rated) yielded just 3.5%, an all-time low, including a credit premium or “spread” of just 1.64% more than risk-free Treasuries. A year before, the average high quality corporate bond (AA rated), such as those issued by Berkshire Hathaway, Apple and Exxon, was yielding 3.6%, more than the yield one now gets for bonds whose rating is some nine credit rating levels lower, in deep junk territory[10]. Meanwhile, cracks are starting to show in the lowest rated bonds[11].
Consequently, our objective in 2019 was to generate returns ahead of client financial plan targets by taking restrained risk in relation to client general risk preferences. We accomplished that by being:
- Slightly less invested in stocks and 25% less invested in bonds versus our benchmarks.
- Invested in shorter-term bonds to avoid the risk of rising interest rates.
- Diversified internationally and in alternatives investments like Gold.
- Underweight expensive corporate bonds and loans with deteriorating protections for investors like those mentioned above.
In 2020, the CIG team will continue to weigh the potential risks in the markets and plan for a wide range of scenarios, both positive and negative, while steadily reevaluating and managing the appropriate level of risk so that clients can achieve their financial plan goals. Specifically, our strategy remains consistent with prior years and will encompass:
- A core portfolio which focuses on stock and bond characteristics – Factors – that are a persistent source of investment return. We will attempt to limit the Momentum Factor in our portfolios. Momentum manifests itself in investors simply buying what has been making money (i.e., high growth names and consumer staples stocks) and selling what hasn’t (i.e., energy). The problem is that it leads to crowding into the same stocks. As soon as those stocks stop making money, these investors rush for the exits and the stocks fall significantly, which is what happened in the first two weeks of September.
- Meaningful diversification. After a 10-year equity bull market in the United States, the prudent approach for client portfolios is to have some investments in different geographies, fixed income and alternatives. We seek to deliver a nuanced, material understanding of diversification, which typically means carefully buying assets that have not appreciated and selling investors’ favorites. Diversification remains our best defense.
- A long-term approach. This methodology is particularly true in clients’ variable annuity and educational accounts, which generally do not have as extensive Factor or diversification exposure as the main portfolios.
- Tactical risk management. When the markets become, in our estimation, too volatile, we take risk management action in CIG’s Dynamic portfolios.
The bottom line is that we expect 2020’s market returns to be much lower than those of 2019 and less uniform. We continue to seek out “value-additive” investments to take advantage of market opportunities and be more contrarian and tactical to enhance portfolio returns in 2020. Markets are expensive and likely to get more expensive as a result of “easy money” from Central Banks. The risk of policymakers losing control is rising along with geopolitical risks. In this late cycle environment, CIG has taken a defensive stance and is prepared to take further action as the market direction dictates; we continue to focus on our clients’ risk-adjusted returns in support of their financial objectives and goals. In the words of Warren Buffet, the “Oracle of Omaha” and legendary investor, we will be “fearful when others are greedy and greedy when others are fearful.”
This report was prepared by CIG Asset Management and reflects the current opinion of the authors. It is based upon sources and data believed to be accurate and reliable. Opinions and forward-looking statements expressed are subject to change without notice. This information does not constitute a solicitation or an offer to buy or sell any security.
[1] Yahoo Finance
[2] https://money.cnn.com/data/fear-and-greed/ as of 1/2/20 at 9:45AM
[3] “On the Markets,” Morgan Stanley, January 2020
[4] “Market Your Calendar: Next Week The Fed’s Liquidity Drain Begins,” ZeroHedge.com, January 2020
[5] https://www.chicagofed.org/publications/chicago-fed-letter/2019/423
[6] Cornerstone Macro, November 3, 2019
[7] https://fred.stlouisfed.org/series/WALCL
[8] Goldman Sachs 10/21/2019
[9] “Even Goldman Bristles As Junk Bond Rally Smashers All Records,” Zerohedge.com, December 2019
[10] Bloomberg Opinion and Bloomberg Barclays
[11] “Eye on the Market,” J.P. Morgan
Physician Retirement Planning: Is Your Paycheck Today Endangering your Lifestyle Tomorrow?
PHYSICIAN RETIREMENT PLANNING Proper physician retirement planning can help you keep living as you do now. Does your current cash flow strategy support your long-term financial health? Your cash flow habits today, or how you spend your paycheck and other income derived from working as a physician, may negatively affect your retirement years. The lack […]
