
CIG Asset Management Update August 2020: A Reminiscence of a Bubble Past
The S&P 500 recorded its best August return since 1986, up +7%. The S&P5, the so called FAAMG stocks, provided a majority of the S&P return for the month[i]. Developed market stocks, excluding the U.S., as measured by the MSCI EAFE Index, rose 4.9% and the MSCI Emerging Markets Index gained 2.1%[ii]. Domestic fixed income measured by the Bloomberg Barclays Aggregate, was down -0.8%[iii]. The trade-weighted U.S. dollar index continued its decline, falling an additional -1.3% in August[iv].
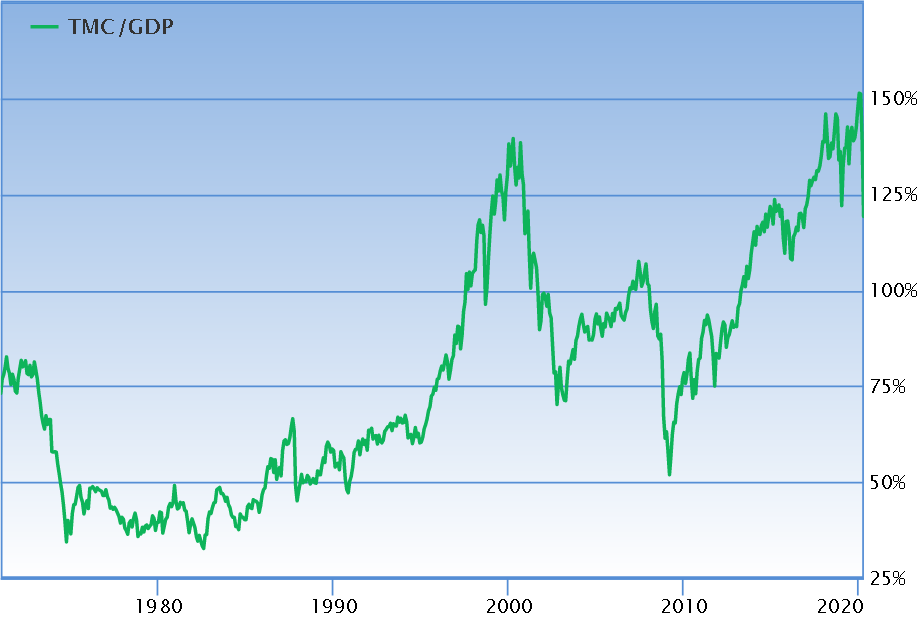
As we have pointed out in previous letters, stock market valuation had already reached lofty levels as measured by overall stock market capitalization versus the size of the economy (market cap/GDP). In July, we reached 171%, eclipsing the level of the Dotcom boom in March of 2000, and it has continued to grow to 178% as of this writing[v]. A perhaps more relatable valuation metric has also reached record highs: The forward price to earnings multiple on the S&P 500 is above 26, the same level reached in March 2000. March 2000 was also the peak of the market[vi].
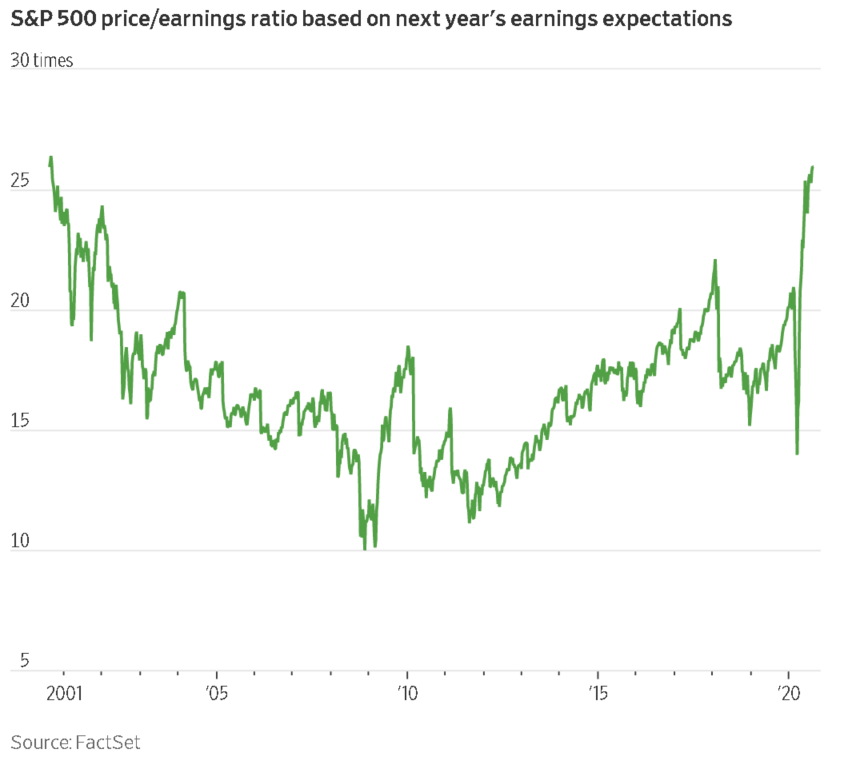
We have vivid recollections of the Dotcom boom and the following bust from 1999 to 2002. Strangely enough, we are currently seeing many other similarities to that era 20 years ago. In addition to comparable record market valuations as illustrated to the right, we have talked at length about the lack of breadth in the market, that a very few number of stocks are providing most of the returns for the indices. This also occurred during the Dotcom bubble. Twenty years ago it was, similar to today, technology providing the majority of the returns.
Additional events in August remind us of that era 20 years ago. During the Dotcom boom, companies would add “.com” to their name to significantly boost their stock return and participate in the bubble. Yes, it really happened and we lived through it. Three professors from the University of Purdue published a study, “A Rose.com by Any Other Name” in the December 2001 issue of The Journal of Finance, that showed company managements could increase their stock price by about 74% in the 10 days after announcing that they were adding “.com” to their name! Imagine our sense of déjà vu when Walmart announced on August 27 that it was teaming up with Microsoft to bid for TikTok, a social media platform. Walmart stock gained +4.5% on this announcement. Less than one week later on September 1, Walmart gained an additional +6% as it announced it will launch a membership program similar to Amazon Prime later in the month[vii]. Walmart has traditionally been viewed as an old-school brick and mortar retailer. It appears they are trying to change that perception.
Another phenomenon during the Dotcom bubble was to split your stock into more shares, which in many cases helped to drive the price higher. Apple announced a 4-for-1 stock split on 7/30/2020. Tesla announced a 5-for-1 stock split on 8/11/2020. From the announcement of each stock split to August 31, Apple gained +34% and Tesla gained +81%[viii]. These high gains were in spite of the fact that a stock split simply lowers the price for a share of the company’s stock. A split does not add any economic value to the underlying company and investors can already buy fractional shares through many trading platforms. Ask yourself the following question: Would you like your pizza cut into 8 slices or 16? No matter how many slices you decide to cut the pizza into, you still have the same total amount. If non-value-additive stock splits and acquiring social media properties like TikTok juice your stock price, more company managements may likely be considering doing the same, but we would not rely on that as an investment strategy.
Just a couple of other similarities:
- The market has appreciated about 80% while normalized earnings have flat lined for four years. Going in to 2000, the same thing happened when the spread blew out to 70%[ix].
- The valuation gap between high valuation stocks (29x earnings) and low valuation stocks (10x earnings) remains wide and similar to 2000[x].
- The number of stocks trading over 10x revenues in the Russell 3000 is more than 400, like the year 2000. That means for a 10-year payback, the company needs to pay investors 100% of revenues for 10 straight years in dividends regardless of the cost of goods sold, payroll, taxes, etc[xi].
Where do we go from here? As of August 31, 20 of 22 prominent Wall Street strategists have a year-end 2020 price target for the S&P 500 at or below the closing price of the index[xii]. Valuations did not matter during the Dotcom bubble of 1999 – 2000 until suddenly they did, after Labor Day 2000. Then the narratives about the market and specific “darling” stocks that everyone believed that everyone believed broke. It took two years for the market to reach bottom after the bubble burst. The S&P 500 lost 50% and the NASDAQ lost 78% from the March 2000 peak to the October 2002 low[xiii].
To paraphrase the great Yogi Berra, it’s tough to make
predictions, especially about the future – of what very well may be the largest
financial bubble of all times. That said, market conditions are likely continue
to be volatile for some time. Volatility usually means that we are nearing an
inflection point. We feel strongly that having our safety nets up, bracing for some potential steep air-pockets,
and refraining from speculation in the hyper-valued growth stocks that we are
seeing like Apple and Tesla, is the correct way to be positioned as we wait for
the inflection to present new opportunities. Historically, outsized returns in out-of-favor
areas can appear swiftly and dramatically. If such a move occurs from growth to
areas such as value, dividends and small caps, we are already invested there.
At the same time, we have a plan if the markets and the economy do get better,
likely leading to the bubble marching on.
[i] Calculated from data obtained from Yahoo Finance, as of August 31, 2020
[ii] MSCI, as of August 31, 2020
[iii] Calculated from data obtained from Bloomberg, as of August 31, 2020
[iv] Calculated from data obtained from Yahoo Finance, as of August 31, 2020
[v] https://www.gurufocus.com/stock-market-valuations.php as of September 14, 2020
[vi] Factset, September 1, 2020
[vii] Calculated from data obtained from Yahoo Finance, as of September 3, 2020
[viii] Calculated from data obtained from Yahoo Finance, as of August 31, 2020
[ix] Bloomberg Data from 01/01/1990 to 7/31/2020 via Invenomic Capital
[x] Goldman Sachs Investment Research. Data from 01/01/1985 to 6/25/2020
[xi] Bloomberg Data from 01/01/1997 to 07/31/2020 via Invenomic Capital
[xii] Bloomberg, as of August 31, 2020
[xiii] Calculated from data obtained from Yahoo Finance, as of August 31, 2020

CIG Asset Management Update June 2020: The Ride
The pandemic-infused markets have been a roller coaster ride during the first half of 2020. After a short climb in January and February, the S&P 500 Index fell by 35% in just over one month and then staggered back up the lift hill[i]. What twists and turns the market roller coaster will offer next is difficult to know.
Going forward, the best possible outcome in our opinion would be a widely available vaccine by year-end and everyone goes back to work. The U.S. would just need to figure out servicing trillions of additional government debt. Many worse outcomes would likely include no effective vaccine like most viruses, millions of permanent job losses, and enduring changes to business models in multiple industries.
When the market reached its high on June 8, our view was investors seemed to be focused predominantly on the best possible outcome. It is our opinion that the massive rally from the March 23 low was largely driven by “Stimulus” winning the tug-of-war over “COVID-19.” According to Cornerstone Macro, until last week when the European Union agreed to a unified stimulus fund which brought them in line, the U.S. has led the world in fiscal and monetary stimulus.[ii] But the U.S. has continued to lag the world in COVID-19 response. Only some emerging markets now have infection rate trends worse than those of the United States.[iii]
Regardless of any value judgment about the present situation, one could theoretically pull out the playbook for a traditional recession, review the history books, assess the probabilities/outcomes and lock in a portfolio for the next two years and perhaps experience a ride like Cedar Point’s kiddie coaster Woodstock Express.
If only more of us were alive back in the 1918 global pandemic and the structure of the economy, technology and banking had more resemblance to today’s world; if only probability theory could be easily be applied to a pandemic occurring in a non-ergodic, uncertain time, maybe we could do that. A non-ergodic system, such as this time, has no real long-term properties i.e., history is no help to predicting the future. It is prone to path dependency – which is just a fancy statistical way of saying that “THE RIDE is everything”.
Months like March keep us up at night. When we think about the markets, we are thinking about our goals, dreams, fears, and hopes. These long-term goals end up in the financial plan and are embedded in the portfolio strategy that our clients may select. Given a choice between being down -35% or losing -15% in March, many of us would choose -15%. At the same time, we try to stay focused on the long-term goals.
Now that we may be again back at the metaphorical top of the coaster’s lift hill, it is important to consider the next moves both prudently and imaginatively. Since June 8, the S&P 500 Index has been alternating between gains and losses around a 250-point range[iv]. There have been several 2%+ declines, including June 11’s -6% loss when Federal Reserve Chairman Powell said, “We’re not even thinking about raising rates” any time soon. Investors were distressed that the dovish Fed does not expect to raise rates until 2023. With almost 40 +/-2% days this year, the markets are on pace for the most swings since 1933[v]. For the month of June, the S&P 500 index returned just 1.8% while gaining 20.5% during the quarter (the best quarter since 1998)[vi].
For now, the stunning market rally from the March 23 low appears to have come to a pause in the U.S. Investors are back to that nervous feeling when checking the market each morning as if looking over the precipice of the rollercoaster’s first hill. What investors see is a stock market that is at peak valuations, as measured by total market capitalization / GDP (which we have talked about in the past)[vii]:
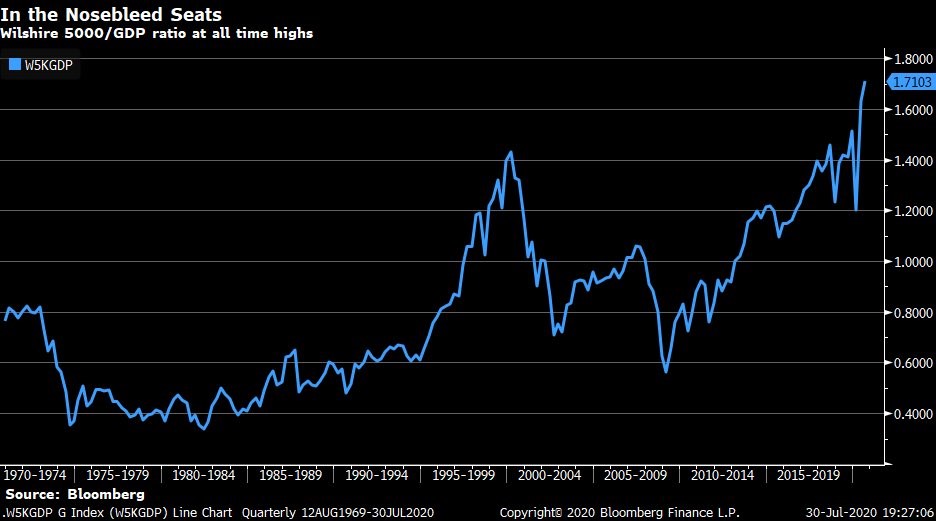
As the chart above clearly illustrates, there is no history that shows valuations over 150% to GDP are sustainable, even for brief periods of time. Yesterday, GDP for the second quarter was announced and the -33% annualized decrease was its worst quarterly hit since the Great Depression[viii]. With GDP falling from approximately $21.5 trillion to $19.4 trillion, valuations are now over 170% to GDP.
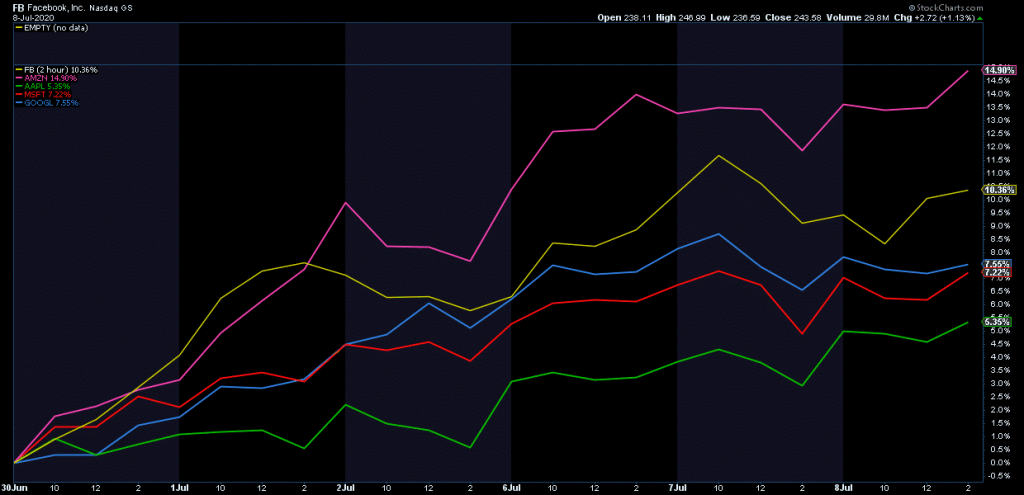
The S&P5, the so called FAAMG[ix] stocks, earlier this month added over a half a trillion in market cap in just 6 days. (Please see the chart[x] below showing the percentage return of these five stocks from June 29 to July 8.) In 2020, these stocks have added over $1.6 trillion in market cap[xi], a striking feat during any bull market with excellent growth, not a historic recession. Sure, some of these companies may have grabbed market share and pulled some sales forward during the shutdown but they all face anti-trust concerns which seem to be bi-partisan and international concerns. These stocks are disproportionately driving the market.
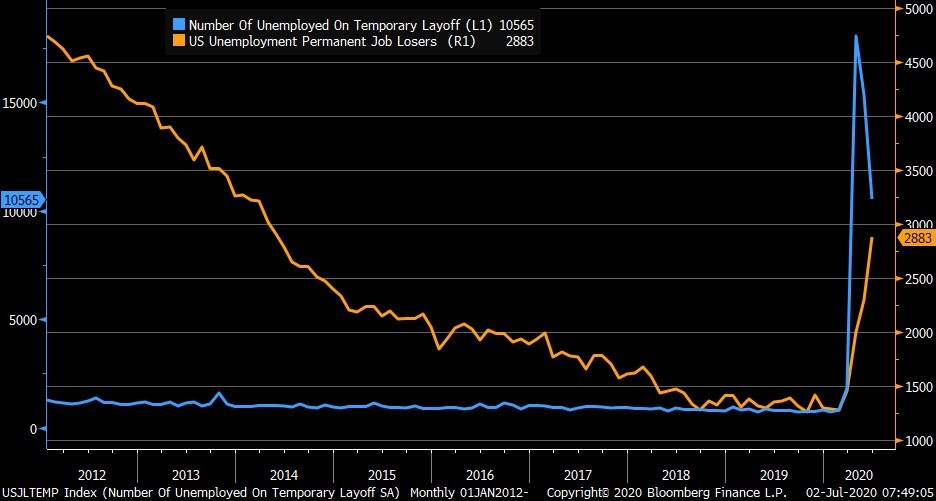
Certainly, economic data has seen a massive improvement from the recent historic collapses. However, it important to keep focused on year-over-year data and especially permanent job losses, which keep mounting. The chart[xii] below shows data from the US Department of Labor with the blue line indicating the number of temporarily laid off workers in the US and the yellow line displaying the number of permanently laid off workers.
Today, past experience is not unworkable, but if relied on thoughtlessly it can be hazardous. Some events will play out in the future as they have in the preceding times, but many will not. As indicated above, markets are rich and driven by a few stocks and simultaneously, the U.S. is experiencing some of the worst economic conditions in a long time.
Based upon CIG’s investment process and what we saw in the markets, we had fortunately already started to get more conservative in 2019 in the Strategic and Dynamic portfolios. Fast forward to 2020, at the beginning of February when the markets became more volatile, we acted within the Dynamic portfolios to reduce risk further, primarily by reducing the portfolios’ exposures to equities and adding to diversifying assets generally believed to be protective in a downdraft. We continued to act in March to attempt to dial-in the appropriate market exposure in the Dynamic portfolios, increasing risk, primarily by adding equities, after the market bottomed on March 23.
Hopefully, our strategic and tactical actions have allowed our clients to sleep better at night. CIG attempts in its client portfolios to get closer to the kiddie coaster experience versus the full rollercoaster ride of the S&P 500 index. The most important job is to strike the appropriate balance between offense and defense, i.e., the risk of losing money and the risk of missing opportunity. There will continue to be twists and turns along the ride but so far, all the previous scary rollercoaster rides in the market have concluded the same way: eventually, they stopped.
We will see in the coming months how the tug-of-war between Stimulus and COVID-19 plays out. There is probably nothing more path dependent than re-opening an economy in a pandemic. Let us hope for the best – a confidence-inspiring Goldilocks-style “not-too-fast / not-too-slow” opening, while also considering the myriad of possible economic and financial outcomes. Of course, never ignore the extreme risks which do not appear to be going away, especially as positive COVID-19 cases trend higher. We continue to be thoughtful, adaptable and at your service.
[i] Calculated from data obtained from Yahoo Finance, as of July 27, 2020
[ii] Cornerstone Macro, CSM Weekly Narrative, July 26, 2020, page 2.
[iii] Coronavirus.jhu.edu/map.html, as of July 30, 2020.
[iv] Calculated from data obtained from Yahoo Finance, as of July 27, 2020
[v] Bespoke Investment Group, July 2020
[vi] Calculated from data obtained from Yahoo Finance, as of July 27, 2020
[vii] Bloomberg as of July 30, 2020
[viii] Source: U.S. Bureau of Economic Analysis
[ix] Facebook, Apple, Amazon, Microsoft, Google
[x] StockCharts.com via NorthmanTrader on July 9, 2020
[xi] “Warning”, NorthmanTrader, July 9, 2020
[xii] U.S. Department of Labor via Bloomberg as of July 6, 2020.
Your Legacy: Why Act Now?
To take advantage of these or any other financial resiliency strategies, please schedule an initial complimentary consultation with Brian Lasher.
Your Legacy: Building Resilience
To take advantage of these or any other financial resiliency strategies, please schedule an initial complimentary consultation with Brian Lasher.
Your Legacy: What’s Changed?
To take advantage of these or any other financial resiliency strategies, please schedule an initial complimentary consultation with Brian Lasher.

Safeguarding Your Wealth with Proper Asset Protection Planning
Protecting accumulated wealth should be a cornerstone of your financial plan. A solid financial plan will address who or what poses the threat of taking away what you have earned and puts measures in place to limit the severity of those threats. These threats are often unseen and not easily predictable and therefore may cause a derailment from the path to your goals if your plan is not properly structured. Do you understand what your plan has put in place for asset protection?
Risk Management
It is not easy to think about, but just imagine that today was your last day alive. Who will be there tomorrow to protect your family and the assets you leave behind? Who will replace the high amount of income that you provide? Will your current savings be enough to provide for the day-to-day basics, let alone the big expenses of the future such as college tuition? Proper planning aims to assess the capital needs of an individual and his or her family to ensure that given any unfortunate event, the family will be taken care of first. A less often considered, but nonetheless important, scenario is disability due to injury or sickness. Will you still be able to pay your mortgage, car loan or other payments? What if this disability is for an extended period of time? You must, again, ask what your financial plan has in place for the future of your family and goals.
Personal and Business Liabilities
For physicians and other highly visible professionals, the possibility of becoming the defendant in a lawsuit based on work performed or expertise given is not out of the question. How is your medical practice structured? Which of your personal assets will be exposed to liabilities? There are particular are strategies to help protect and separate your business assets from your personal assets (Domestic Asset Protection Trusts).
Estate Planning & Titling
Do your estate planning documents match your intentions? Your estate plan may be designed to leave assets to your children; however, if your accounts and assets are not titled properly, your children may not receive those assets as intended. For example, accounts titled as Joint Tenants with Rights of Survivorship, all assets will remain in the account under control of the surviving owner, regardless of the estate plan documents. It is critical that your account titling matches your estate plan documents to avoid unintended consequences.
Mistakes and Unforeseen Problems
Without proper planning, your accumulated wealth could be exposed to numerous risks. With proper planning, those risks can be mitigated. CIG Capital Advisors Wealth Management team can make sure your wealth plan accounts for unforeseen personal events (death, disability or lawsuit) as well as financial hazards that could jeopardize the assets you’ve built over a lifetime. It can take many years, often decades, of hard work to accumulate significant assets. Unfortunately, it can only take one event to erase your progress. Contact a CIG Capital Advisors professional to prepare for the unexpected.
Tax Strategies for Physicians to Help Meet your Retirement Goals
Tax Strategy for Physicians A common mistake in do-it-yourself retirement planning is not understanding the numerous options available to save for and fund your retirement years. The mistake is not in the act of saving itself, but rather in the misallocation of dollars to taxable accounts before tax-advantaged accounts. That’s where tax strategy for physicians […]

CIG Asset Management Update May 2020: Stay the Course
| Equity markets continued their recovery from the March 2020 lows. In the month of May, the S&P 500(1) gained +4.5% and outside of the U.S., the MSCI EAFE net was up +4.1% and the MSCI Emerging Markets Index was up +0.6%(2). Growth outperformed value as measured by the Russell 1000 Growth Index, +6.6% versus the Russell 1000 Value Index which was up +1.1%. Small-cap stocks, as measured by the Russell 2000 index, were up +2.6%(3). Within fixed income, the Barclays U.S. Aggregate Total Return Index returned +0.5% and the Barclays U.S. High Yield Index increased +4.4% for the month(4). The FAAMG stocks, as mentioned in our April letter: Facebook (FB), Amazon (AMZN), Apple (AAPL), Microsoft (MSFT) and Alphabet (GOOGL), continue to drive performance within the S&P 500. Year-to-date through May 27, the FAAMG stocks are up an average of +15% versus the other 495 companies in the S&P 500 down -8%(5). |
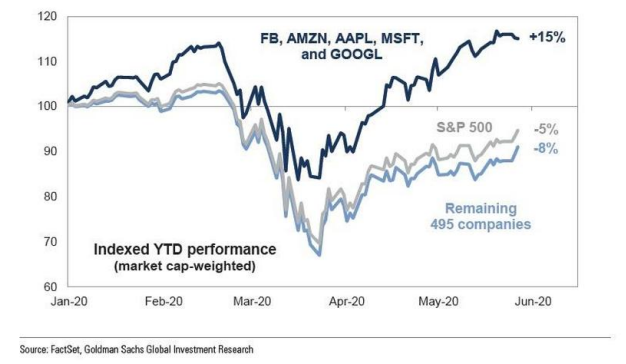
The good news within these numbers is that for the month of May, the FAAMG stocks and other 495 stocks were up almost equally. This could be quite constructive, as a broader number of stocks contributing to the overall return of the S&P 500 may lead to a healthier market.
We are encouraged as more states begin the process of re-opening their economies. It remains to be seen how the civil unrest that has followed the death of George Floyd in Minneapolis over the past few days will impact re-opening efforts.
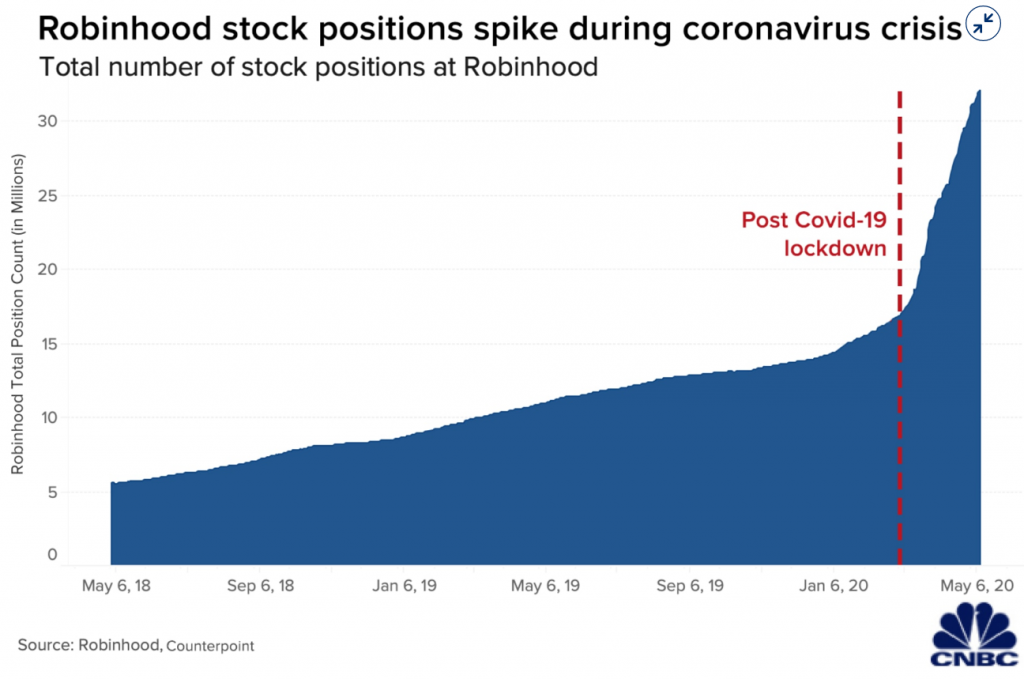
On May 22, Barron’s published an article, “Day Trading Has Replaced Sports Betting as America’s Pastime. It Can’t Support the Stock Market Forever.” Within this article, Jim Bianco from Bianco research argues many people who typically would gamble on sports went to the stock market as sports have been shut down. In addition, many Americans took their coronavirus stimulus check and invested it into stocks. Online brokerages have seen a surge in new accounts this year. Robinhood saw three million new accounts in the first quarter, and the total number of stock positions more than doubled year-to-date(6), even with the platform suffering crashes and glitches on heavy trading volume days.
Bianco believes that this retail investor mania has driven much of the markets’ 30%+ retracement from the low.(7) Retail investors piled into low-priced stocks that were down considerably, hoping to make big profits if they rebounded. The dangers here are i) hundreds of companies have withdrawn their revenue guidance for 2020(8), ii) only 63% of companies beat analysts’ consensus expectation – the lowest quarterly figure in seven years(9), and, finally, iii) multiple pharmaceutical companies have put out “market-moving” positive press releases without remotely having the vaccine data to back up their claims(10).
As we talked about in our recent webinar, we at CIG believe the path to successful investing over the long term is to develop a plan, exercise discipline, and stay the course. Retail investors piling into stocks that are down significantly or betting on vaccine cures, looking for short term profits, is not a long-term plan.
The most encouraging news in May was the May 28 unemployment claims report that showed continuing claims decreased by 3.86 million to 21.05 million. This is the first decrease since February, before the shut-downs. Although the absolute level of continuing claims is still over three times higher than the post-Great Financial Crisis high of 6.64 million(11), we are happy to see claims heading in the right direction. Volatility, as measured by the VIX, has also decreased from 34.15 on April 30, to 28.43 on June 1. This is still high versus historical averages; however, it is a far cry from the March 16 high of 82.69(12).
If volatility continues to fall and high frequency data following the progression of the economy reopening improves, we are likely to continue with the plan to rebalance towards the strategic equity targets. If volatility surges and reopening efforts are hindered by a resurgence in coronavirus cases due to the recent crowds of people protesting, we have a plan. Please always be mindful that our main objective is to reach the return necessary to achieve your goals as outlined in your financial plan, not to pursue returns without regard to risk. Valuations remain excessively high.
| This report was prepared by CIG Asset Management and reflects the current opinion of the authors. It is based upon sources and data believed to be accurate and reliable. Opinions and forward-looking statements expressed are subject to change without notice. This information does not constitute a solicitation or an offer to buy or sell any security. SOURCES: 1. Calculated from data obtained from Yahoo Finance, as of June 1, 2020 2. MSCI, as of June 1, 2020 3. FTSE Russell, as of June 1, 2020 4. Calculated from data obtained from Bloomberg, as of June 1, 2020 5. FactSet, Goldman Sachs Global Investment Research, May 27, 2020 6. CNBC, May 12, 2020 7. Barron’s, May 22, 2020 8. https://www.wsj.com/graphics/how-coronavirus-spread-through-corporate-america/ 9. https://www.jhinvestments.com/weekly-market-recap, Week ended May 29, 2020 10. https://www.businessinsider.com/perfect-storm-of-stupid-in-stock-market-right-now-2020-5 11. US Department of Labor, May 28, 2020 12. Data obtained from Yahoo Finance, as of June 1, 2020 |
Financial Resilience Amid Disruption: Your Tax Strategy
Policies around tax and some types of debt have changed during the pandemic, and some individuals may be able to take advantage of the new circumstances:
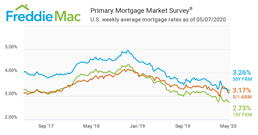
Lower Interest Rates: Interest rates are lower than they have been in several years, allowing some borrowers to refinance or take out a new loan or mortgage. If you currently have a mortgage or investment properties, restructuring the debt on these properties could yield large savings.
Charitable Deductions: Lower IRS 7520 rates for charitable trusts means that when gifting assets (cash or securities) to a Grantor Charitable Lead Annuity Trust, the IRS requires you to gift all the assets you contributed to the trust plus the interest. The interest rate used is the IRS 7520 rate. This rate is fixed for the life of the trust and sets the amount that needs to be distributed every year for the life of the trust. The difference between the fixed distribution and the growth within the trust will be passed to the beneficiary of the trust. The lower the 7520 rate, the greater potential for growth. For a CLAT with an initial value of $200,000, the below 7520 rates would yield the corresponding tax-free transfers to the remainder beneficiary:

Values are not intended to represent those of a client or known person.
Charitable Lead Annuity Trust (CLAT) is a plausible option to offset tax liabilities, gift annually, and set aside tax-free assets for a designated beneficiary in the future.
- Transfer
of cash/securities to trust in first year
- Immediate
deduction for gift to trust offsets…
- Increased level of income
- Realized Capital Gains
- Annually
gift for a set term from the trust to…
- Public Charity,
- Family foundation, or
- Donor Advised Fund
- Remaining balance at end of term is transferred to Remainder Beneficiary as a tax-free asset
- Immediate
deduction for gift to trust offsets…
Waiver for RMD in 2020: In March, required minimum distributions for retirement accounts were waived for 2020. An example of how a hypothetical person over age 70 could save on taxes by not taking RMD in 2020:
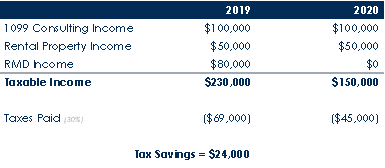
Assumes effective combined federal and state tax rate of 30% for hypothetical purposes. Values are not intended to represent
those of a client or known person.
Increased 401k/403b Loan Limits: Previously, penalty-free early withdrawals was the lesser of $50,000 or 50% of vested balance. Now, penalties don’t kick in until the lesser of $100,000 or 100% of vested balance, allowing savers to borrow more from their retirement accounts without penalty.
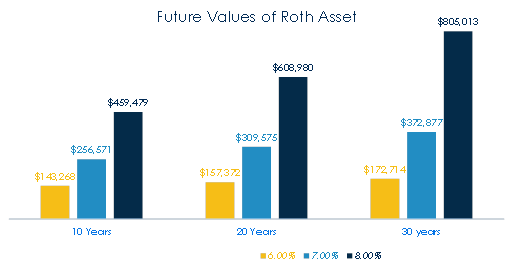
Opportunity for Roth Conversion: In a down market, with depressed values of pre-tax IRA accounts, it could be a good time to convert the account to a Roth IRA, where the funds can grow tax-free:
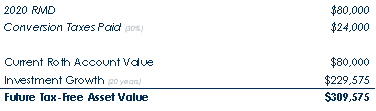
hypothetical purposes. Values are not intended to represent those of a client or known person.
This allows the saver to pay taxes on the lower account value this year, and once converted the money can grow, hypothetically, tax-free:
To take advantage of these or any other tax strategies, please schedule an intitial complimentary consultation at www.calendly.com/mswieckicig.

CIG Asset Management Update March 2020: March Madness
Market volatility continued through the month of March and continues month to date at extreme levels. Long time readers of our updates know that we have been warning about asset bubbles and Central Banks’ recent actions since last year. Valuation, volatility and liquidity are the three main areas that we believe investors should focus on right now.
Valuation: In spite of a -20% year to date return for the S&P 500(1) through March 31st, U.S. stock market valuations are still quite high relative to the size of the U.S. economy on a historical basis. The ratio of total U.S. market capitalization to GDP (TMC/GDP), reached an all-time high of 151.3% in December 2019(2). As a result of the sharp sell-off in March 2020, TMC/GDP dropped -21% to 119.2% as of March 30th(2). As easy as it is to measure total market capitalization on a daily basis, nobody knows how much or for how long the U.S. economy (GDP) will decline. The TMC/GDP ratio fell to 75 or lower during the post-Dot Com recession in 2001 and the Great Financial Crisis in 2009. An argument could be made that if the contraction in the economy is large and persistent enough, the U.S. stock market may not have yet seen its low.
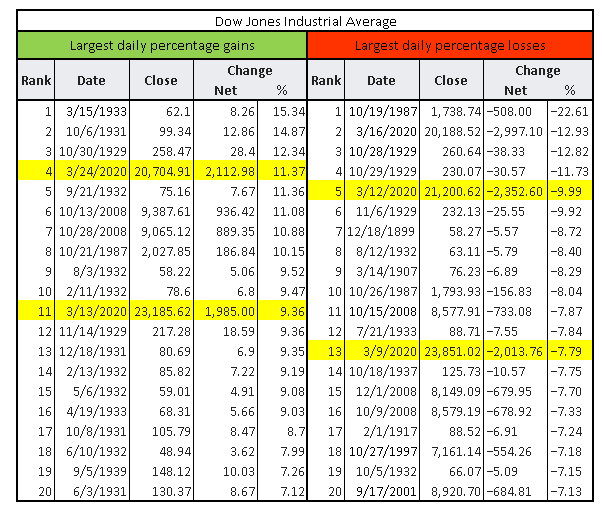
Volatility: March witnessed two of the top 20 daily percentage gains and two of the top 20 percentage daily losses for the Dow Jones Industrials Average (Dow), ever(3). Generally, these periods of extreme moves to the upside and downside have not occurred at or near market bottoms. Major market bottoms have occurred once volatility becomes more muted. Please reference the table below. As of this writing, we can add an additional top 20 up day. The Dow was up +7.7% on April 6, 2020(3).
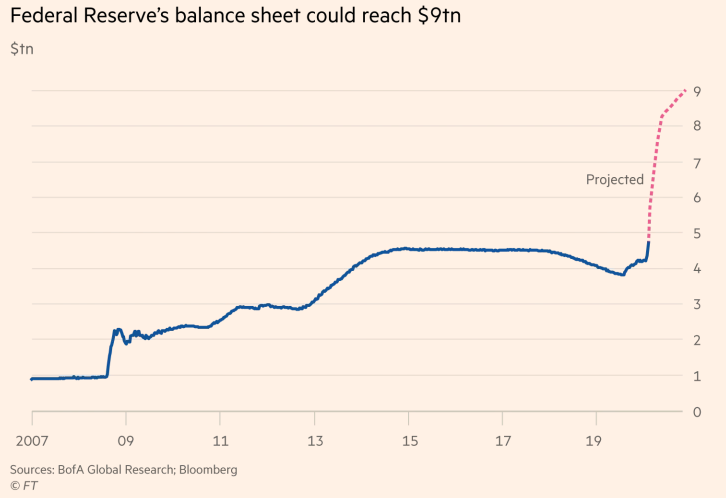
Liquidity: Following the rare emergency interest rate cut on March 3rd, the Fed cut the fed funds rate again by 1% to a 0 to 0.25% range at a subsequent emergency meeting on Sunday, March 14th. The Fed balance sheet expanded by an average $1 million per second from March 18th to March 31st. Bank of America believes the balance sheet could expand to $9 trillion by the end of the year (~40% of the U.S. economy.)(4) This is an exponential move from the expansion that began in late 2018. Typically, when the Federal Reserve pumps money into the financial system, stock market volatility calms down. In spite of unprecedented Fed action, volatility in March remained high. In fact, for the month of March, the stock market as measured by the S&P 500, moved intra-day an average of 5%, the most for any month on record. Even through the depths of the Depression or the Great Financial Crisis, the average intra-day move did not surpass 4%.(5)
Despite the continued ups and down, we would offer a little additional commentary beyond what we have discussed in the two recent webinars and above. For March, the numbers speak for themselves. The S&P 500(1) lost -12.4%, while the MSCI EAFE Net Index(6) of developed international equities was down -13.3% and the Emerging Markets Net Index(6) declined -15.4%. The Barclays U.S. Aggregate Total Return Index (7) returned -0.6% last month. The Barclays US High Yield Index(7) decreased -11.5% for the month. Hopefully, you are not too glued to CNBC or Fox Business News which we have warned house-bound market watchers about, given the media’s continued emotional rollercoaster and market manipulation (yes, we are talking about you, Bill Ackman).
In March, we kept our heads down and continued to focus on the one of the most important aspects of our relationship with clients. Beyond the investment expertise that we offer, our job is to ensure when times like this arise that we work together to restrain any exuberant investment behaviors as well as moderate our fearful investment behaviors.
The actions that we took in March in the Dynamic portfolios exemplify this goal. When the ten-year Treasury bond declined to an all-time low yield, we reduced portfolios exposures to long-term bonds. As you may recall, prices increase when bond yields fall. When it appeared that equity markets were temporarily bottoming, we increased our stock market exposure by adding to the equity hedge fund manager. During the last week of the month, when it looked like the House of Representatives would approve the CARES Act, we increased Treasury Inflation Protected Securities (TIPs) and more market sensitive equity positions. Overall, the Dynamic portfolios ended the month with more stock market exposure but not dramatically so.
Last week, we began our quarterly rebalancing of portfolios towards their strategic targets. We identified some areas that seem to be successful in this current environment, and we reduced cash and bonds that previously worked but are less likely to do so going forward. We are taking incrementally more risk via adding to defensive equities like healthcare and consumer staples. In certain portfolios, we added a “value-add” fund that is focused on a trend-following process which can work in higher-volatility markets.
On a positive note, we would quote Dr. Anthony Fauci: “You can’t rush the science, but when the science points you in the right direction, then you can start rushing.”(8) We have many laboratories looking to develop and roll out a vaccine. When the science is ready, a solution to the virus could come well before the usual 18 months. Even if we end up “going old school” and transferring plasma from previously infected individuals, we will get to the mountaintop and, ultimately, see a safer public health, economic and investment environment. Until then, we will continue to very nimble and proactive as we manage the portfolio allocation.
This report was prepared by CIG Asset Management and reflects the current opinion of the authors. It is based upon sources and data believed to be accurate and reliable. Opinions and forward-looking statements expressed are subject to change without notice. This information does not constitute a solicitation or an offer to buy or sell any security.
- Calculated from data obtained from Yahoo Finance, as of April 1, 2020.
- https://www.gurufocus.com/stock-market-valuations.php
- https://en.wikipedia.org/wiki/List_of_largest_daily_changes_in_the_Dow_Jones_Industrial_Average
- “How big could the Fed’s balance sheet get?” Financial Times, April 5, 2020 citing report from Bank of America
- Bloomberg, Jonathan Ferro as of March 31, 2020
- MSCI, as of April 1, 2020.
- NEPC
- https://www.brainyquote.com/lists/authors/top-10-anthony-fauci-quotes