
CIG Asset Management Review: Outlook 2021
Summary:
- From 2009 to 2018, the structural bull market conditioned many investors to believe that despite short-term pullbacks, the market will always head higher over the intermediate and long term thereby rewarding dip buying and passive investing.
- From 2009 to 2018, the structural bull market conditioned many investors to believe that despite short-term pullbacks, the market will always head higher over the intermediate and long term thereby rewarding dip buying and passive investing.
- Now, the markets are historically expensive, fragile, and disconnected from the real economy. A 60/40 Static Allocation portfolio4 has a 12-year projected return of -2.2%, the lowest in U.S. history[i]. CIG’s aim is to exceed client’s goals, which are higher, in a thoughtful way.
We held off providing our 2021 Outlook until now because of several known unknowns (e.g., the election) and some unknown unknowns (e.g., GameStop)[1]. With some resolution of these unknowns, we offer a historical perspective, an outlook, and a viewpoint on success.
A Historical Return Perspective:
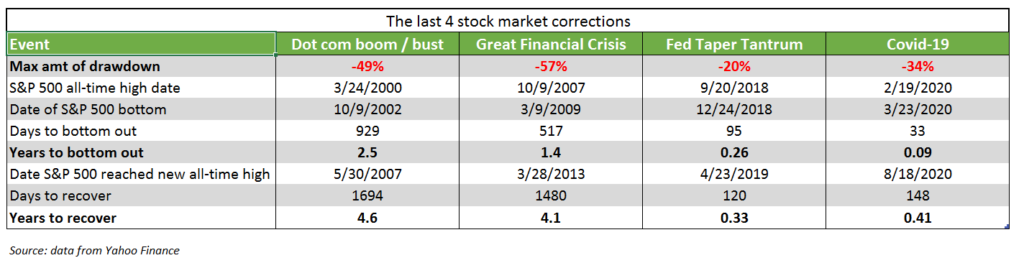
We first need to look at the last four major corrections in the US stock market, as measured by the S&P 500 Index. The last two major corrections, the Fed Taper Tantrum and most recently the Covid-19 sell-off, have seen markets bounce back very quickly as governments added trillions of dollars in liquidity by adding trillions of dollars of debt and running an enormous trillion dollar budget deficit. Yes, over time stock markets go higher, but we will inevitably see corrections in future years. Will the next major market sell-off look similar to the most recent two, where markets rebound quickly, or will the experience be more like the Dot com and Great Financial Crisis sell-offs where it took years to recover losses? An investor who retired in March of 2000 or October 2007 likely suffered their share of sleepless nights as the stock market ground lower and took years to recover.[2]
Prior to October 2018, the market was supported by the Fed’s quantitative easing (i.e., money printing) and zero interest rate polices, companies buying back their shares, and some economic growth.
From 2009 to 2018, a 60/40 Static Allocation (60% S&P 500 Total Return Index / 40% Bloomberg Barclay Aggregate Bond Index) returned approximately 10.0%[3] on an annualized basis while an index approximating active management[4] returned about 4.4%[5]on an annualized basis. Please see the chart below showing the daily performance of a hypothetical $10,000 investment in the 60/40 Static Allocation, the Active Management Index, and the S&P 500 Index.
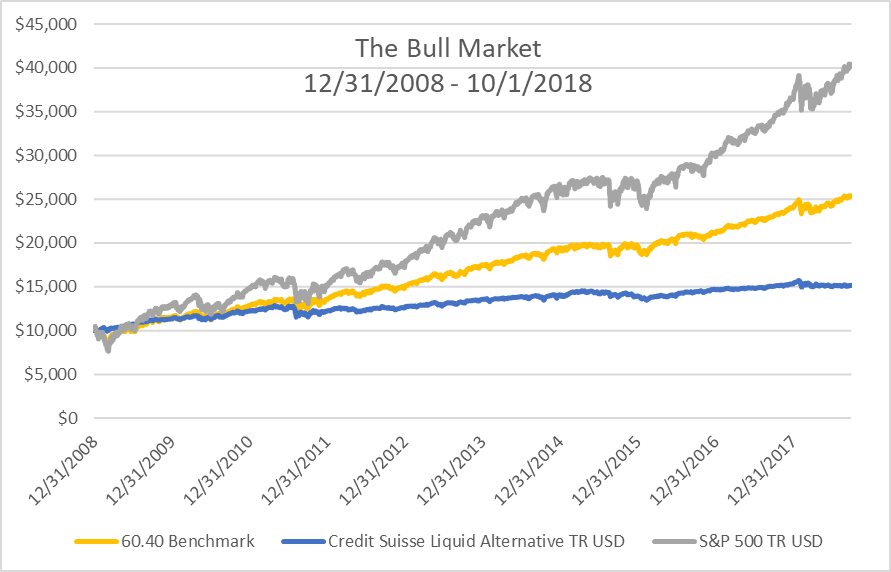
Source: Morningstar
That structural bull market ended in October 2018 when the Fed tried to raise interest rates and corporate share buybacks no longer worked. This event is known as the “Taper Tantrum”. Since
October 2018, it has been a much bumpier ride. Still, the 60/40 Static Allocation has returned 12.7%4 on an annualized basis while the gap has closed between it and the “Active Management” index’s5 annualized return of 9.0%6. Please see the chart below tracking this performance over this period.
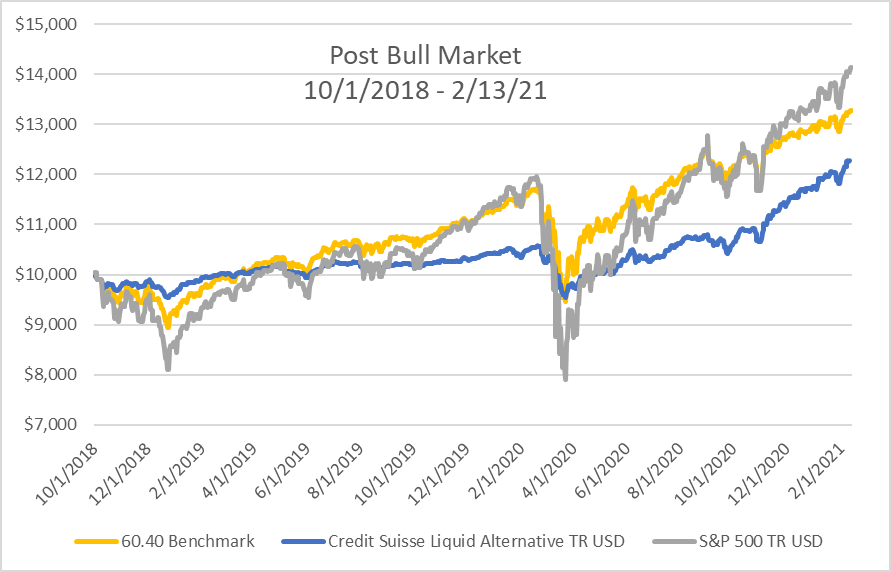
Source: Morningstar
While we have come through this period, one estimate of average annual nominal total returns by John Hussman, a prominent market strategist, for a 60/40 static allocation has a 12-year projected return of -2.2%, the lowest in U.S. history, including the extreme low associated with the 1929
market peak1. Even if the markets remain at peak valuations and pre-pandemic margins are sustained into the future, the upside range of that forecast is about 3%1.
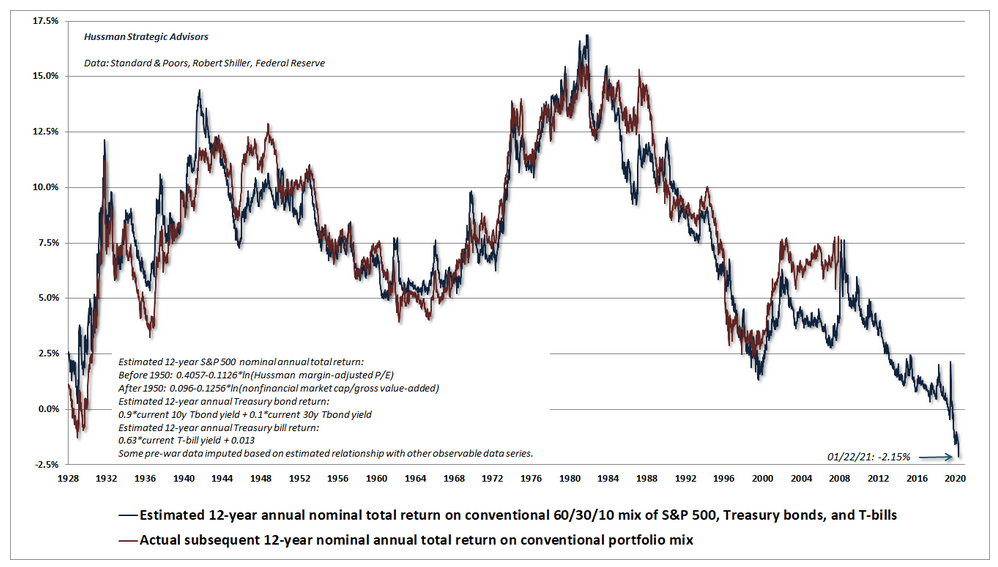
Source: Hussman Strategic Advisors
The Outlook:
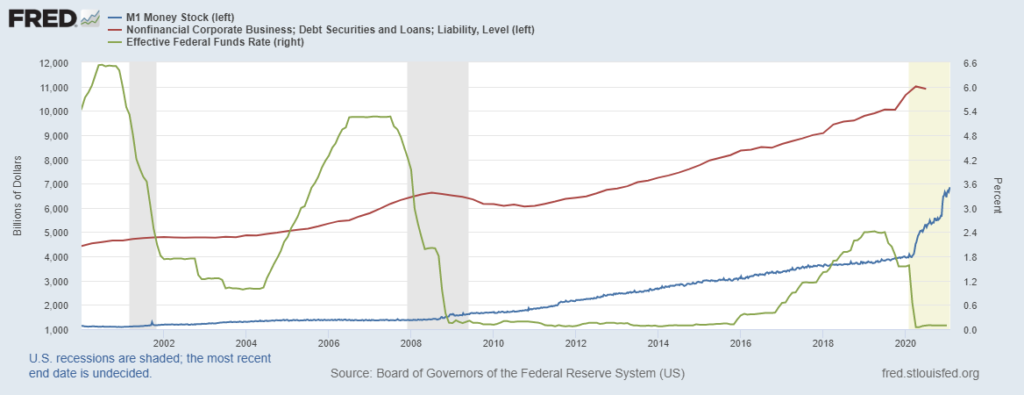
The smooth returns from 2008 to 2018 were aided by governments, businesses, and households taking on more and more debt. Companies started issuing more bonds in the late 1990’s, households took on too much debt in 2003-2008 to buy houses (remember the foreclosure crisis), and finally the US government post the 2008 crisis (all shown in the red line in the chart below) – all to maintain economic growth. When you have a large amount of debt, one cannot afford high interest rates and the Fed kept rates very low (green line below). The Fed also increased the money supply (blue line
below). Investors were conditioned to buy the dip (BTD) and that there were no alternatives (TINA) to stocks. Both instilled a fear of missing out (FOMO).
Source: Federal Reserve of St. Louis[6]
The S&P 500 broke its 2009 uptrend in December 2018. The Fed reacted by cutting interest rates and they started buying securities in the market. This led to not only to a massive rally in 2019, but easy money also produced the one of the greatest investment traps of all time which all came to a dramatic end in March 2020 when COVID hit the world economy and the S&P 500 Index declined by 34%. The structural problems that started long ago still have not been addressed, including the lack of corporate profit growth (the green line on this graph). Now we are left with potentially ever widening extremes in the market as shown below.
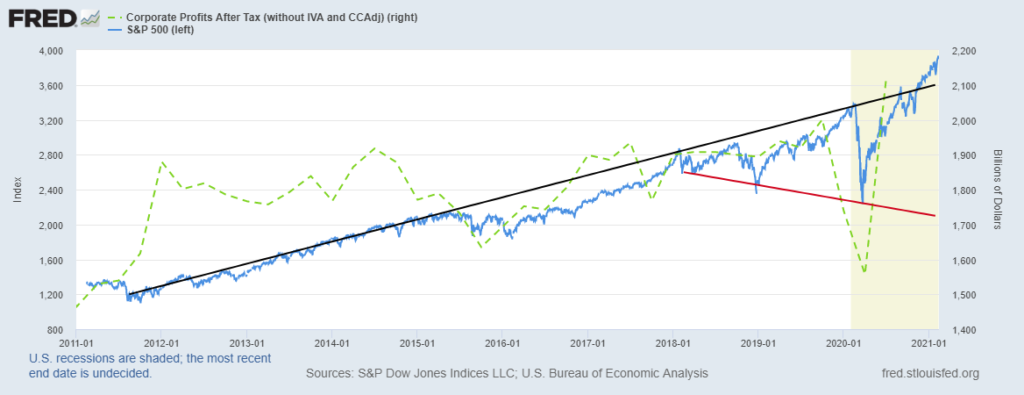
Source: Federal Reserve of St. Louis[7]
The stock market is back at all-time highs and is expensive on a valuation basis. In past similar
circumstances, a 60/40 Static Allocation likely did not meet your investment goals. From 12/31/1999 to 12/31/2012, the Static Allocation returned just 3.8%4 on an annualized basis versus 6.5%6 for “Active Management.5” In 1999, the market was similarly expensive and driven by a handful of
technology companies. A recent Gavekal Research report9 showed that if you had bought the 10 large-cap technology darlings back in January 2000 – after reinvesting all the dividends, you would have been left two decades later with one winner Microsoft – and a 1.4% compounded return[8].
Over the shorter period to 2012, an investor would have needed to diversify into other sectors and bonds to produce the low single digits return above.
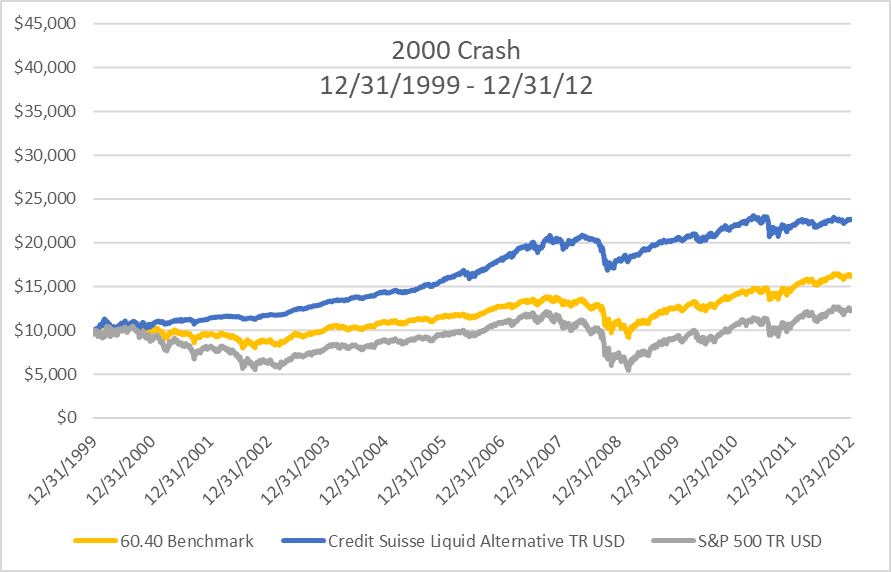
Source: Morningstar
Central Banks and National governments seemed to have thrown everything that they could at the crash starting at the end of March 2020. It has made people chase distorted asset prices since April 2020, given a fear of missing out. Markets now appear completely disconnected from the economy – just look around. One in 8 Americans, more than 27 million adults, reported they sometimes or often didn’t have enough food to eat in the past week, according to Census Bureau survey data collected in late November and early December[9].
Unemployment skyrocketed in 2Q 2020 and continuing unemployment claims have remained high (see the red area in the chart below while the S&P 500 continues to rise).
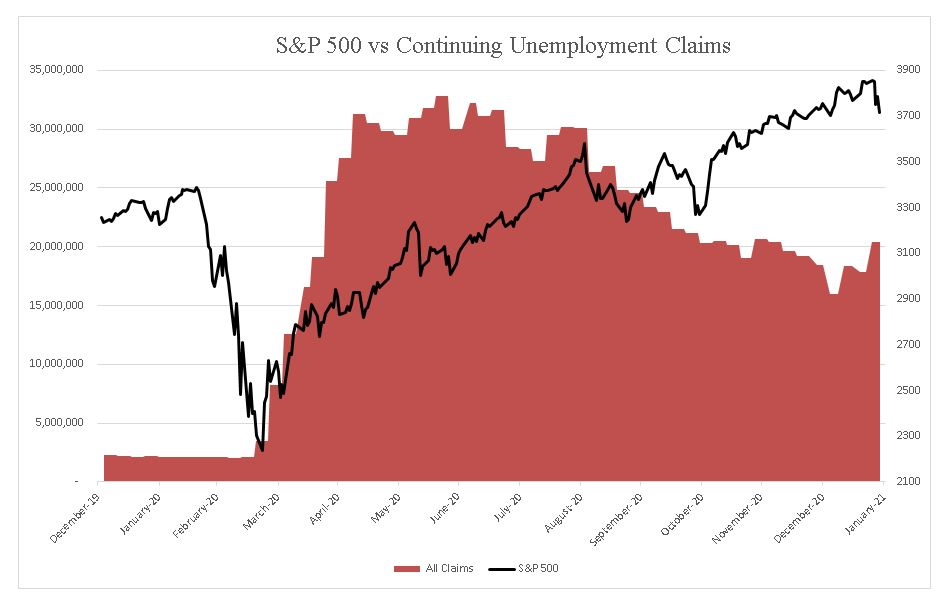
Source: CIG using data from Yahoo Finance and the U.S. Department of Labor[10]
In our view, either the economy picks up and unemployment moderates or stocks decline. Economic pick-up suggests inflation while stock declines may indicate a deflationary event like more COVID. Active Management seeks to avoid risk to your financial plan while a static allocation to stocks could mean some sleepless nights. How do we do that: a proprietary volatility signal to proactively add or subtract risk; extensive market technical analysis on indices and individual securities; a consultant who uses Natural Language Processing (NPL) on media sources to understand investor Zeitgeist; and value-added positions featuring disparities in value by asset class, sector and geography. Our Investment Committee meets bi-weekly to discuss these inputs, model potential outcomes, and agree on future actions.
From our Investment Committee discussion, here are the extremes that are possible given the excesses of the current market. Below is the inflation-adjusted S&P 500 Index (SPX, orange line) and Dow Jones Industrial Average (DJIA, blue) from 1958 to 1995. From the 1968 peak to the 1982 low, the SPX lost 65% of its inflation-adjusted value. It was not until 1993 that the inflation-adjusted SPX exceeded its 1968 peak! 1995 for the DJIA!
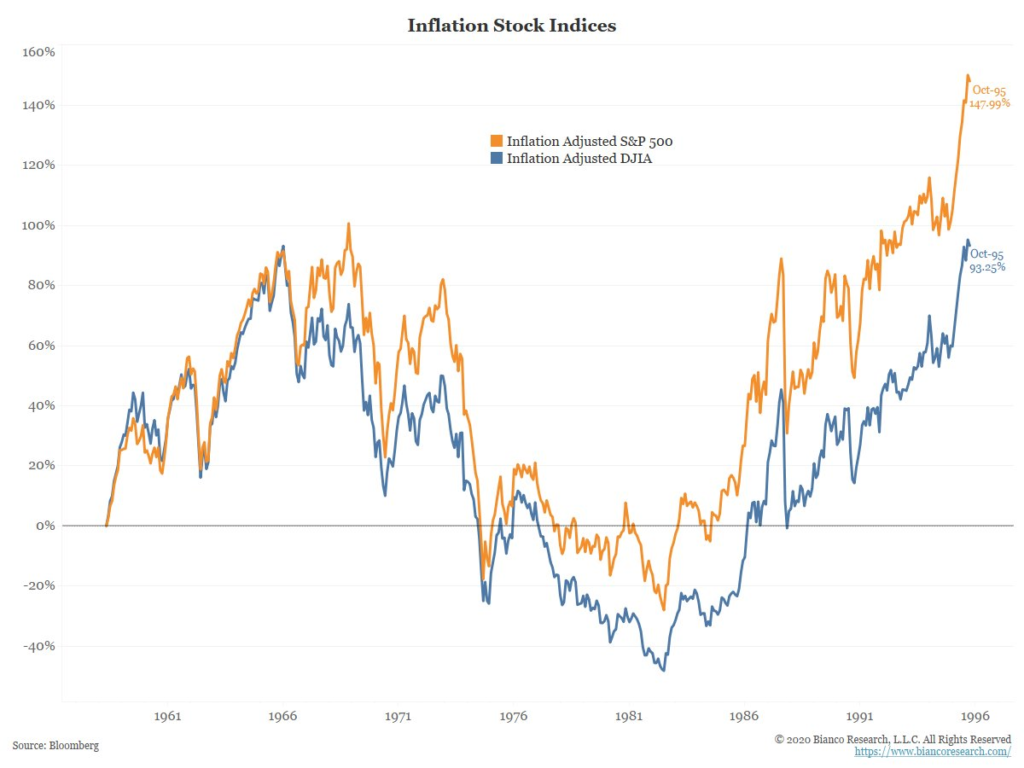
Source: Bianco Research LLC
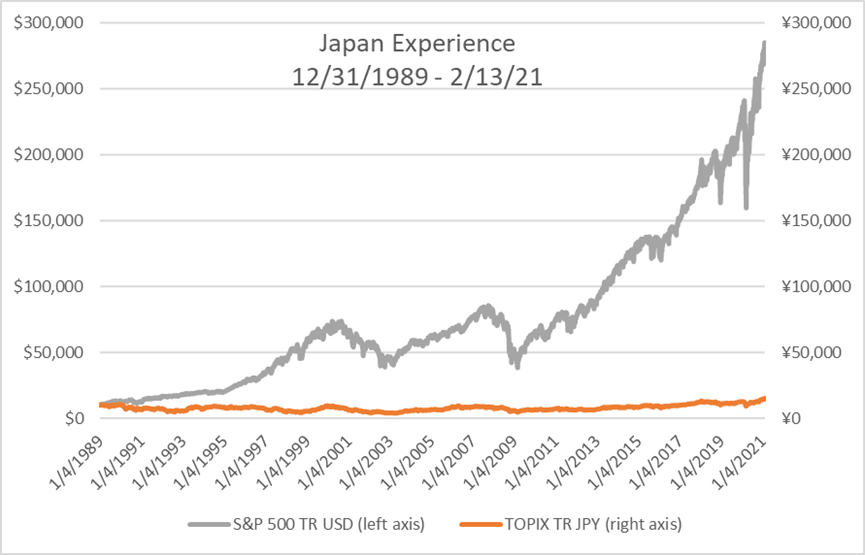
Below is the return of the Japanese stock market which experienced a long-term deflationary environment. Despite the stock market benefiting from the Bank of Japan’s huge stimulus drive, in which it has bought exchange traded funds (ETFs) and its monetary easing to drive down the yen, helping exporters, the annualized return is 1.30%[11] from 12/31/89 to 2/13/21. After 30 years, this market is only now reaching new highs.
We are always striving for a balanced view. From these discussions, striking the right aggressiveness
versus defensiveness incorporates the possibility that corporate profits could boom in 2021 based on some significant lifts to economic activity:
- Massive global monetary stimulus.
- Vaccine inspired economic recovery.
- The housing boom and higher consumer net
worth. - A declining US Dollar to support
multi-national companies.
Of course, risks to the outlook include:
- Inflation accelerates, bond yields surge, and the Fed hints at tapering sooner than expected.
- COVID gets out of control, vaccinations hit some bumps in the road, and the global economy is impacted, even China.
Success
Due to the above, now more important than ever is to have a professional fiduciary looking out with you for your monetary interest. It is so easy at this stage, to miss the disconnect between the real-world economy and the stock market and be tempted to chase stock valuations that as a whole,
are trading near all-time highs based on many historical measures. One could follow narratives like, “stocks only go up over the long term” while listening to CNBC and ever bullish Wall Street strategists and act against your best interest. The recent GameStop affair is the best example. If you are investing
based on this information, likely your maximum regret would be not participating in the last leg up in these markets.
In contrast, we’ve talked a lot about risk balancing. In practical terms, we do not want to fight the Federal Reserve, run for the hills, or make judgments on how others make money. Rather it is important to be in the market and have the proper intellectual and emotional distance to achieve client goals while avoiding scenarios and regimes that can damage your long-term success. We believe your true maximum regret would be not being able to retire, donate or spend when you choose.
In 2021, minimizing this maximum regret is of greatest importance to us at CIG. In our view, either the economy picks up or stocks decline. Economic pick-up suggests inflation while stock declines portend a deflationary event like more COVID. Our preference is for better economic growth without excess inflation. Continuing our theme for 2020 – “The Ride”[12], we will keep on actively managing the portfolios and applying the risk balancing framework to help clients achieve their goals and sleep well at night.
[1] https://www.hussmanfunds.com/comment/mc210201/
[2] https://en.wikipedia.org/wiki/There_are_known_knowns
[3] https://finance.yahoo.com/quote/%5EGSPC?p=%5EGSPC
[4] Source: Morningstar as calculated by CIG
[5] https://lab.credit-suisse.com/#/en/index/CSLAB/CSLAB/overview
[6] Source: Morningstar
[7] https://fred.stlouisfed.org/graph/?g=B6jj
[8] https://fred.stlouisfed.org/graph/?g=B6mv
[9] Gavekal Research/ Macrobond
[10] https://www.washingtonpost.com/business/2020/12/31/stock-market-record-2020/
[11] https://www.dol.gov/sites/dolgov/files/OPA/newsreleases/ui-claims/20210261.pdf
[12] Source: Morningstar
[13] https://cigcapitaladvisors.com/june-2020-asset-management-update-the-ride/
This report was prepared by CIG Asset Management and reflects the current opinion of the authors. It is based upon sources and data believed to be accurate and reliable. Opinions and forward-looking statements expressed are subject to change without notice. This information does not constitute a solicitation or an offer to buy or sell any security.

CIG Asset Management Update December 2020: Farewell 2020
Summary:
- Global stocks built on November’s gains notwithstanding lackluster economic news
- Two large IPOs reflect the extent of FOMO (Fear of Missing Out)
- Positives: The coronavirus vaccine rollout, U.S. stimulus bill finally passed and Great Britain reached Brexit deal
Commentary:
In December 2020, the S&P 500 Index was up +3.7%[i] while the international stocks, as measured by the MSCI EAFE Index Net, gained +4.6%. Emerging Market stocks (MSCI EM) returned +7.2%[ii]. Certain areas of the market continued November’s large gains. Small-cap stocks, represented by the Russell 2000 Index were up +8.7%[iii]. Crude oil added +7.0% to the prior month’s +26.7% gain and Gold was up +6.6%[iv].
As equity valuations continued to trade near all-time highs, U.S. economic data continues to be lackluster. The BLS November Employment Situation Summary showed a gain of only +245,000 jobs versus analysts estimated +440,000[v]. Retail sales for the month of November were down -1.1%[vi].
“Fear Of Missing Out (FOMO)” was exemplified this past month in two red hot IPOs. DoorDash gained +86% and AirBNB’s shares soared +113% on their first day of trading. There was such frenetic buying of Airbnb shares that investors mistakenly clamored to buy call options on ABB, a large European industrial company.[vii] This type of speculative activity continues in the equity markets as the Federal Reserve continues to create more liquidity. Federal Reserve Chairman Jerome Powell said, “Our guidance is outcome-based and is tied to progress toward reaching our employment and inflation goals. Thus, if progress toward our goals were to slow, the guidance would convey our intention to increase policy accommodation through a lower expected path of the federal funds rate, and a higher expected path of the balance sheet.”[viii] Investors seem to believe that the Federal Reserve will come to the rescue and provide even more liquidity if the economy slows.
Several positive events transpired regarding Covid-19. Mid-month, the Pfizer vaccine was rolled out in the United States and United Kingdom. President Trump signed a $900 billion stimulus bill to aid struggling Americans[ix]. Also on a positive note, Great Britain reached a Brexit deal with the European Union on Christmas Eve[x]. Negative events in December included Facebook being sued by the Federal Trade Commision and 48 states[xi] and Apple announcing that it was closing all of its California stores due to the rampant spread of the virus. On January 4, Prime Minister Boris Johnson announced a countrywide lockdown in the UK effective through mid-February as a mutated strain of Covid-19 hit the country hard[xii]. It remains to be seen how hard this latest shutdown action will effect the European economy.
As we start the new year, we remain focused on the big picture. The U.S. stock market continues to be overvalued and equal to over 187% of the country’s GDP[xiii]. Beyond valuation, we keep on being concerned that the markets appear to be divorced from socioeconomic reality. On Wednesday, January 6, the Dow Jones Industrial Average finished at a record high and the Russell 2000 Index was up almost 4% despite the U.S. Capital being breached and the national guard being called out.
Consequently, we continue to apply diversification and vigulent risk management in client portfolios. We endeavor to reach a balance between offense and defense positions to take just enough risk to generate attractive returns to meet client financial goals in these very uncertain times. On Christmas Eve, we added an equity holding to growth and balanced portfolios that may benefit from people working and shopping from home.
We bid the year 2020 adieu and are hopeful as we enter 2021 that vaccines prove to be effective combating the pandemic and the global economy continues to recover. We look forward to taking advantage of positive developments as 2021 progresses.
This report was prepared by CIG Asset Management and reflects the current opinion of the authors. It is based upon sources and data believed to be accurate and reliable. Opinions and forward-looking statements expressed are subject to change without notice. This information does not constitute a solicitation or an offer to buy or sell any security.
[i] https://finance.yahoo.com/
[ii] https://www.msci.com/end-of-day-data-search
[iii] https://www.ftserussell.com
[iv] https://finance.yahoo.com/
[v] https://www.bls.gov/news.release/empsit.nr0.htm
[vi] https://www.census.gov/retail/marts/www/marts_current.pdf
[vii] Barron’s “From Airbnb to Tesla, It’s Starting to Feel Like 1999 All Over Again. It May End the Same Way.” 12/11/2020
[viii] https://www.cnbc.com/2020/12/16/fed-meeting-live-updates-watch-jerome-powell-speech.html
[ix] https://www.washingtonpost.com/us-policy/2020/12/27/trump-stimulus-shutdown-congress/
[x] https://fortune.com/2020/12/24/after-years-of-negotiations-the-u-k-has-finally-reached-a-christmas-eve-trade-deal-with-the-eu/
[xi] https://www.ftc.gov/news-events/press-releases/2020/12/ftc-sues-facebook-illegal-monopolization
[xii] https://www.cnn.com/2021/01/04/uk/uk-lockdown-covid-19-boris-johnson-intl/index.html

CIG in the News: MarketWatch, “Three ways to maximize your wealth”
With rising taxes and inflation likely on the horizon, what are you doing to adjust your wealth management plan? CIG Capital Advisors’ managing principal Osman Minkara outlines a three-bucket strategy to help you prepare in MarketWatch.

CIG Asset Management Update November 2020: Change and Balance
Summary:
- November was an extraordinary month for stocks globally.
- 0% interest rates and a 64% increase in the money supply create months of speculation, like November.
- Our most important job is to balance the amount of offensive and defensive investments in portfolios given an uncertain near-term future.
Commentary:
Positive vacine news from Pfizer, Moderna and AstraZeneca helped make November an extraordinary month for stocks globally, despite the pandemic still raging in many areas.
Last month, the S&P 500 Index was up +10.8%[i] while the international stocks, as measured by the MSCI EAFE Index Net, gained +15.5%[ii]. Emerging Market stocks (MSCI EM) returned +9.3%[iii]. The standout country returns were two long-term laggards – Spain and Brazil (as calculated by MSCI) – which both increased in the neighborhood of +30%[iv]. Some of the most beaten-down areas of the U.S. market soared in November, including small companies, energy, financials and industrials[v]. CIG’s client accounts tied to growth and balanced approaches generally had one of their best months in the last five years.
Where do we go from here? Near-term performance can be notoriously difficult to predict. As we mentioned in our October update, underneath the surface of a post-election rising market tide, our measures of the underlying health of the markets continue to worsen. For example, on a small scale, recently Zoom Media (ZM) was down more than -15% one day – despite being an essential tool for many and beating investor expectations seemingly on almost every conceivable metric[vi]. When good news doesn’t translate into good stock returns but rather a sharp decline, we perk up our ears.
We, however, remain focused on the big picture. Global stock markets are now worth over $100 trillion, rising to a record high[vii] and equal to 115% of global Gross Domestic Product (GDP), i.e., the sum of all the goods and services produced[viii]. In the U.S., the stock market is unprecidentally expensive and equal to over 180% of the country’s GDP[ix]. While there is great variability about the future, it is likely a mistake to not be careful and thoughtful when buying stocks this expensive.
In markets like November, where the “Fear Of Missing Out (FOMO)” is seemingly driving participants, indepth study of stocks and economies are displaced by emotional biases which are supported by 0% interest rates and a 64% increase in the money supply[x] by the Central Banks. Such speculative behavior is the nature of market cycles and one of the primary elements necessary to create the proper setting for an eventual reversion or change. Last month, we discussed how it appeared that investors in October started to choose between decelerating and expensive large companies versus opportunities in growing and cheaper small companies. Small cap stocks, as measured by the Russell 2000 Index, had their best month ever in November 2020 and gained 18.3%[xi]. Overall, small company stocks are up dramatically off the March 2020 lows[xii] when we added to investments there. While still unconfirmed, evidence of change appears to be beginning.
Our most important question today is how the balance should be set today between aggressiveness and defensiveness in clients portfolios to take just enough risk to generate attractive returns to meet their financial goals in these very uncertain times. Then, how do we apply an active tactical approach and find undervalued investments that are poised to enter a period of market outperformance like the cheaper small companies mentioned above and where client portfolios already have some investments. All year, we have had a plan for more offensive investments if the economy does get better as well as a plan for the opposite outcome. In December, we added to an investment which we expect would increase in value if people stay and shop at home more. As always, we will continue to apply diversification and balance between the appropriate risk and returns.
Please be well and stay safe. We are encouraged by the latest vaccine results but expect a dark, uncertain winter. We suggest continuing to monitor the Johns Hopkins University’s Daily COVID-19 Data in Motion video.
This report was prepared by CIG Asset Management and reflects the current opinion of the authors. It is based upon sources and data believed to be accurate and reliable. Opinions and forward-looking statements expressed are subject to change without notice. This information does not constitute a solicitation or an offer to buy or sell any security.
[i] https://finance.yahoo.com/
[ii] https://www.msci.com/end-of-day-data-search
[iii] https://www.msci.com/end-of-day-data-search
[iv] https://www.msci.com/end-of-day-data-search. MSCI Spain Index Net and Brazil ADR Index Net.
[vi] https://finance.yahoo.com/quote/ZM/history?p=ZM
[vii] https://www.reuters.com/article/us-global-markets/world-shares-hold-close-to-record-highs-u-s-markets-close-for-thanksgiving-idUSKBN28601F
[viii] Bloomberg. WCAUWRLD Index as of 12/5/2020.
[ix] https://www.gurufocus.com/stock-market-valuations.php
[x] https://fred.stlouisfed.org/series/M1
[xi] https://finance.yahoo.com/
[xii] https://finance.yahoo.com/quote/%5ERUT/history?p=%5ERUT

CIG in the News: Marketwatch, “How to cut tax bills with smart charitable giving strategies”
As we enter the holiday season, plans for charitable giving are moving to the forefront. This year, the pandemic has reduced giving opportunities while simultaneously increasing need, causing donors to carefully review philanthropic options that include tax advantages. CIG Capital Advisors’ Senior Wealth Managers Eldin Foco and Martin Swiecki outline two strategies to consider in MarketWatch:
How to cut tax bills with smart charitable giving strategies
As we enter the holiday season, many naturally turn their thoughts to charitable giving. This year —clearly a highly unusual one in so many ways — there is even more need to carefully review philanthropic options that also have tax advantages. Click here to read more.


CIG Asset Management Update October 2020: A New Hope?
Summary:
- Diversifying to include Emerging Markets helps in tough month for Developed Markets.i,ii,iii
- Continued worries about rising COVID-19 cases and the economy.iv
- Narratives appear to be shifting as more evidence of a potential market inflexion point.
Commentary:
Globally, this month was tough for Developed Markets and not for Emerging Markets. In October, returns for the S&P 500 were -2.8%[i] and MSCI EAFE was -4.1%[ii] while the MSCI Emering Markets was +2.0%[iii]. It was the second month in a row of monthly declines in U.S. equities. As mentioned before, we continue to employ diversification specifically to areas like Emerging Markets to potentially cushion against U.S. equity losses as in October.
Overall, Developed Markets suffered from increasing COVID-19 cases[iv] and in the U.S., diminished hopes of a pre-election stimulus package. The month culminated with a -5.6%[v] sell off during the last week when technology earnings missed expectations, with Microsoft disappointing most in our opinion.
Underneath the surface of a post-election rising market tide, the relative price movement in sectors and investing styles (Factors) appears staggering. Our broad measures of the underlying health of the market continue to worsen. Events happen daily that have either likely never happened before or not happened in a long time. For example, on November 4, the Dow Jones Transportation sector had its worst day relative to the S&P 500 since April 2009, down almost -4%[vi]. Growth had its best day versus Value (using Russell 1000 indices as proxies) since January 2001 – almost 20 years![vii] In our opinion, the market narrative appears to be that the Federal Reserve has everything under control and that it has “got your back.” Meanwhile, we continue to worry about how COVID-19 will affect the economy this winter given the explosion of cases shown by the Johns Hopkins University’s Daily COVID-19 Data in Motion.
In October, we saw the beginnings of a narrative shift to a scenario that reminds us of 2000, similar to what we discussed in our August update. In that market cycle, the technology bubble was formed by companies from buying to prepare for the risk that at the stroke of midnight on January 1, 2000 their computers would be unable to function. In 2020, companies and individuals spent on technology to work from home during a pandemic. In both cases, decelerating earnings occurred once priorities shifted away from investments in technology. Last month, it appeared that investors started to choose between decelerating and expensive large companies versus opportunities in growing and cheaper small companies where client portfolios have some investments. Specifically, the Russell 1000 Growth Index (large) lost -4.7%i versus the Russell 2000 Index (small) gained 3.4%i in October. This shift is potentially bullish for CIG’s portfolios and less so for investors indulging in passive investments[viii].
We would like to thank our clients and friends for their continued trust and support, as well as to respectfully encourage all to focus on the positives on Thanksgiving Day. Obviously, 2020 has been an excruciatingly difficult year for many of us and it continues with the contested election and the division in the country. However, we have a newfound appreciation for going to family gatherings, restaurants and sporting events, for more frequent phone calls with elders, and for being able to see our children during the workday at home.
Lastly, we suggest that you listen to the replay of our webinar “Keeping your Financial Plans Alive Amid Chaos.” We discuss the challenges, opportunities and questions ahead as we navigate the current and future market conditions.
This report was prepared by CIG Asset Management and reflects the current opinion of the authors. It is based upon sources and data believed to be accurate and reliable. Opinions and forward-looking statements expressed are subject to change without notice. This information does not constitute a solicitation or an offer to buy or sell any security.
SOURCES:
[i] Yahoo Finance
[ii] https://www.msci.com/end-of-day-data-search
[iii] https://www.msci.com/end-of-day-data-search
[iv] https://coronavirus.jhu.edu/covid-19-daily-video
[v] Calculated by CIG using data from Yahoo Finance for 10/23 to 10/30.
[vi] Research report from Epsilon Theory, “The King is Dead. Long Live the King” dated 11/5/20.
[vii] Research report from Epsilon Theory, “The King is Dead. Long Live the King” dated 11/5/20.
[viii] While small companies as measured by the Russell 2000 small-cap index has had six 10%+ multi-day moves in 2020, per Bespoke Investment Group, the number of underlying companies with negative profits appears to be quite large relative to history and could pose a problem if investors just buy the index versus those stocks which have positive earnings.


CIG Asset Management Update September 2020: Continuing Stimulus Hope
Summary:
- Stocks fell in September as big technology companies faltered [i] .
- COVID-19 deaths hit a grim milestone in the U.S. and increased around the world [v] .
- The markets traded up or down based upon the probability of a new stimulus bill.
Commentary:
The S&P 500 declined -3.9% and the tech-heavy NASDAQ dropped -5.2%.[i] Outside of the U.S., developed markets, as measured by the MSCI EAFE net, were down -2.9% and the MSCI Emerging Markets Index retreated -1.8%.[ii] Little protection was offered by Gold as it moved -4.1% lower as the US Dollar Index gained +1.9%.[iii] Fixed income (the Barclays U.S. Aggregate Total Return Index) returned -0.1% and the Barclays U.S. High Yield Index fell -1.0% for the month.[iv]
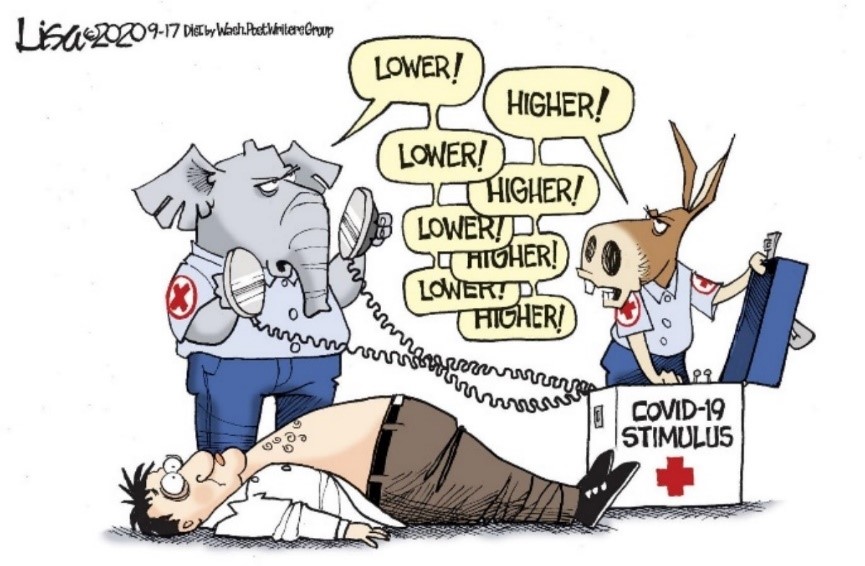
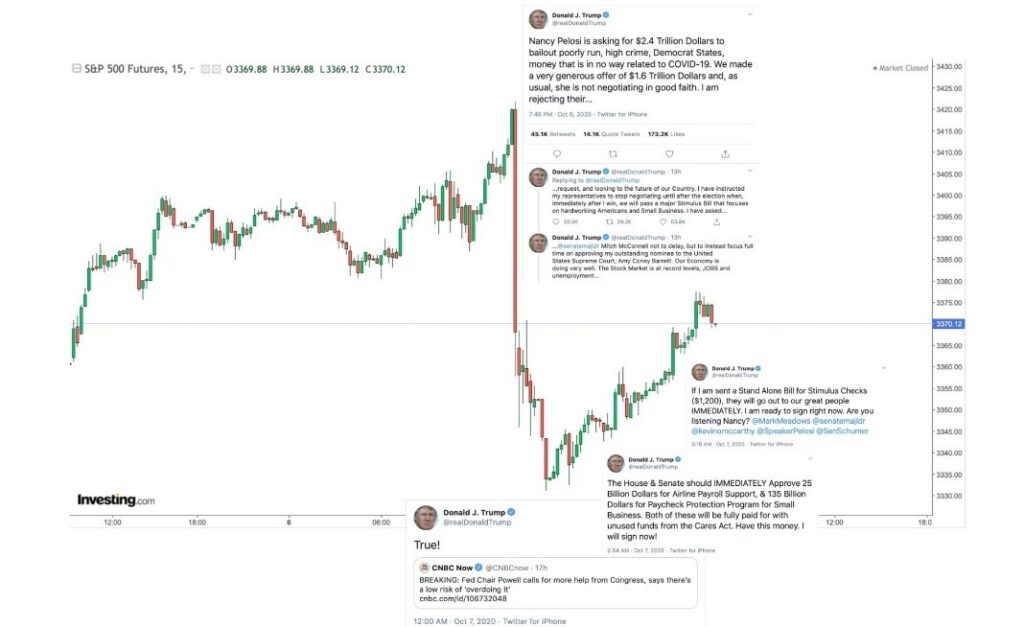
Republicans and Democrats struggled to come to an agreement to provide more stimulus to the economy. Republicans in the Senate were unable to pass their own “skinny” stimulus bill on September 10. Meanwhile, markets traded lower throughout the month as the COVID-19 death toll in the United States continued to increase and finally surpassed 200,000 on September 22.[v] Over the following two days, there were no less than sixteen Federal Reserve speeches in two days, but investors were unimpressed. Fed speakers reasserted that the Fed will do what it takes to support the economy and cautioned that what is really needed right now is more fiscal stimulus. On September 25, economy re-opening hopes blossomed when Governor DeSantis announced on that he was lifting all restrictions on the Florida economy. The following Monday, stimulus hopes were re-ignited as Speaker of the House Nancy Pelosi said she was hopeful to get a $2.4 trillion coronavirus stimulus bill passed.
September’s weakness in equities and their back and forth nature keep investors on notice that both the financial markets and the economy remain on thin ice. Uncertainty abounds and volatility could increase dramatically on short notice, especially as the election nears. Investors’ latest reminder was on October 6, when these stimulus machinations whipsawed the markets again.
We continue to employ diversification, discipline and flexibility in managing client portfolios to potentially avoid air pockets like the one above. Our focus on clients’ long term financial plans remains paramount.
Please join the team at CIG Capital Advisors for an engaging discussion looking at the challenges, opportunities and questions ahead as we navigate the current and future market conditions:
WEBINAR: “Keeping your Financial Plans Alive Amid Chaos”
Tuesday, October 20 at 6 p.m.

This report was prepared by CIG Asset Management and reflects the current opinion of the authors. It is based upon sources and data believed to be accurate and reliable. Opinions and forward-looking statements expressed are subject to change without notice. This information does not constitute a solicitation or an offer to buy or sell any security.
[i] Calculated from data obtained from Yahoo Finance, as of September 30, 2020
[ii] MSCI, as of September 30, 2020
[iii] Calculated from data obtained from Yahoo Finance, as of September 30, 2020
[iv] Calculated from data obtained from Bloomberg, as of September 30, 2020
[v] John Hopkins / NPR September 22, 2020

Risks of Improper Titling and Inadequate Asset Protection
Physicians are acutely aware of liability risks and the exposure of personal assets to the claims of creditors. Given the publicity of large malpractice verdicts and the incessant amount of malpractice-related attorney advertising, this concern is understandable. However, malpractice liability is hardly the only financial risk that physicians face.
Although physicians may be inclined to view an asset-protection strategy in the context of a medical malpractice claim, physicians can pay or lose money as the result of the many non-malpractice liability claims, including:
- uninsured or underinsured casualty losses;
- ill-advised investments;
- personal guarantees of business obligations;
- alimony and property payments that could have been minimized with a pre-nuptial agreement;
- uninsured sexual harassment claims;
- estate taxes caused by inadequate estate planning;
- victimization by fraud;
- liability for breach of fiduciary duty (e.g., ERISA claims, director or officer liability); and
- indemnification obligations.
A comprehensive asset-protection strategy for a physician could include any of the following depending on the financial complexity of each physician. Some of these include but are not limited to:
- Adequate Insurance Coverage
- Proper Titling/Transfer of Ownership of Assets Within a Family
- Exempt Asset Creation
- Creation of FLP and FLLC
- Asset-protection Trusts
- Propper Retirement Plan Assets (ERISA vs non)
- Avoidance of Indemnification Obligations
Despite the widespread adoption of state law tort reform, physicians continue to be greatly concerned with asset-protection issues. In addressing this concern, two factors should be kept in mind. First, the malpractice plaintiff is far from the only potential threat to the financial well-being of a physician. Secondly, an asset-protection strategy should be integrated into an overall financial and estate planning program to help ensure appropriate strategies are selected.
To evaluate your titling and asset protection risks, contact the CIG Wealth Management team to schedule a complimentary consultation.

Physicians may consider a CLAT (Charitable Lead Annuity Trust) as a tax-saving strategy
The combination of a low key interest rate and a large influx of cash some physician-owners may experience, after, for instance, selling his or her private practice, could make a CLAT (Charitable Lead Annuity Trust) a desirable vehicle for tax- and legacy-planning purposes.
An illustrative case* involves a hypothetical physician-owner selling his practice and sheltering $500,000 of the proceeds in a CLAT. You can see, in the flow chart below, that the one-time contribution of $500,000 to the CLAT allows for an annual gift to the charity of his choice of $26,117 over the next 20 years, and then an eventual tax-free gift at the end of those 20 years of $864,158 to the beneficiary of his choice:
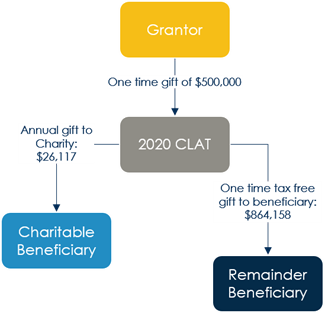
This is, of course, a hypothetical example not indicative of any particular client, with a 7% annualized growth rate assumption over 20 years. What makes this strategy relative is that it relies on a favorable IRS 7520 rate to take advantage of an arbitrage opportunity. Right now, the IRS 7520 rate is extremely low, but those rates do fluctuate, as you can see in the table below:

An IRS 7520 interest rate of 3.6% vs. 0.42% can impact the trust’s remainder value by almost $400,000 ($479,518 using December 2018’s rate vs. $864,158 using August 2020’s rate), as in our case study of the $500,000 CLAT.
Please contact our wealth management team in order to properly evaluate if this strategy is right for you and begin the financial planning process. Please speak to your tax professional to understand the cost and tax implications of your particular giving situation.
*All case studies and references are hypothetical examples developed by the CIG Capital Advisors team and the values shown are not intended to represent those of a client or known person. Assumes annualized growth rate of 7%.