CIG Asset Management Update August 2020: A Reminiscence of a Bubble Past
The S&P 500 recorded its best August return since 1986, up +7%. The S&P5, the so called FAAMG stocks, provided a majority of the S&P return for the month[i]. Developed market stocks, excluding the U.S., as measured by the MSCI EAFE Index, rose 4.9% and the MSCI Emerging Markets Index gained 2.1%[ii]. Domestic fixed income measured by the Bloomberg Barclays Aggregate, was down -0.8%[iii]. The trade-weighted U.S. dollar index continued its decline, falling an additional -1.3% in August[iv].
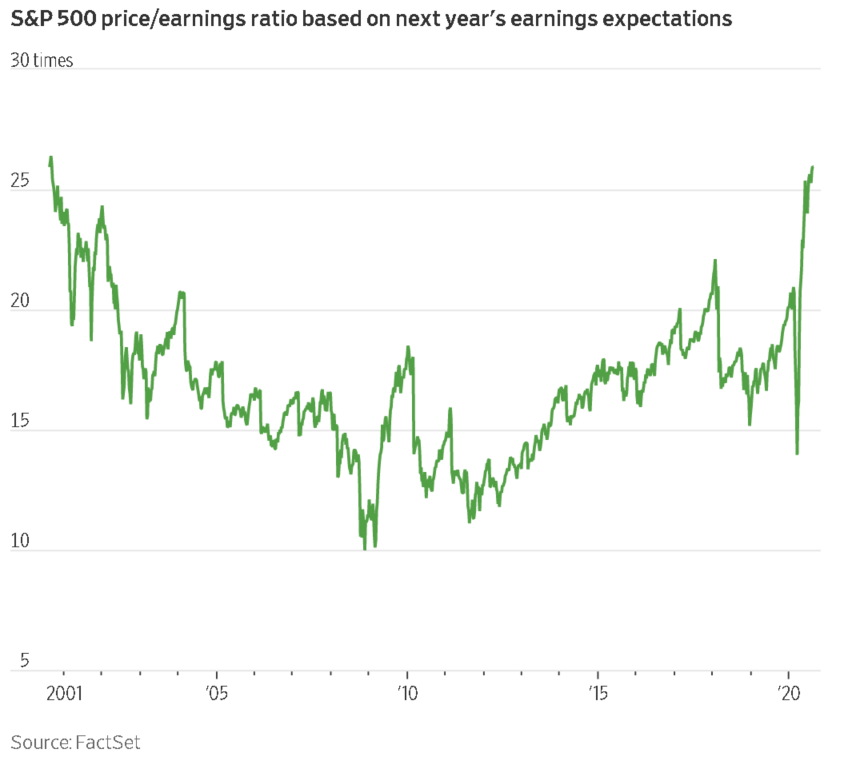
As we have pointed out in previous letters, stock market valuation had already reached lofty levels as measured by overall stock market capitalization versus the size of the economy (market cap/GDP). In July, we reached 171%, eclipsing the level of the Dotcom boom in March of 2000, and it has continued to grow to 178% as of this writing[v]. A perhaps more relatable valuation metric has also reached record highs: The forward price to earnings multiple on the S&P 500 is above 26, the same level reached in March 2000. March 2000 was also the peak of the market[vi].

We have vivid recollections of the Dotcom boom and the following bust from 1999 to 2002. Strangely enough, we are currently seeing many other similarities to that era 20 years ago. In addition to comparable record market valuations as illustrated to the right, we have talked at length about the lack of breadth in the market, that a very few number of stocks are providing most of the returns for the indices. This also occurred during the Dotcom bubble. Twenty years ago it was, similar to today, technology providing the majority of the returns.
Additional events in August remind us of that era 20 years ago. During the Dotcom boom, companies would add “.com” to their name to significantly boost their stock return and participate in the bubble. Yes, it really happened and we lived through it. Three professors from the University of Purdue published a study, “A Rose.com by Any Other Name” in the December 2001 issue of The Journal of Finance, that showed company managements could increase their stock price by about 74% in the 10 days after announcing that they were adding “.com” to their name! Imagine our sense of déjà vu when Walmart announced on August 27 that it was teaming up with Microsoft to bid for TikTok, a social media platform. Walmart stock gained +4.5% on this announcement. Less than one week later on September 1, Walmart gained an additional +6% as it announced it will launch a membership program similar to Amazon Prime later in the month[vii]. Walmart has traditionally been viewed as an old-school brick and mortar retailer. It appears they are trying to change that perception.
Another phenomenon during the Dotcom bubble was to split your stock into more shares, which in many cases helped to drive the price higher. Apple announced a 4-for-1 stock split on 7/30/2020. Tesla announced a 5-for-1 stock split on 8/11/2020. From the announcement of each stock split to August 31, Apple gained +34% and Tesla gained +81%[viii]. These high gains were in spite of the fact that a stock split simply lowers the price for a share of the company’s stock. A split does not add any economic value to the underlying company and investors can already buy fractional shares through many trading platforms. Ask yourself the following question: Would you like your pizza cut into 8 slices or 16? No matter how many slices you decide to cut the pizza into, you still have the same total amount. If non-value-additive stock splits and acquiring social media properties like TikTok juice your stock price, more company managements may likely be considering doing the same, but we would not rely on that as an investment strategy.
Just a couple of other similarities:
- The market has appreciated about 80% while normalized earnings have flat lined for four years. Going in to 2000, the same thing happened when the spread blew out to 70%[ix].
- The valuation gap between high valuation stocks (29x earnings) and low valuation stocks (10x earnings) remains wide and similar to 2000[x].
- The number of stocks trading over 10x revenues in the Russell 3000 is more than 400, like the year 2000. That means for a 10-year payback, the company needs to pay investors 100% of revenues for 10 straight years in dividends regardless of the cost of goods sold, payroll, taxes, etc[xi].
Where do we go from here? As of August 31, 20 of 22 prominent Wall Street strategists have a year-end 2020 price target for the S&P 500 at or below the closing price of the index[xii]. Valuations did not matter during the Dotcom bubble of 1999 – 2000 until suddenly they did, after Labor Day 2000. Then the narratives about the market and specific “darling” stocks that everyone believed that everyone believed broke. It took two years for the market to reach bottom after the bubble burst. The S&P 500 lost 50% and the NASDAQ lost 78% from the March 2000 peak to the October 2002 low[xiii].
To paraphrase the great Yogi Berra, it’s tough to make
predictions, especially about the future – of what very well may be the largest
financial bubble of all times. That said, market conditions are likely continue
to be volatile for some time. Volatility usually means that we are nearing an
inflection point. We feel strongly that having our safety nets up, bracing for some potential steep air-pockets,
and refraining from speculation in the hyper-valued growth stocks that we are
seeing like Apple and Tesla, is the correct way to be positioned as we wait for
the inflection to present new opportunities. Historically, outsized returns in out-of-favor
areas can appear swiftly and dramatically. If such a move occurs from growth to
areas such as value, dividends and small caps, we are already invested there.
At the same time, we have a plan if the markets and the economy do get better,
likely leading to the bubble marching on.
[i] Calculated from data obtained from Yahoo Finance, as of August 31, 2020
[ii] MSCI, as of August 31, 2020
[iii] Calculated from data obtained from Bloomberg, as of August 31, 2020
[iv] Calculated from data obtained from Yahoo Finance, as of August 31, 2020
[v] https://www.gurufocus.com/stock-market-valuations.php as of September 14, 2020
[vi] Factset, September 1, 2020
[vii] Calculated from data obtained from Yahoo Finance, as of September 3, 2020
[viii] Calculated from data obtained from Yahoo Finance, as of August 31, 2020
[ix] Bloomberg Data from 01/01/1990 to 7/31/2020 via Invenomic Capital
[x] Goldman Sachs Investment Research. Data from 01/01/1985 to 6/25/2020
[xi] Bloomberg Data from 01/01/1997 to 07/31/2020 via Invenomic Capital
[xii] Bloomberg, as of August 31, 2020
[xiii] Calculated from data obtained from Yahoo Finance, as of August 31, 2020

CIG Asset Management Update June 2020: The Ride
The pandemic-infused markets have been a roller coaster ride during the first half of 2020. After a short climb in January and February, the S&P 500 Index fell by 35% in just over one month and then staggered back up the lift hill[i]. What twists and turns the market roller coaster will offer next is difficult to know.
Going forward, the best possible outcome in our opinion would be a widely available vaccine by year-end and everyone goes back to work. The U.S. would just need to figure out servicing trillions of additional government debt. Many worse outcomes would likely include no effective vaccine like most viruses, millions of permanent job losses, and enduring changes to business models in multiple industries.
When the market reached its high on June 8, our view was investors seemed to be focused predominantly on the best possible outcome. It is our opinion that the massive rally from the March 23 low was largely driven by “Stimulus” winning the tug-of-war over “COVID-19.” According to Cornerstone Macro, until last week when the European Union agreed to a unified stimulus fund which brought them in line, the U.S. has led the world in fiscal and monetary stimulus.[ii] But the U.S. has continued to lag the world in COVID-19 response. Only some emerging markets now have infection rate trends worse than those of the United States.[iii]
Regardless of any value judgment about the present situation, one could theoretically pull out the playbook for a traditional recession, review the history books, assess the probabilities/outcomes and lock in a portfolio for the next two years and perhaps experience a ride like Cedar Point’s kiddie coaster Woodstock Express.
If only more of us were alive back in the 1918 global pandemic and the structure of the economy, technology and banking had more resemblance to today’s world; if only probability theory could be easily be applied to a pandemic occurring in a non-ergodic, uncertain time, maybe we could do that. A non-ergodic system, such as this time, has no real long-term properties i.e., history is no help to predicting the future. It is prone to path dependency – which is just a fancy statistical way of saying that “THE RIDE is everything”.
Months like March keep us up at night. When we think about the markets, we are thinking about our goals, dreams, fears, and hopes. These long-term goals end up in the financial plan and are embedded in the portfolio strategy that our clients may select. Given a choice between being down -35% or losing -15% in March, many of us would choose -15%. At the same time, we try to stay focused on the long-term goals.
Now that we may be again back at the metaphorical top of the coaster’s lift hill, it is important to consider the next moves both prudently and imaginatively. Since June 8, the S&P 500 Index has been alternating between gains and losses around a 250-point range[iv]. There have been several 2%+ declines, including June 11’s -6% loss when Federal Reserve Chairman Powell said, “We’re not even thinking about raising rates” any time soon. Investors were distressed that the dovish Fed does not expect to raise rates until 2023. With almost 40 +/-2% days this year, the markets are on pace for the most swings since 1933[v]. For the month of June, the S&P 500 index returned just 1.8% while gaining 20.5% during the quarter (the best quarter since 1998)[vi].
For now, the stunning market rally from the March 23 low appears to have come to a pause in the U.S. Investors are back to that nervous feeling when checking the market each morning as if looking over the precipice of the rollercoaster’s first hill. What investors see is a stock market that is at peak valuations, as measured by total market capitalization / GDP (which we have talked about in the past)[vii]:

As the chart above clearly illustrates, there is no history that shows valuations over 150% to GDP are sustainable, even for brief periods of time. Yesterday, GDP for the second quarter was announced and the -33% annualized decrease was its worst quarterly hit since the Great Depression[viii]. With GDP falling from approximately $21.5 trillion to $19.4 trillion, valuations are now over 170% to GDP.
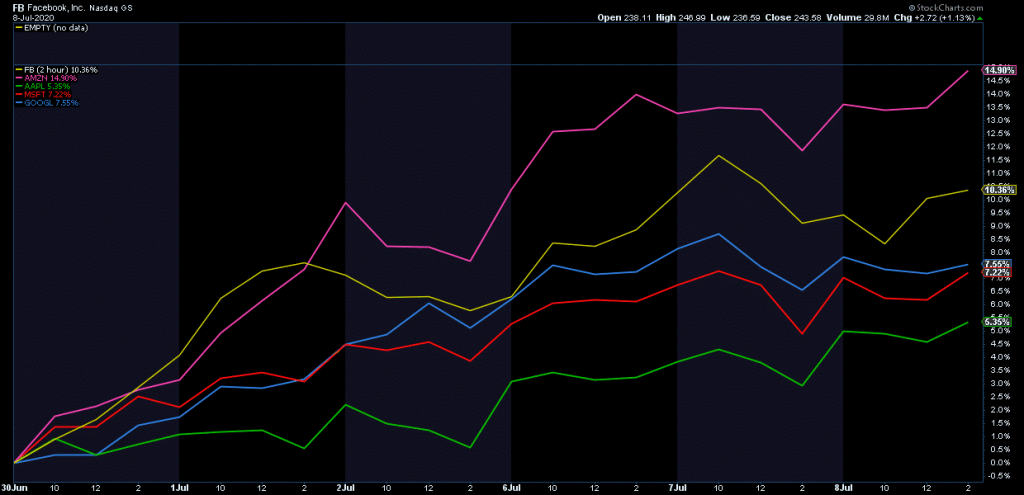
The S&P5, the so called FAAMG[ix] stocks, earlier this month added over a half a trillion in market cap in just 6 days. (Please see the chart[x] below showing the percentage return of these five stocks from June 29 to July 8.) In 2020, these stocks have added over $1.6 trillion in market cap[xi], a striking feat during any bull market with excellent growth, not a historic recession. Sure, some of these companies may have grabbed market share and pulled some sales forward during the shutdown but they all face anti-trust concerns which seem to be bi-partisan and international concerns. These stocks are disproportionately driving the market.

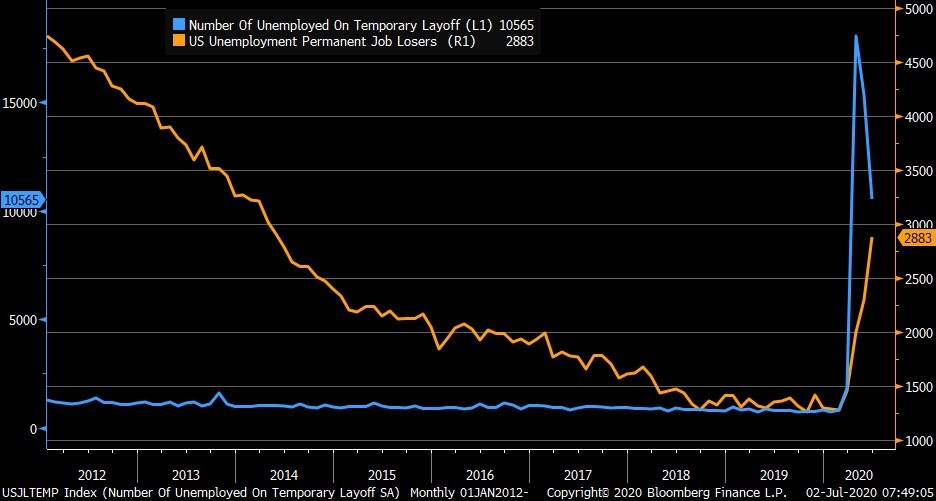
Certainly, economic data has seen a massive improvement from the recent historic collapses. However, it important to keep focused on year-over-year data and especially permanent job losses, which keep mounting. The chart[xii] below shows data from the US Department of Labor with the blue line indicating the number of temporarily laid off workers in the US and the yellow line displaying the number of permanently laid off workers.

Today, past experience is not unworkable, but if relied on thoughtlessly it can be hazardous. Some events will play out in the future as they have in the preceding times, but many will not. As indicated above, markets are rich and driven by a few stocks and simultaneously, the U.S. is experiencing some of the worst economic conditions in a long time.
Based upon CIG’s investment process and what we saw in the markets, we had fortunately already started to get more conservative in 2019 in the Strategic and Dynamic portfolios. Fast forward to 2020, at the beginning of February when the markets became more volatile, we acted within the Dynamic portfolios to reduce risk further, primarily by reducing the portfolios’ exposures to equities and adding to diversifying assets generally believed to be protective in a downdraft. We continued to act in March to attempt to dial-in the appropriate market exposure in the Dynamic portfolios, increasing risk, primarily by adding equities, after the market bottomed on March 23.
Hopefully, our strategic and tactical actions have allowed our clients to sleep better at night. CIG attempts in its client portfolios to get closer to the kiddie coaster experience versus the full rollercoaster ride of the S&P 500 index. The most important job is to strike the appropriate balance between offense and defense, i.e., the risk of losing money and the risk of missing opportunity. There will continue to be twists and turns along the ride but so far, all the previous scary rollercoaster rides in the market have concluded the same way: eventually, they stopped.
We will see in the coming months how the tug-of-war between Stimulus and COVID-19 plays out. There is probably nothing more path dependent than re-opening an economy in a pandemic. Let us hope for the best – a confidence-inspiring Goldilocks-style “not-too-fast / not-too-slow” opening, while also considering the myriad of possible economic and financial outcomes. Of course, never ignore the extreme risks which do not appear to be going away, especially as positive COVID-19 cases trend higher. We continue to be thoughtful, adaptable and at your service.
[i] Calculated from data obtained from Yahoo Finance, as of July 27, 2020
[ii] Cornerstone Macro, CSM Weekly Narrative, July 26, 2020, page 2.
[iii] Coronavirus.jhu.edu/map.html, as of July 30, 2020.
[iv] Calculated from data obtained from Yahoo Finance, as of July 27, 2020
[v] Bespoke Investment Group, July 2020
[vi] Calculated from data obtained from Yahoo Finance, as of July 27, 2020
[vii] Bloomberg as of July 30, 2020
[viii] Source: U.S. Bureau of Economic Analysis
[ix] Facebook, Apple, Amazon, Microsoft, Google
[x] StockCharts.com via NorthmanTrader on July 9, 2020
[xi] “Warning”, NorthmanTrader, July 9, 2020
[xii] U.S. Department of Labor via Bloomberg as of July 6, 2020.
