
CIG Asset Management Update September 2020: Continuing Stimulus Hope
Summary:
- Stocks fell in September as big technology companies faltered [i] .
- COVID-19 deaths hit a grim milestone in the U.S. and increased around the world [v] .
- The markets traded up or down based upon the probability of a new stimulus bill.
Commentary:
The S&P 500 declined -3.9% and the tech-heavy NASDAQ dropped -5.2%.[i] Outside of the U.S., developed markets, as measured by the MSCI EAFE net, were down -2.9% and the MSCI Emerging Markets Index retreated -1.8%.[ii] Little protection was offered by Gold as it moved -4.1% lower as the US Dollar Index gained +1.9%.[iii] Fixed income (the Barclays U.S. Aggregate Total Return Index) returned -0.1% and the Barclays U.S. High Yield Index fell -1.0% for the month.[iv]
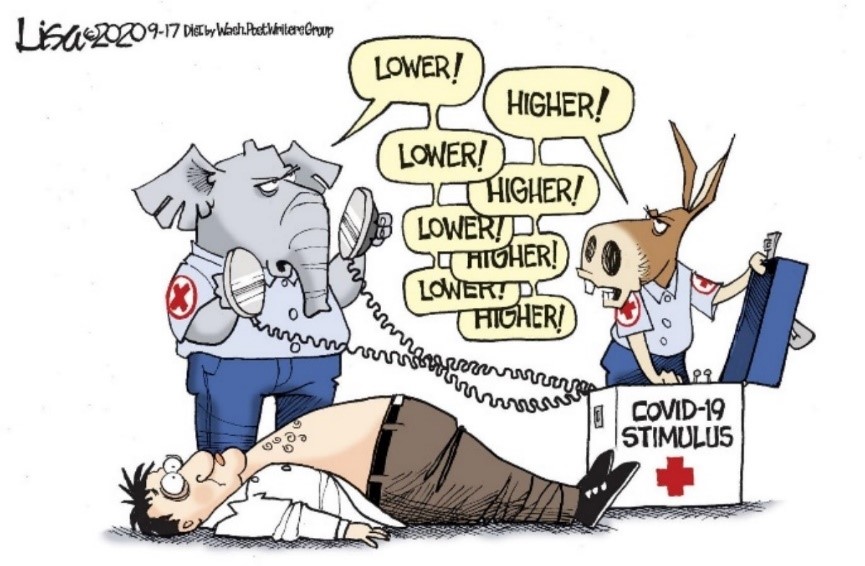
Republicans and Democrats struggled to come to an agreement to provide more stimulus to the economy. Republicans in the Senate were unable to pass their own “skinny” stimulus bill on September 10. Meanwhile, markets traded lower throughout the month as the COVID-19 death toll in the United States continued to increase and finally surpassed 200,000 on September 22.[v] Over the following two days, there were no less than sixteen Federal Reserve speeches in two days, but investors were unimpressed. Fed speakers reasserted that the Fed will do what it takes to support the economy and cautioned that what is really needed right now is more fiscal stimulus. On September 25, economy re-opening hopes blossomed when Governor DeSantis announced on that he was lifting all restrictions on the Florida economy. The following Monday, stimulus hopes were re-ignited as Speaker of the House Nancy Pelosi said she was hopeful to get a $2.4 trillion coronavirus stimulus bill passed.
September’s weakness in equities and their back and forth nature keep investors on notice that both the financial markets and the economy remain on thin ice. Uncertainty abounds and volatility could increase dramatically on short notice, especially as the election nears. Investors’ latest reminder was on October 6, when these stimulus machinations whipsawed the markets again.
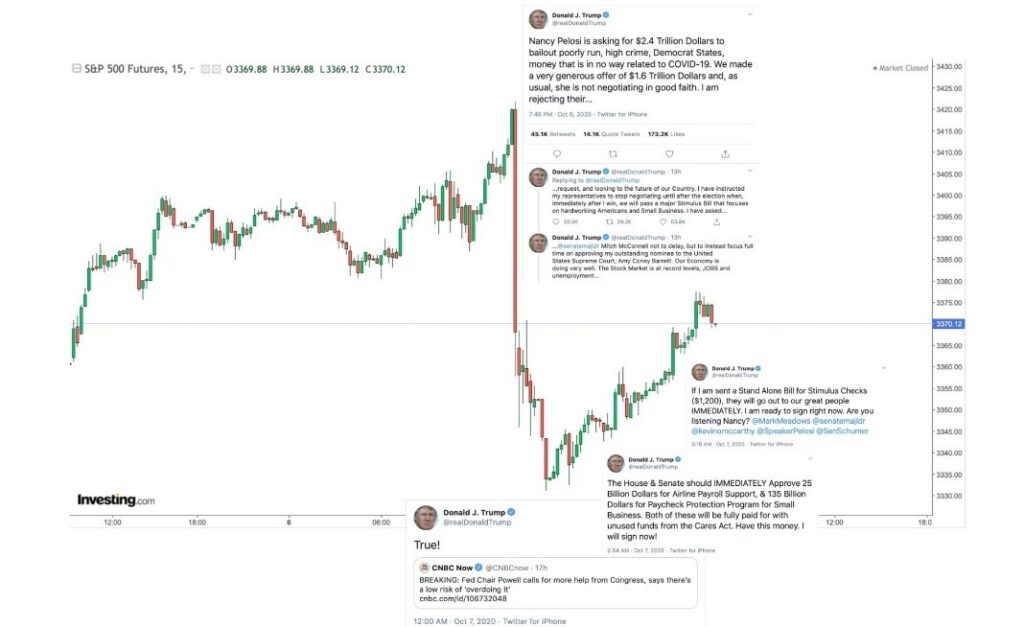
We continue to employ diversification, discipline and flexibility in managing client portfolios to potentially avoid air pockets like the one above. Our focus on clients’ long term financial plans remains paramount.
Please join the team at CIG Capital Advisors for an engaging discussion looking at the challenges, opportunities and questions ahead as we navigate the current and future market conditions:
WEBINAR: “Keeping your Financial Plans Alive Amid Chaos”
Tuesday, October 20 at 6 p.m.

This report was prepared by CIG Asset Management and reflects the current opinion of the authors. It is based upon sources and data believed to be accurate and reliable. Opinions and forward-looking statements expressed are subject to change without notice. This information does not constitute a solicitation or an offer to buy or sell any security.
[i] Calculated from data obtained from Yahoo Finance, as of September 30, 2020
[ii] MSCI, as of September 30, 2020
[iii] Calculated from data obtained from Yahoo Finance, as of September 30, 2020
[iv] Calculated from data obtained from Bloomberg, as of September 30, 2020
[v] John Hopkins / NPR September 22, 2020

CIG Asset Management Update June 2020: The Ride
The pandemic-infused markets have been a roller coaster ride during the first half of 2020. After a short climb in January and February, the S&P 500 Index fell by 35% in just over one month and then staggered back up the lift hill[i]. What twists and turns the market roller coaster will offer next is difficult to know.
Going forward, the best possible outcome in our opinion would be a widely available vaccine by year-end and everyone goes back to work. The U.S. would just need to figure out servicing trillions of additional government debt. Many worse outcomes would likely include no effective vaccine like most viruses, millions of permanent job losses, and enduring changes to business models in multiple industries.
When the market reached its high on June 8, our view was investors seemed to be focused predominantly on the best possible outcome. It is our opinion that the massive rally from the March 23 low was largely driven by “Stimulus” winning the tug-of-war over “COVID-19.” According to Cornerstone Macro, until last week when the European Union agreed to a unified stimulus fund which brought them in line, the U.S. has led the world in fiscal and monetary stimulus.[ii] But the U.S. has continued to lag the world in COVID-19 response. Only some emerging markets now have infection rate trends worse than those of the United States.[iii]
Regardless of any value judgment about the present situation, one could theoretically pull out the playbook for a traditional recession, review the history books, assess the probabilities/outcomes and lock in a portfolio for the next two years and perhaps experience a ride like Cedar Point’s kiddie coaster Woodstock Express.
If only more of us were alive back in the 1918 global pandemic and the structure of the economy, technology and banking had more resemblance to today’s world; if only probability theory could be easily be applied to a pandemic occurring in a non-ergodic, uncertain time, maybe we could do that. A non-ergodic system, such as this time, has no real long-term properties i.e., history is no help to predicting the future. It is prone to path dependency – which is just a fancy statistical way of saying that “THE RIDE is everything”.
Months like March keep us up at night. When we think about the markets, we are thinking about our goals, dreams, fears, and hopes. These long-term goals end up in the financial plan and are embedded in the portfolio strategy that our clients may select. Given a choice between being down -35% or losing -15% in March, many of us would choose -15%. At the same time, we try to stay focused on the long-term goals.
Now that we may be again back at the metaphorical top of the coaster’s lift hill, it is important to consider the next moves both prudently and imaginatively. Since June 8, the S&P 500 Index has been alternating between gains and losses around a 250-point range[iv]. There have been several 2%+ declines, including June 11’s -6% loss when Federal Reserve Chairman Powell said, “We’re not even thinking about raising rates” any time soon. Investors were distressed that the dovish Fed does not expect to raise rates until 2023. With almost 40 +/-2% days this year, the markets are on pace for the most swings since 1933[v]. For the month of June, the S&P 500 index returned just 1.8% while gaining 20.5% during the quarter (the best quarter since 1998)[vi].
For now, the stunning market rally from the March 23 low appears to have come to a pause in the U.S. Investors are back to that nervous feeling when checking the market each morning as if looking over the precipice of the rollercoaster’s first hill. What investors see is a stock market that is at peak valuations, as measured by total market capitalization / GDP (which we have talked about in the past)[vii]:

As the chart above clearly illustrates, there is no history that shows valuations over 150% to GDP are sustainable, even for brief periods of time. Yesterday, GDP for the second quarter was announced and the -33% annualized decrease was its worst quarterly hit since the Great Depression[viii]. With GDP falling from approximately $21.5 trillion to $19.4 trillion, valuations are now over 170% to GDP.
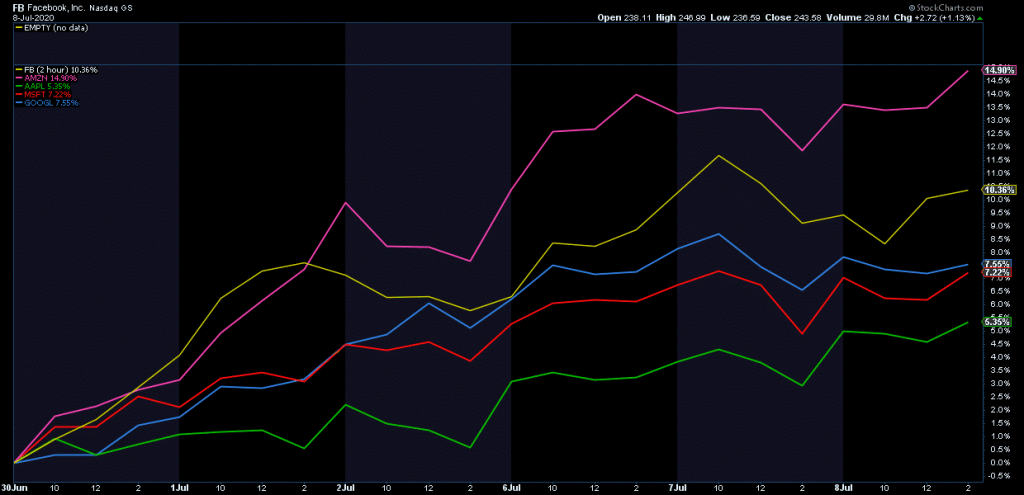
The S&P5, the so called FAAMG[ix] stocks, earlier this month added over a half a trillion in market cap in just 6 days. (Please see the chart[x] below showing the percentage return of these five stocks from June 29 to July 8.) In 2020, these stocks have added over $1.6 trillion in market cap[xi], a striking feat during any bull market with excellent growth, not a historic recession. Sure, some of these companies may have grabbed market share and pulled some sales forward during the shutdown but they all face anti-trust concerns which seem to be bi-partisan and international concerns. These stocks are disproportionately driving the market.
Certainly, economic data has seen a massive improvement from the recent historic collapses. However, it important to keep focused on year-over-year data and especially permanent job losses, which keep mounting. The chart[xii] below shows data from the US Department of Labor with the blue line indicating the number of temporarily laid off workers in the US and the yellow line displaying the number of permanently laid off workers.
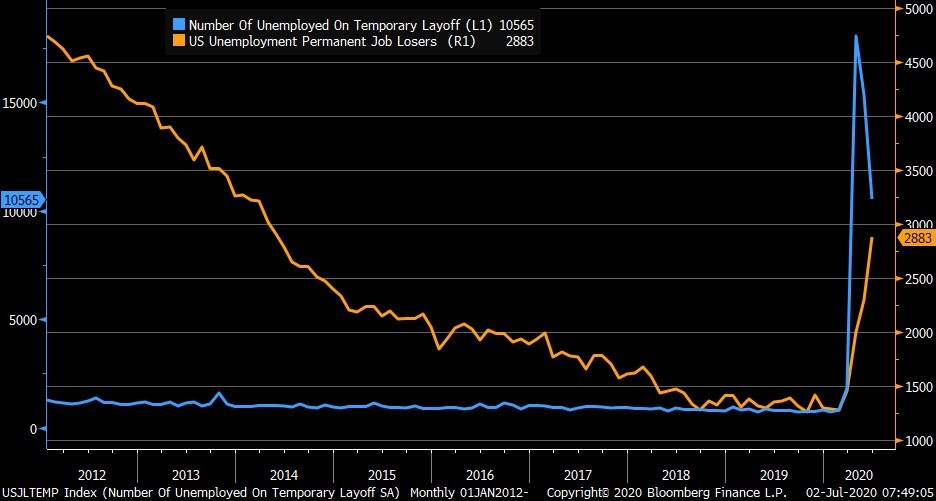
Today, past experience is not unworkable, but if relied on thoughtlessly it can be hazardous. Some events will play out in the future as they have in the preceding times, but many will not. As indicated above, markets are rich and driven by a few stocks and simultaneously, the U.S. is experiencing some of the worst economic conditions in a long time.
Based upon CIG’s investment process and what we saw in the markets, we had fortunately already started to get more conservative in 2019 in the Strategic and Dynamic portfolios. Fast forward to 2020, at the beginning of February when the markets became more volatile, we acted within the Dynamic portfolios to reduce risk further, primarily by reducing the portfolios’ exposures to equities and adding to diversifying assets generally believed to be protective in a downdraft. We continued to act in March to attempt to dial-in the appropriate market exposure in the Dynamic portfolios, increasing risk, primarily by adding equities, after the market bottomed on March 23.
Hopefully, our strategic and tactical actions have allowed our clients to sleep better at night. CIG attempts in its client portfolios to get closer to the kiddie coaster experience versus the full rollercoaster ride of the S&P 500 index. The most important job is to strike the appropriate balance between offense and defense, i.e., the risk of losing money and the risk of missing opportunity. There will continue to be twists and turns along the ride but so far, all the previous scary rollercoaster rides in the market have concluded the same way: eventually, they stopped.
We will see in the coming months how the tug-of-war between Stimulus and COVID-19 plays out. There is probably nothing more path dependent than re-opening an economy in a pandemic. Let us hope for the best – a confidence-inspiring Goldilocks-style “not-too-fast / not-too-slow” opening, while also considering the myriad of possible economic and financial outcomes. Of course, never ignore the extreme risks which do not appear to be going away, especially as positive COVID-19 cases trend higher. We continue to be thoughtful, adaptable and at your service.
[i] Calculated from data obtained from Yahoo Finance, as of July 27, 2020
[ii] Cornerstone Macro, CSM Weekly Narrative, July 26, 2020, page 2.
[iii] Coronavirus.jhu.edu/map.html, as of July 30, 2020.
[iv] Calculated from data obtained from Yahoo Finance, as of July 27, 2020
[v] Bespoke Investment Group, July 2020
[vi] Calculated from data obtained from Yahoo Finance, as of July 27, 2020
[vii] Bloomberg as of July 30, 2020
[viii] Source: U.S. Bureau of Economic Analysis
[ix] Facebook, Apple, Amazon, Microsoft, Google
[x] StockCharts.com via NorthmanTrader on July 9, 2020
[xi] “Warning”, NorthmanTrader, July 9, 2020
[xii] U.S. Department of Labor via Bloomberg as of July 6, 2020.

CIG Asset Management Update March 2020: March Madness
Market volatility continued through the month of March and continues month to date at extreme levels. Long time readers of our updates know that we have been warning about asset bubbles and Central Banks’ recent actions since last year. Valuation, volatility and liquidity are the three main areas that we believe investors should focus on right now.
Valuation: In spite of a -20% year to date return for the S&P 500(1) through March 31st, U.S. stock market valuations are still quite high relative to the size of the U.S. economy on a historical basis. The ratio of total U.S. market capitalization to GDP (TMC/GDP), reached an all-time high of 151.3% in December 2019(2). As a result of the sharp sell-off in March 2020, TMC/GDP dropped -21% to 119.2% as of March 30th(2). As easy as it is to measure total market capitalization on a daily basis, nobody knows how much or for how long the U.S. economy (GDP) will decline. The TMC/GDP ratio fell to 75 or lower during the post-Dot Com recession in 2001 and the Great Financial Crisis in 2009. An argument could be made that if the contraction in the economy is large and persistent enough, the U.S. stock market may not have yet seen its low.

Volatility: March witnessed two of the top 20 daily percentage gains and two of the top 20 percentage daily losses for the Dow Jones Industrials Average (Dow), ever(3). Generally, these periods of extreme moves to the upside and downside have not occurred at or near market bottoms. Major market bottoms have occurred once volatility becomes more muted. Please reference the table below. As of this writing, we can add an additional top 20 up day. The Dow was up +7.7% on April 6, 2020(3).

Liquidity: Following the rare emergency interest rate cut on March 3rd, the Fed cut the fed funds rate again by 1% to a 0 to 0.25% range at a subsequent emergency meeting on Sunday, March 14th. The Fed balance sheet expanded by an average $1 million per second from March 18th to March 31st. Bank of America believes the balance sheet could expand to $9 trillion by the end of the year (~40% of the U.S. economy.)(4) This is an exponential move from the expansion that began in late 2018. Typically, when the Federal Reserve pumps money into the financial system, stock market volatility calms down. In spite of unprecedented Fed action, volatility in March remained high. In fact, for the month of March, the stock market as measured by the S&P 500, moved intra-day an average of 5%, the most for any month on record. Even through the depths of the Depression or the Great Financial Crisis, the average intra-day move did not surpass 4%.(5)

Despite the continued ups and down, we would offer a little additional commentary beyond what we have discussed in the two recent webinars and above. For March, the numbers speak for themselves. The S&P 500(1) lost -12.4%, while the MSCI EAFE Net Index(6) of developed international equities was down -13.3% and the Emerging Markets Net Index(6) declined -15.4%. The Barclays U.S. Aggregate Total Return Index (7) returned -0.6% last month. The Barclays US High Yield Index(7) decreased -11.5% for the month. Hopefully, you are not too glued to CNBC or Fox Business News which we have warned house-bound market watchers about, given the media’s continued emotional rollercoaster and market manipulation (yes, we are talking about you, Bill Ackman).
In March, we kept our heads down and continued to focus on the one of the most important aspects of our relationship with clients. Beyond the investment expertise that we offer, our job is to ensure when times like this arise that we work together to restrain any exuberant investment behaviors as well as moderate our fearful investment behaviors.
The actions that we took in March in the Dynamic portfolios exemplify this goal. When the ten-year Treasury bond declined to an all-time low yield, we reduced portfolios exposures to long-term bonds. As you may recall, prices increase when bond yields fall. When it appeared that equity markets were temporarily bottoming, we increased our stock market exposure by adding to the equity hedge fund manager. During the last week of the month, when it looked like the House of Representatives would approve the CARES Act, we increased Treasury Inflation Protected Securities (TIPs) and more market sensitive equity positions. Overall, the Dynamic portfolios ended the month with more stock market exposure but not dramatically so.
Last week, we began our quarterly rebalancing of portfolios towards their strategic targets. We identified some areas that seem to be successful in this current environment, and we reduced cash and bonds that previously worked but are less likely to do so going forward. We are taking incrementally more risk via adding to defensive equities like healthcare and consumer staples. In certain portfolios, we added a “value-add” fund that is focused on a trend-following process which can work in higher-volatility markets.
On a positive note, we would quote Dr. Anthony Fauci: “You can’t rush the science, but when the science points you in the right direction, then you can start rushing.”(8) We have many laboratories looking to develop and roll out a vaccine. When the science is ready, a solution to the virus could come well before the usual 18 months. Even if we end up “going old school” and transferring plasma from previously infected individuals, we will get to the mountaintop and, ultimately, see a safer public health, economic and investment environment. Until then, we will continue to very nimble and proactive as we manage the portfolio allocation.
This report was prepared by CIG Asset Management and reflects the current opinion of the authors. It is based upon sources and data believed to be accurate and reliable. Opinions and forward-looking statements expressed are subject to change without notice. This information does not constitute a solicitation or an offer to buy or sell any security.
- Calculated from data obtained from Yahoo Finance, as of April 1, 2020.
- https://www.gurufocus.com/stock-market-valuations.php
- https://en.wikipedia.org/wiki/List_of_largest_daily_changes_in_the_Dow_Jones_Industrial_Average
- “How big could the Fed’s balance sheet get?” Financial Times, April 5, 2020 citing report from Bank of America
- Bloomberg, Jonathan Ferro as of March 31, 2020
- MSCI, as of April 1, 2020.
- NEPC
- https://www.brainyquote.com/lists/authors/top-10-anthony-fauci-quotes
